. 2023 Apr 6;30(4):396-414.e9.
doi: 10.1016/j.stem.2023.03.010.

Gene editing to prevent ventricular arrhythmias associated with cardiomyocyte cell therapy

Affiliations

Gene editing to prevent ventricular arrhythmias associated with cardiomyocyte cell therapy

Silvia Marchiano et al. Cell Stem Cell. .

Erratum in

  • Gene editing to prevent ventricular arrhythmias associated with cardiomyocyte cell therapy.
    Marchiano S, Nakamura K, Reinecke H, Neidig L, Lai M, Kadota S, Perbellini F, Yang X, Klaiman JM, Blakely LP, Karbassi E, Fields PA, Fenix AM, Beussman KM, Jayabalu A, Kalucki FA, Potter JC, Futakuchi-Tsuchida A, Weber GJ, Dupras S, Tsuchida H, Pabon L, Wang L, Knollmann BC, Kattman S, Thies RS, Sniadecki N, MacLellan WR, Bertero A, Murry CE. Marchiano S, et al. Cell Stem Cell. 2023 May 4;30(5):741. doi: 10.1016/j.stem.2023.04.010. Cell Stem Cell. 2023. PMID: 37146587 Free PMC article. No abstract available.

Abstract

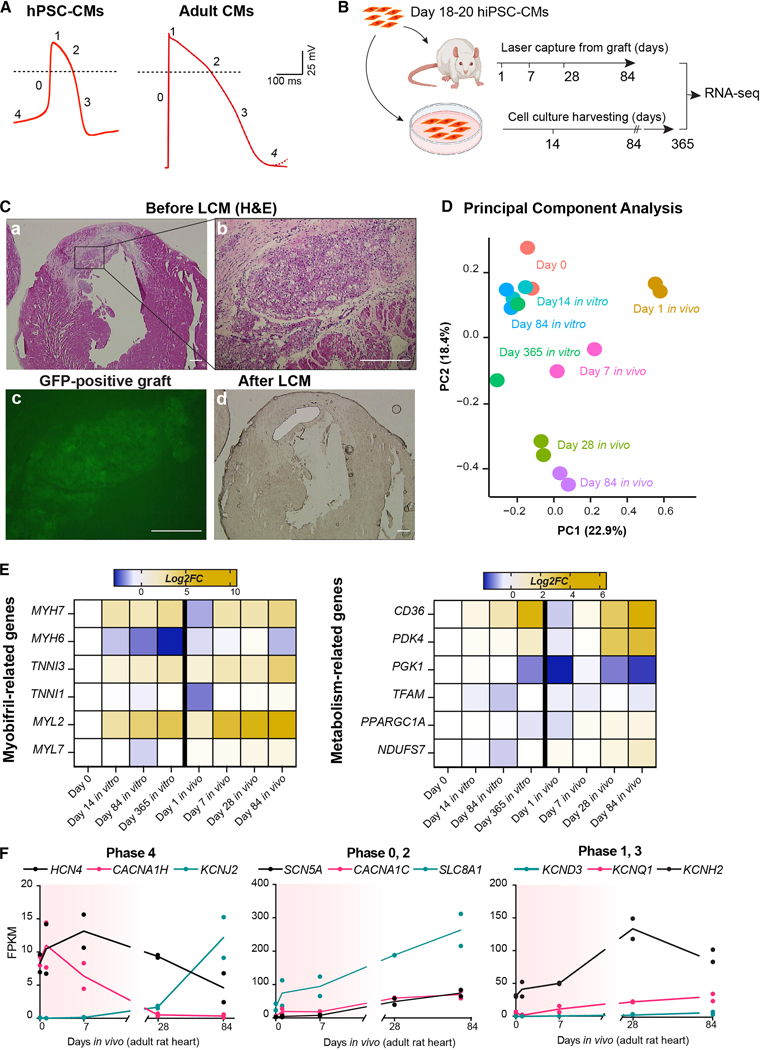
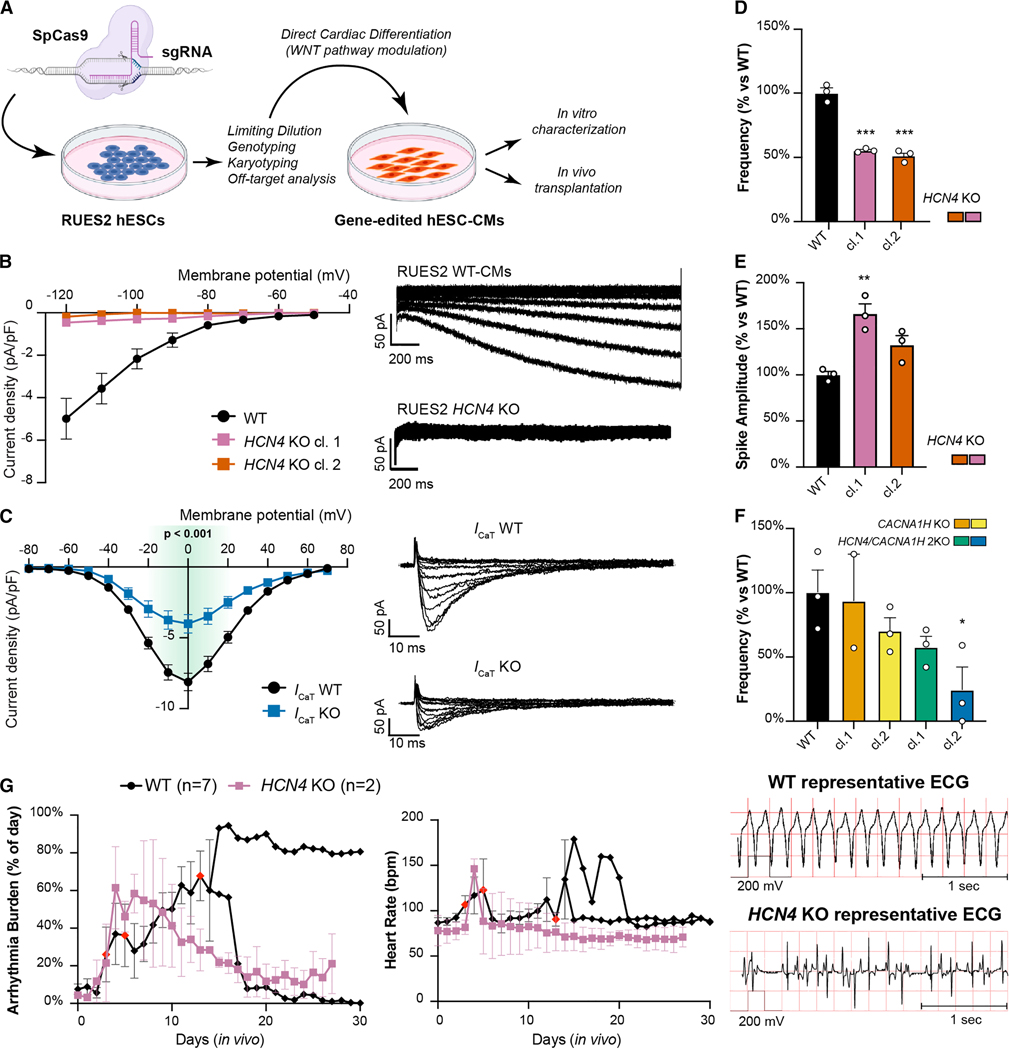
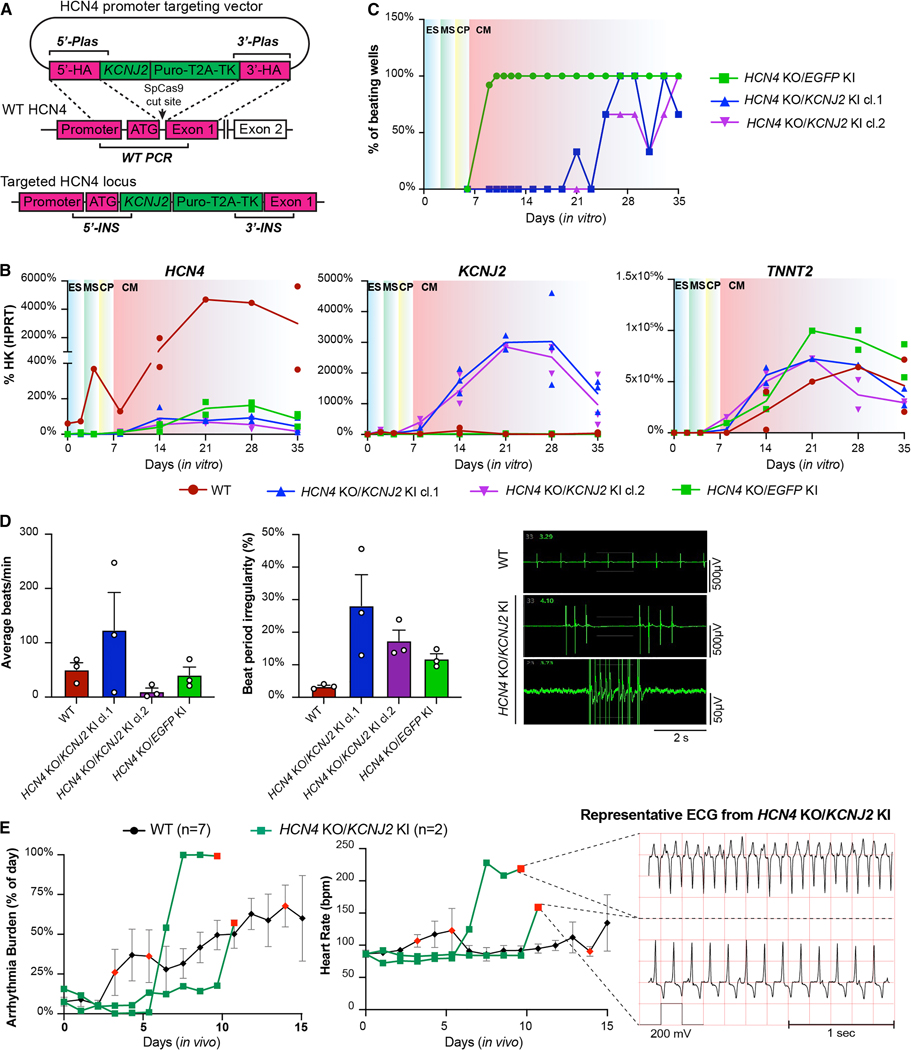
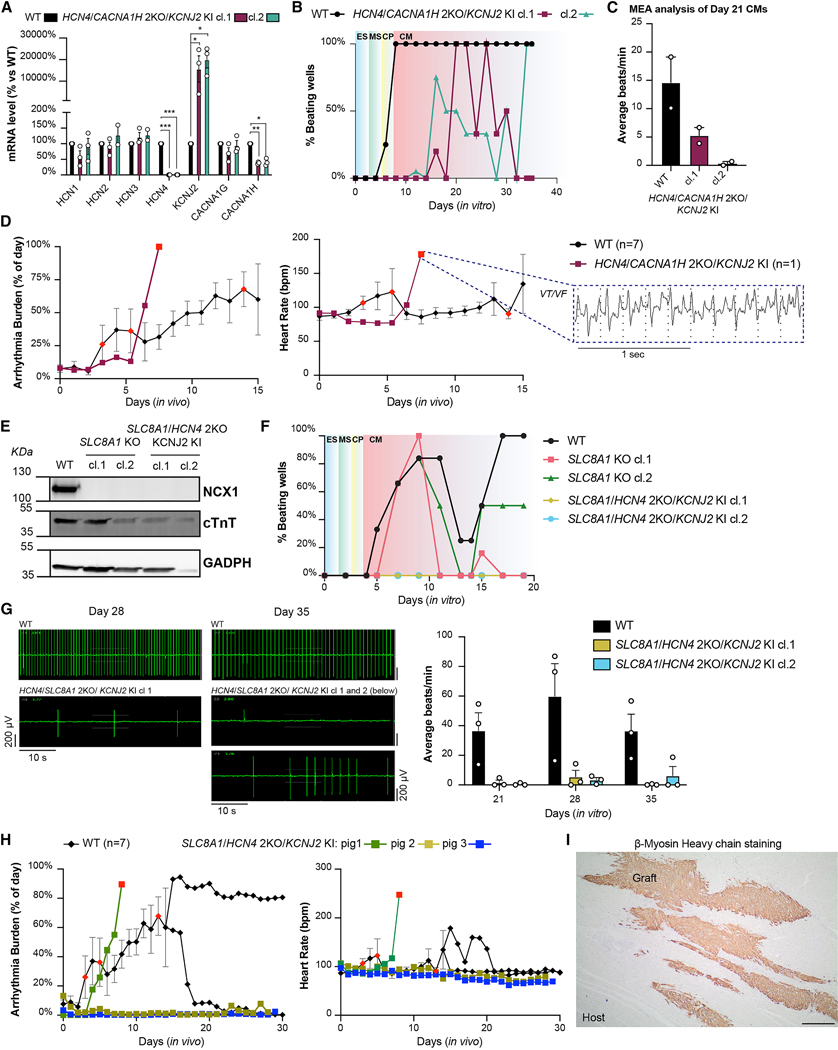
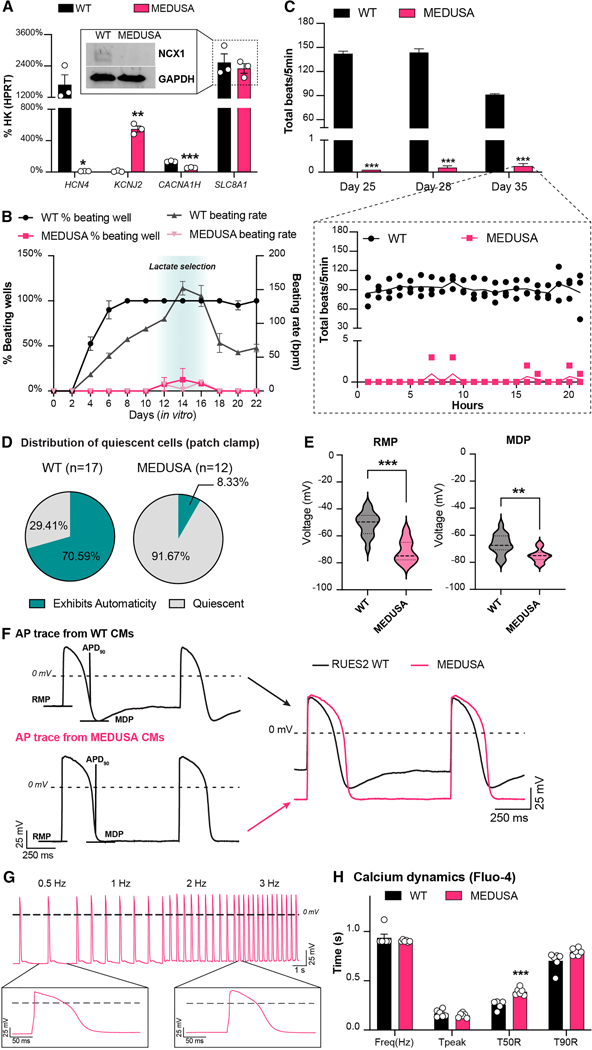
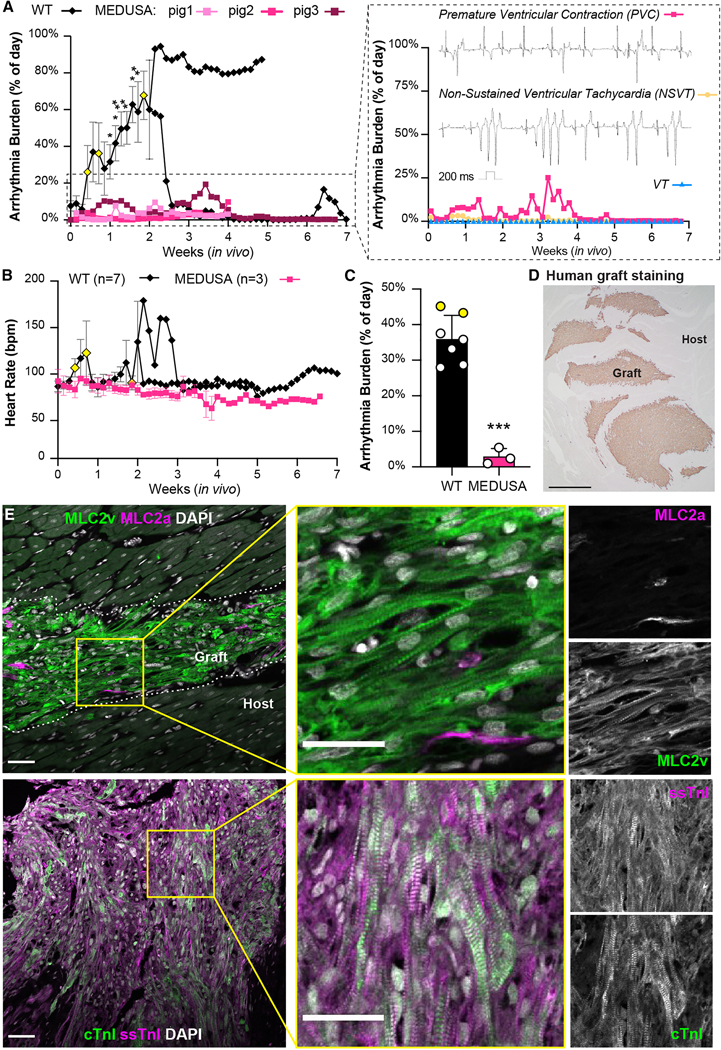
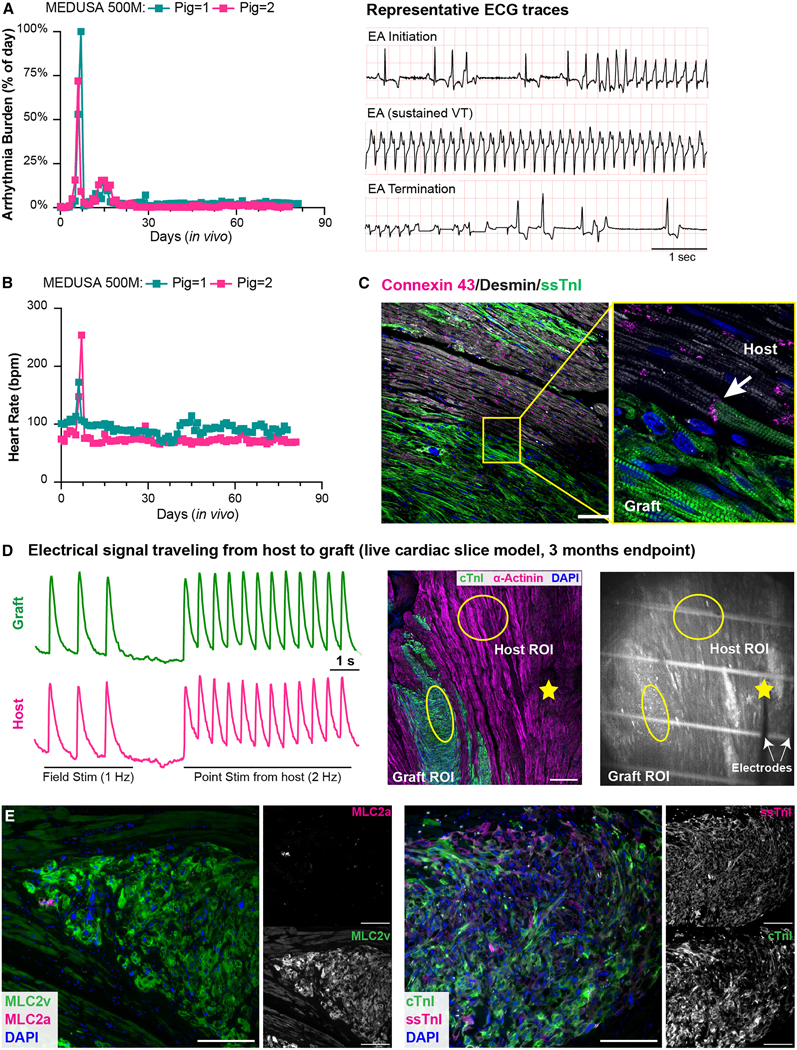
Human pluripotent stem cell-derived cardiomyocytes (hPSC-CMs) offer a promising cell-based therapy for myocardial infarction. However, the presence of transitory ventricular arrhythmias, termed engraftment arrhythmias (EAs), hampers clinical applications. We hypothesized that EA results from pacemaker-like activity of hPSC-CMs associated with their developmental immaturity. We characterized ion channel expression patterns during maturation of transplanted hPSC-CMs and used pharmacology and genome editing to identify those responsible for automaticity in vitro. Multiple engineered cell lines were then transplanted in vivo into uninjured porcine hearts. Abolishing depolarization-associated genes HCN4, CACNA1H, and SLC8A1, along with overexpressing hyperpolarization-associated KCNJ2, creates hPSC-CMs that lack automaticity but contract when externally stimulated. When transplanted in vivo, these cells engrafted and coupled electromechanically with host cardiomyocytes without causing sustained EAs. This study supports the hypothesis that the immature electrophysiological prolife of hPSC-CMs mechanistically underlies EA. Thus, targeting automaticity should improve the safety profile of hPSC-CMs for cardiac remuscularization.

Keywords: arrhythmia; automaticity; cardiac remuscularization; cell therapy; engraftment arrhythmia; hPSC-CM maturation; heart regeneration; human pluripotent stem cell-derived cardiomyocytes; myocardial infarction; pacemaker.


Conflict of interest statement

Declaration of interests K.N., B.C.K., and W.R.M. were advisors to Sana Biotechnology. M.L., A.J., F.A.K., A.F.T., S.D., H.T., L.P., S.K., R.S.T., and C.E.M. were employees while part of this study was performed and continue to hold equity in Sana Biotechnology. S.M., H.R., A.B., and C.E.M. have submitted a provisional patent application pertaining to the work in this manuscript (PCT/US2022/027382).

Figures

Figure 1.
Figure 1.. Gene expression analysis of hiPSC-CMs during in vivo transplantation compared to 2D culture.
(A) Representative action potential traces from hESC-CMs and adult ventricular CMs (dotted line indicates 0 mV). Adult CMs adapted from Karbassi et al. (B) Experimental layout for RNA-seq experiments. (C) Representative hematoxylin and eosin-stained (H&E) histological analyses of rat heart engrafted with hiPSC-CMs at day 84 after injection (a-b), and adjacent unstained sections showing the graft site before (c, fluorescence image of GCaMP3 signal) and after laser capture microdissection (LCM; d, brightfield image). Scale bar = 200 μm for a, d; 50 μm for b, c. (D) Principal component analysis (PCA) of RNA-seq data set described in B. The percentage of gene expression variance expressed by each PC is indicated. Day 0 indicates hiPSC-CMs in vitro at day 18–21 as depicted in B. (E) RNA-seq expression heatmap of selected maturation-related genes (data plotted as average log2 fold-change from day 0 for three biological replicates). (F) Selected RNA-seq data for ion channels involved in AP. Red shading indicates the approximate window of engraftment arrhythmia. See also Supplementary Figs. 1C, D.
Figure 2.
Figure 2.. Ablation of HCN4 and CACNA1H is not sufficient to prevent automaticity of hESC-CMs.
(A) Experimental layout for the generation of gene-edited cell lines, cardiac differentiation, and in vitro/in vivo characterization. SpCas9: Streptococcus pyogenes Cas9, sgRNA: single-guide RNA. (B, C) Patch clamp analyses of funny current (If) from HCN4 knockout (B) and T-type calcium current (C) from CACNA1H KO, compared to WT cardiomyocytes. (For If, WT: n = 7, HCN4 KO cl.1: n = 6, HCN4 KO cl. 2: n = 4; for ICaT WT: n=22, KO: n=15). Representative current traces showed on the right. Differences in ICaT vs. WT by two-way ANOVA with Sidak correction for multiple comparison (green-shaded area from −20 mV to +20 mV, p < 0.001). The traces for ICaT were recorded from quadruply edited MEDUSA hESC-CMs and reported here with the parental line for simplicity (see also Supplementary Fig. 3A for detail of gene-editing strategy). (D - F) Spontaneous electrical activity of gene-edited hESC-CMs on MEA system. Data shown as mean ± SEM of 2–3 independent experiments each with 8 technical replicates, and normalized on WT frequency (D and F) or WT spike amplitude (E). Statistical differences are reported vs. WT hESC-CMs by one-way ANOVA with Sidak correction for multiple comparisons (* p <0.05, ** p < 0.01 and *** p <0.001). (G) Quantification of engraftment arrhythmia burden (% of time each day) and heart rate after transplanting HCN4 KO hESC-CMs compared to WT hESC-CMs. Data shown as mean ± SEM for HCN4 KO (N = 2) and WT controls up to day 14 and as individual animals thereafter (N = 7 for starting cohort, then N = 2, shown as individual trace). Red-colored symbols represent animals that reached endpoints as defined in the Method section. Representative ECG traces shown on the right.
Figure 3.
Figure 3.. HCN4 and KCNJ2 perturbation is not sufficient to prevent automaticity or EA.
(A) Gene-editing approach to knock-in KCNJ2 under the transcriptional control of the HCN4 promoter in RUES2 hESCs. Genotyping PCR strategies for on- and off-target insertions are indicated; see also Supplementary Figure 4A. (B) Time course qRT-PCR analysis of HCN4, KCNJ2 and TNNT2 expression during cardiac differentiation of the indicated WT and gene-edited hESCs. ES: embryonic stem cell, MS: mesoderm, CP: cardiac progenitor, CM: cardiomyocyte. N = 2 differentiations per cell line. (C) Representative quantification of spontaneous beating during hESC-CM differentiation from HCN4 KO/KCNJ2 KI clones compared to WT. See Methods for details on quantification. (D) Spontaneous activity of HCN4 KO/KCNJ2 KI clones quantified by MEA, and representative traces. Given the marked irregularity of automaticity in these lines, data are reported as average beats in 5 min recording (left panel) and the corresponding % beat irregularity (right panel), calculated as standard deviation of the beat period record in 100 sec, divided by the mean of the beat period in that same period. Data are plotted as mean ± SEM of 3 independent experiments each with 8 technical replicates. (E) In vivo data showing EA burden (left panel) and heart rate of animals transplanted with HCN4 KO/KCNJ2 KI hESC-CMs compared to WT, with representative ECG traces on the right. Data shown for WT controls as described in Fig. 2G and individual traces (N = 2) for HCN4 KO/KCNJ2 KI. Red-colored symbol represents animals that reached prespecified EA endpoints leading to withdrawal from the study, as defined in the Methods section.
Figure 4.
Figure 4.. Triple gene edits decrease automaticity but do not fully prevent EA.
(A) qRT-PCR gene expression analysis of HCNs, T-type ion channel genes, and KCNJ2 in HCN4/CACNA1H 2KO/KCNJ2 KI compared to WT hESC-CMs at day 14 of differentiation. Data shown as mean ± SEM of 3 independent experiments normalized on WT. Differences vs. WT by multiple paired t test (* p <0.05, ** p <0.01 and *** p <0.001). (B) Representative onset of beating during cardiac differentiation in HCN4/CACNA1H 2KO/KCNJ2 KI hESC-CMs. (C) MEA analysis of HCN4/CACNA1H 2KO/KCNJ2 KI clones compared to WT hESC-CMs. Data are shown as average beats/min recorded in 5 min ± SEM of 2 independent experiments with 8 replicates each. See also Supplementary Fig. 5F. (D) Arrhythmia burden and heart rate of one pig engrafted with HCN4/CACNA1H 2KO /KCNJ2 KI hESC-CMs compared to WT (N = 7), and representative EKG traces during EA. Data shown as described in Fig. 3E. Red-colored symbols represent animals that reached prespecified EA endpoints and withdrawn from the study as described in the Methods section. (E) Western blot of NCX1 KO clones compared to WT hESC-CMs. cTnT: cardiac troponin T. (F) Representative time course analysis of onset of beating during cardiac differentiation of SLC8A1 KO clones compared to WT. (G) Representative field potential traces and quantifications of SLC8A1 KO clones at different points of a 2 weeks culture on MEA plates. Data shown as average beats/min recorded in 5 min ± SEM of 3 independent experiments with 4 replicates each. (H) EA burden and respective heart rate of pigs transplanted with SLC8A1/HCN4 2KO/KCNJ2 KI hESC-CMs compared to WT. Data shown for WT controls as mean ± SEM up to 14 and as individual animals thereafter (N = 7 for starting cohort), and for SLC8A1/HCN4 2KO/KCNJ2 KI as individual traces to demonstrate heterogeneity (N = 3); Red-colored symbols represents animals withdrawn from the study due to death and/or EA severity, as described in Methods section. (I) Representative histological analysis of SLC8A1/HCN4 2KO/KCNJ2 KI graft 4 weeks after injection, stained with human-specific β-myosin heavy chain antibody. Scale bar = 200 μm.
Figure 5.
Figure 5.. In vitro characterization of MEDUSA hESC-CMs.
(A) qRT-PCR of gene-edited ion channels in MEDUSA hESC-CMs compared to WT control. Data shown as mean ± SEM of 3 independent experiments. Statistical differences are reported vs. WT hESC-CMs by unpaired t-test (* p <0.05, ** p < 0.01 and *** p <0.001). Insert showing western blotting analysis for NCX1 in MEDUSA hESC-CMs, see also Supplementary Figs. 5E, F. (B) Onset of beating and beating rate during cardiac differentiation of MEDUSA hESC-CMs. Data shown as mean ± SEM of 2 independent batches of monolayer differentiation (12-wells/cell line per batch of differentiation). See Methods section for details on quantification. (C) Representative MEA analysis of MEDUSA hESC-CMs cultured for 2 weeks on MEA plates. Data shown as average ± SEM of total beats recorded for 5 min every hour. Spontaneous activity at day 35 is shown as continuous recording for 20 hours, panel below. Differences vs. WT hESC-CMs by two-way ANOVA with Sidak correction (*** p < 0.001). (D) Distribution of quiescent and spontaneously depolarizing cells in patch clamp preparation. (E) Quantification of patch clamp metrics under pacing condition (RMP: resting membrane potential; MDP: maximum diastolic potential). Data shown as violin plots of 16 WT and 11 MEDUSA hESC-CMs. Differences vs. WT hESC-CMs by unpaired t-test with Welch’s correction (**p<0.01, ***p<0.001). (F) AP traces of WT and MEDUSA hESC-CMs after electrical stimulation (RMP, MDP as in 5E; APD90: action potential at 90% repolarization). (G) Representative AP traces of MEDUSA hESC-CMs stimulated at 0.5 – 3 Hz, during patch clamp experiments. (H) Calcium transient analysis of WT and MEDUSA hESC-CMs during pacing at 1 Hz. Data shown as mean ± SEM of 12 individual cells/cell line. Statistical differences are shown by multiple unpaired t-test (***p<0.001). Representative traces shown in Supplementary Fig. 5H.
Figure 6.
Figure 6.. Characterization of MEDUSA hESC-CMs in vivo.
(A, B) Arrhythmia burden and heart rate of pigs receiving 150M MEDUSA CMs and monitored with telemetry up to 7 weeks post-transplantation. Data shown for WT controls as mean ± SEM as detailed in Fig. 2G. Yellow-colored symbols represent animals that reached EA severity endpoints leading to study withdrawal as defined in Methods section. Insert from panel in A shows arrhythmia from pig N.3 subdivided in isolated premature ventricular contraction (PVC), non-sustained VT (NSVT) and VT, with relative representative ECG traces. (C) Aggregate analysis of combined EA daily burden (VT, NSVT, PVC) for WT and MEDUSA hESC-CMs for the first 2 weeks after transplantation. Data shown as mean ± SEM of animals receiving either WT (N=7) or MEDUSA hESC-CMs (N=3). Yellow-colored symbols represent animals analyzed until EA severity necessitated their withdrawal from the study (day 4 and day 6, respectively; see also panel A and Supplementary Fig. 6A). Differences vs. WT by unpaired t-test (*** p <0.001). (D) Representative image of MEDUSA hESC-CMs graft 7 weeks after injection stained with human-specific β-myosin heavy chain. Scale bar = 1 mm. Note the large, multifocal graft throughout the host ventricle. (E) Low and high magnification immunofluorescence images of MLC2v/MLC2a and ssTnI/cTnI in MEDUSA-CMs grafts 4 weeks post transplantation. Single channels monochromatic images for both MLC2a/MLC2v and ssTnI/cTnI shown on the right. Dotted lines indicate host/graft interface. Scale bars = 50 μm for low magnifications; 20 μm for high magnification.
Figure 7.
Figure 7.. Electromechanical coupling of high-dose MEDUSA hESC-CMs.
(A, B) Arrhythmia burden and heart rate of animals receiving 500M MEDUSA hESC-CMs (N = 2). Panel A shows the cumulative incidence of sustained VT, PVC, and NSVT; See also Supplementary Figs. 6B. Right panel in A showing representative ECG traces of one animal transitioning without intervention from sustained VT to sinus rhythm. (C) Representative immunofluorescence images of 3 months old MEDUSA grafts stained with Connexin 43 (white arrows indicate junctions between host, Desmin/graft, ssTnI. Scale bars = 100). (D) Cardiac slice model of 12 weeks old MEDUSA-CMs grafts loaded with Fluo-4 and paced with field and point stimulation from host region; mid panel showing immunofluorescence image indicating graft and host in the cardiac slice studied are shown. Yellow circle indicates ROI for Fluo-4 recording, yellow star indicates point stimulation location. Scale bar = 500 μm. Right panel showing one frame from Supplementary Video 2 showing parallel bipolar electrodes placement. White lines are plastic monofilament used to keep the cardiac slice in place during recording. (E) MLC2a/MLC2v (left) and ssTnI/cTnI (right) staining of 3 months-old MEDUSA grafts, with relative monochromatic images on the right side. Scale bar: 200 μm.

Comment in

Similar articles

Cited by

References

    1. Bergmann O, Bhardwaj RD, Bernard S, Zdunek S, Barnabe-Heider F, Walsh S, Zupicich J, Alkass K, Buchholz BA, Druid H, et al. (2009). Evidence for cardiomyocyte renewal in humans. Science 324, 98–102. 10.1126/science.1164680. - DOI - PMC - PubMed
    1. Marchiano S, Bertero A, and Murry CE (2019). Learn from Your Elders: Developmental Biology Lessons to Guide Maturation of Stem Cell-Derived Cardiomyocytes. Pediatr Cardiol 40, 1367–1387. 10.1007/s00246-019-02165-5. - DOI - PMC - PubMed
    1. Velagaleti RS, Pencina MJ, Murabito JM, Wang TJ, Parikh NI, D’Agostino RB, Levy D, Kannel WB, and Vasan RS (2008). Long-term trends in the incidence of heart failure after myocardial infarction. Circulation 118, 2057–2062. 10.1161/CIRCULATIONAHA.108.784215. - DOI - PMC - PubMed
    1. Prabhu SD, and Frangogiannis NG (2016). The Biological Basis for Cardiac Repair After Myocardial Infarction: From Inflammation to Fibrosis. Circ Res 119, 91–112. 10.1161/CIRCRESAHA.116.303577. - DOI - PMC - PubMed
    1. Diseases GBD, and Injuries C (2020). Global burden of 369 diseases and injuries in 204 countries and territories, 1990–2019: a systematic analysis for the Global Burden of Disease Study 2019. Lancet 396, 1204–1222. 10.1016/S0140-6736(20)30925-9. - DOI - PMC - PubMed

Publication types