. 2023 Apr 27;186(9):1846-1862.e26.
doi: 10.1016/j.cell.2023.03.011. Epub 2023 Apr 6.

Dietary tryptophan metabolite released by intratumoral Lactobacillus reuteri facilitates immune checkpoint inhibitor treatment

Affiliations

Dietary tryptophan metabolite released by intratumoral Lactobacillus reuteri facilitates immune checkpoint inhibitor treatment

Mackenzie J Bender et al. Cell. .

Abstract

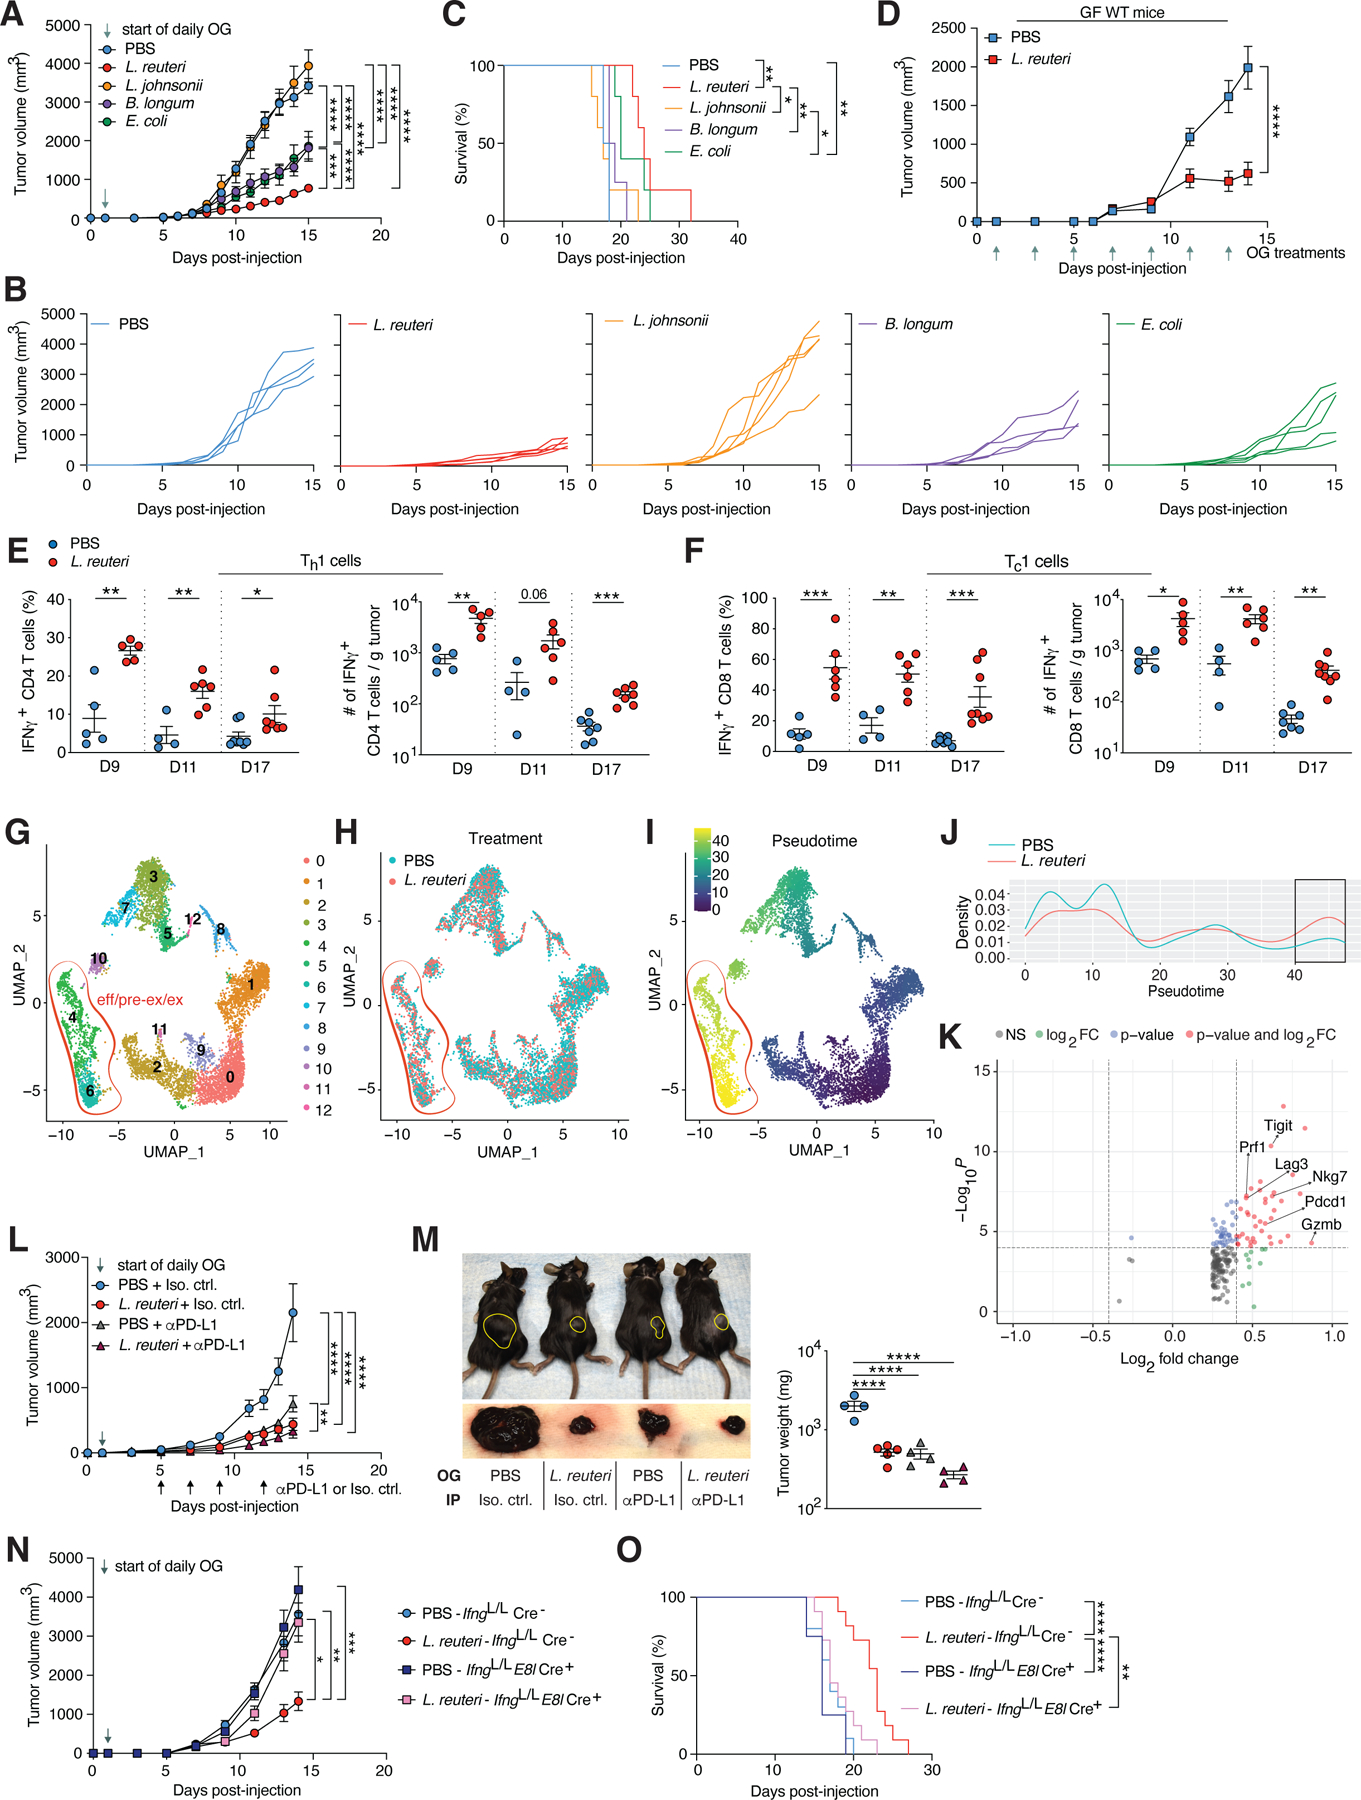
The use of probiotics by cancer patients is increasing, including among those undergoing immune checkpoint inhibitor (ICI) treatment. Here, we elucidate a critical microbial-host crosstalk between probiotic-released aryl hydrocarbon receptor (AhR) agonist indole-3-aldehyde (I3A) and CD8 T cells within the tumor microenvironment that potently enhances antitumor immunity and facilitates ICI in preclinical melanoma. Our study reveals that probiotic Lactobacillus reuteri (Lr) translocates to, colonizes, and persists within melanoma, where via its released dietary tryptophan catabolite I3A, it locally promotes interferon-γ-producing CD8 T cells, thereby bolstering ICI. Moreover, Lr-secreted I3A was both necessary and sufficient to drive antitumor immunity, and loss of AhR signaling within CD8 T cells abrogated Lr's antitumor effects. Further, a tryptophan-enriched diet potentiated both Lr- and ICI-induced antitumor immunity, dependent on CD8 T cell AhR signaling. Finally, we provide evidence for a potential role of I3A in promoting ICI efficacy and survival in advanced melanoma patients.

Keywords: Lactobacillus reuteri; aryl hydrocarbon receptor; immune checkpoint inhibitor; indole-3-aldehyde; melanoma; microbial AhR ligands; microbial-host crosstalk; tryptophan; tumor microbiome.


Conflict of interest statement

Declaration of interests D.A.A.V.: cofounder and stock holder—Novasenta, Tizona, Trishula; stock holder—Oncorus, Werewolf; patents licensed and royalties—Novasenta, BMS; scientific advisory board member—Tizona, Werewolf, F-Star, Bicara, Apeximmune, T7/Imreg Bio; consultant—BMS, Almirall, Incyte, G1 Therapeutics, Inzen Therapeutics, Regeneron, Avidity Partners; research funding—BMS, Novasenta. A.V.J.: research funding—Mitsubishi Tanabe Pharma. J.F.P.: cofounder and stock holder—Gateway Biome Corporation. D.D.: grants/research support (institutional)—Arcus, CellSight Technologies, Immunocore, Merck, Regeneron Pharmaceuticals Inc., Tesaro/GSK; consultant: Clinical Care Options (CCO), Finch Therapeutics, Gerson Lehrman Group (GLG), Medical Learning Group (MLG), Xilio Therapeutics; CE Speakers’ Bureau—Castle Biosciences; intellectual Property includes US Patent 63/124,231, “compositions and methods for treating cancer,” December 11, 2020 and US Patent 63/208,719, “compositions and methods for determining responsiveness to immune checkpoint inhibitors (ICIs), increasing effectiveness of ICI and treating cancer,” June 9, 2021.

Figures

Figure 1.
Figure 1.. Lr potentiates ICI efficacy in melanoma via inducing IFNγ-producing CD8 T (Tc1) cells.
(A-C) B16-F0-tumor-bearing wild type (WT) mice administered daily oral gavage (OG) of Lr, Lji, Bl, Ec, or vehicle control (PBS), starting one day (D1) post tumor cell engraftment (pTCE) (n = 4–5 mice/group). (A) Tumor growth. (B) Individual tumor growth. (C) Survival. (D) Tumor growth of germ-free (GF) mice orally administered Lr or PBS every other day starting D1 pTCE (n = 4 mice/group). (E and F) Percentage (left) and total cells/gram (g) tumor tissue (right) of IFNγ+ CD4 T cells (Th1 cells) (E) and IFNγ+ CD8 T cells (Tc1 cells) (F) within the tumor microenvironment (TME) of mice orally administered Lr or PBS; see schematic in Figure S2A (n = 5–8 mice/group). (G-K) Single-cell RNA-sequencing analysis of TME TCRβ+ CD8 T cells on D15 from mice orally administered Lr or PBS daily starting D1 pTCE (n=4 mice/group). Red outlines in (G, H, and I) outline effector/pre-exhausted/exhausted CD8 T cell clusters 4 and 6. (G) Unsupervised hierarchical clustering and uniform manifold approximation and projection (UMAP). (H) Distribution of cells by treatment group. (I) Trajectory analysis showing overall pseudotime plot. (J) Quantification of pseudotime plot comparison by treatment group. Black rectangle outlines the eff/pre-ex/ex CD8 T cell cluster from (I). (K) Differential gene expression analysis by negbinom testing, representative effector and exhaustion markers indicated; FC, fold change. (L and M) B16-F0-tumor-bearing mice treated with Lr or PBS and αPD-L1 or isotype control (Iso. ctrl.) as indicated (n = 4–5 mice/group). (L) Tumor growth. (M) (Left) representative mouse images (top) and their respective tumors (bottom); (right) tumor weights on D14. Yellow outline designates tumors. (N and O) B16-F0-tumor-bearing mice orally administered Lr or PBS as indicated (n = 8–11 mice/group). (N) Tumor growth. (O) Survival. See also Figures S1–S4. (A, D, L, and N) represent mean ± SEM analyzed by two-way analysis of variance (ANOVA) with Sidak’s correction for multiple comparisons. (C and O) represent survival curves analyzed by log-rank test. (E and F) represent individual mice analyzed by unpaired t-test for each day. Mean ± SEM shown. (M) represents individual mice analyzed by one-way ANOVA with Sidak’s correction for multiple comparisons. Mean ± SEM shown. *P < 0.05, **P < 0.01, ***P < 0.001, ****P < 0.0001.
Figure 2.
Figure 2.. Intratumoral Lr is necessary and sufficient to promote antitumor immunity in melanoma.
(A and B) B16-F0-tumor-bearing mice orally administered Lr or PBS for four consecutive days starting on D8. Tumors harvested on D15. (n = 5 mice/group). (A) Representative images of tumor cultures. (B) Quantification of viable Lr within TME (see Fig. S5A). (C) Profile of live bacterial species recovered from tumors of mice treated as in (A). (D) Oligotype clustering of Lr colonies derived from tumor isolates of PBS- or Lr-treated mice. Data are representative of two independent experiments; positive control (white +) derived from the Lr WT strain used for OG. (E and F) B16-F0-tumor-bearing mice IT injected with Lr or peptone-tryptone-tryptophan media (PTT) as indicated (n = 5 mice/group). (E) Tumor growth. (F) Percentage of TME Tc1 cells on D14. (G) Survival of B16-F0-tumor-bearing mice treated with IT injections (Lr or PTT) every 3 days starting D10 (n = 5 mice/group). (H and J) B16-F0-tumor-bearing mice orally administered Lr or PBS and IT injected with ampicillin (AMP) or vancomycin (VAN) as indicated (n = 5 mice/group). ABX, antibiotics. (H) Tumor growth. (I) Survival. (J) Quantification of viable Lr within the TME. (K and L) B16-F0-tumor-bearing GF mice orally administered Lr or PBS and IT injected with AMP, VAN, or vehicle control (PBS) as indicated (n = 4 mice/group). (K) Quantification of viable Lr within the TME. (L) Tumor growth. See also Figure S5. (E, H, and L) represent mean ± SEM analyzed by two-way ANOVA with Sidak’s correction for multiple comparisons. (F) represents individual mice analyzed by unpaired t-test. Mean ± SEM shown. (G and I) represent survival curves analyzed by log-rank test. *P < 0.05, **P < 0.01, ***P < 0.001, ****P < 0.0001.
Figure 3:
Figure 3:. Lr-mediated tumor suppression occurs in a tumor- and Lr-antigen-independent fashion.
(A - C) Tumor growth (left) and detection of viable Lr within TME (right) of mice orally administered Lr or PBS as indicated (n = 5 mice/group). (A) YUMM1.7 melanoma-bearers. (B) MC38-adenocarcinoma-bearers. (C) MMTV-PyMT breast cancer-bearers. (D and E) B16-F0-tumor-bearing mice orally administered viable or heat-killed (HK) Lr or PBS as indicated (n = 5 mice/group). (D) Tumor growth. (E) Survival. (F and G) B16-F0-tumor-bearing mice IT injected with viable or HK Lr or PTT as indicated (n = 5 mice/group). (F) Tumor growth. (G) Survival. (A, B, C, D, and F) represent mean ± SEM analyzed by two-way ANOVA with Sidak’s correction for multiple comparisons. (E and G) represent survival curves analyzed by log-rank test. *P < 0.05, **P < 0.01, ***P < 0.001, ****P < 0.0001.
Figure 4.
Figure 4.. Lr-derived I3A is required and sufficient to induce Tc1 cell effector function and restrain tumor outgrowth.
(A-F) B16-F0-tumor-bearing mice orally administered Lr WT, Lr ΔArAT, or PBS as indicated. (A) Tumor growth (n = 11–12 mice/group). (B) Survival (n = 5 mice/group). (C) Percentage of TME Tc1 cells on D17 (n = 11–12 mice/group). (D) Quantification of Lr within TME of mice from (B). (E) Quantification of AhR activity within tumor homogenates (n= 6–8 mice/group). (F) I3A quantification within TME. (G and H) B16-F0-tumor-bearing mice orally administered I3A (20 mg/kg body weight (b.w.) or 40 mg/kg b.w.) or vehicle control (corn oil) as indicated (n = 5 mice/group). (G) Tumor growth. (H) Survival. (I) Percentage of TME Tc1 cells on D13 of mice orally administered I3A or corn oil daily starting D9 (n = 4–5 mice/group). (J and K) B16-F0-tumor-bearing mice treated with I3A or corn oil and αPD-L1 or Iso. ctrl. as indicated (n = 5 mice/group). (J) Tumor growth. (K) Tumor weights on D14. See also Figure S6. (A, G, and J) represent mean ± SEM analyzed by two-way ANOVA with Sidak’s correction for multiple comparisons. (B and H) represent survival curves analyzed by log-rank test. (C, E, F, and K) represent individual mice analyzed by one-way ANOVA with Sidak’s correction for multiple comparisons. Mean ± SEM shown. (I) represents individual mice analyzed by unpaired t-test. Mean ± SEM shown. *P < 0.05, **P < 0.01, ***P < 0.001, ****P < 0.0001.
Figure 5.
Figure 5.. Lr-derived I3A induces Tc1 cell immunity in a CD8 T cell-intrinsic and AhR-dependent manner in vitro and in vivo.
(A) IFNγ production by naïve CD8 T cells stimulated with αCD3/αCD28 ± Lr WT or ΔArAT supernatant, or PTT control (n = 3 mice/group). (B) Transcription factor enrichment analysis of DEGs between CD8 T cells treated with I3A vs. I3A + AhR inhibitor (from , Table S3, and Methods). (C) Representative histogram of mean fluorescent intensity (MFI) (left) and quantification (right) of CREB phosphorylation of CD8 T cells stimulated with αCD3/αCD28, ± I3A, and ± AhR Inhibitor. (D) CD8 T cell gene expression relative to Gapdh following stimulation with αCD3/αCD28 ± I3A and ± AhR Inhibitor. (E) Percentage of CD8 T cells treated as in (C) expressing IFNγ. (F-H) Ahr−/− CD8 T cells stimulated with αCD3/αCD28 ± I3A (F) Representative histogram of MFI (left) and quantification (right) of CREB phosphorylation. (G) Gene expression relative to Gapdh. (H) Percentage of cells expressing IFNγ. (I and J) B16-F0-tumor-bearing mice orally administered Lr or PBS as indicated (n = 6–9 mice/group). (I) Tumor growth. (J) Survival. (K and L) B16-F0-tumor-bearing mice orally administered I3A (40 mg/kg b.w.) or vehicle control (corn oil) as indicated (n = 5–7 mice/group). (K) Tumor growth. (L) Survival. (M) Percentage of TME Tc1 cells on D12 of mice orally administered 40 mg/kg b.w. I3A or corn oil starting on D8. Dotted line represents mean percentage of corn oil-treated Ahrf/f Cre mice (n = 5–8 mice/group). See also Figure S6. (A) represents 3 independent samples per group analyzed by one-way ANOVA with Sidak’s correction for multiple comparisons. Mean ± SEM shown. (C and E) represent 5 independent samples per group analyzed by RM one-way ANOVA with Sidak’s correction for multiple comparisons. (D) represents 4–5 independent samples per group analyzed by one-way ANOVA with Sidak’s correction for multiple comparisons. Median, upper and lower quartiles shown. (F and H) represent 4–5 independent samples per group analyzed by paired t-test. (G) represents 5 independent samples per group analyzed by unpaired t-test. Median, upper and lower quartiles shown. (I and K) represent mean ± SEM analyzed by two-way ANOVA with Sidak’s correction for multiple comparisons. (J and L) represent survival curves analyzed by log-rank test. (M) represents individual mice analyzed by one-way ANOVA with Sidak’s correction for multiple comparisons. Mean ± SEM shown. *P < 0.05, **P < 0.01, ***P < 0.001, ****P < 0.0001; ns, not significant.
Figure 6.
Figure 6.. Dietary tryptophan restrains tumor growth and facilitates ICI via activation of AhR within CD8 T cells.
(A-F) B16-F0-tumor-bearing mice placed on a low-tryptophan (Trp) diet (Trp LD) or high-Trp diet (Trp HD), prior to TCE and orally administered Lr or PBS as indicated. (A) Tumor growth (n = 8–9 mice/group). (B) Tumor weight on D17 (n = 4 mice/group). (C) Survival (n = 4–5 mice/group). (D) Tumor-intrinsic AhR activity of mice from (B). (E) AhR activity from (D) versus respective tumor weight from (B) of Trp HD mice. (F) Quantification of I3A in tumors from (A). (G and H) B16-F0-tumor-bearing mice placed on a Trp LD or HD prior to TCE (n = 12–20 mice/group). (G) Tumor growth. (H) Survival. (I and J) B16-F0-tumor-bearing mice placed on Trp LD or HD prior to TCE and treated IP with αPD-L1 or Iso. ctrl. as indicated (n = 4–5 mice/group). (I) Tumor growth. (J) Tumor weights on D14. See also Figure S7. (A, G and I) represent mean ± SEM analyzed by two-way ANOVA with Sidak’s correction for multiple comparisons. (C and H) represent survival curves analyzed by log-rank test. (B, D, F, and J) represent individual mice analyzed by one-way ANOVA with Sidak’s correction for multiple comparisons. Mean ± SEM shown. (E) represents individual mice analyzed by nonparametric Spearman correlation. *P < 0.05, **P < 0.01, ***P < 0.001, ****P < 0.0001.
Figure 7.
Figure 7.. Elevated systemic I3A abundance is associated with ICI-response in clinical melanoma.
(A-F) Serum metabolite assessment of advanced melanoma patients prior to αPD-1 and IFNα treatment start; NR, non-responder; R, responder. (A) I3A sera quantification. (B and C) Kaplan-Meier progression-free survival (PFS) curve (B) and overall survival curve (C) of patients stratified by I3A levels (n=12 patients/group). (D) Kyn sera quantification. (E and F) Kaplan-Meier progression-free survival (PFS) curve (E) and overall survival curve (F) of patients stratified by Kyn levels (n=12 patients/group). (G) B16-F0 tumor growth of mice IT injected with 200 μg/mL I3A, KYN, FICZ or vehicle control (10% Tween 20) as indicated (n = 5 mice/group). See also Figure S7. (A and D) represent individual patients analyzed by unpaired t-test. Violin plot showing median and upper and lower quartiles. (B, C, E, and F) represent survival curves analyzed by log-rank test. (G) represents mean ± SEM analyzed by two-way ANOVA with Sidak’s correction for multiple comparisons. *P < 0.05, ****P < 0.0001; ns, not significant.

Comment in

References

    1. Hodi FS, O’Day SJ, McDermott DF, Weber RW, Sosman JA, Haanen JB, Gonzalez R, Robert C, Schadendorf D, Hassel JC, et al. (2010). Improved survival with ipilimumab in patients with metastatic melanoma. N Engl J Med 363, 711–723. 10.1056/NEJMoa1003466. - DOI - PMC - PubMed
    1. Robert C, Thomas L, Bondarenko I, O’Day S, Weber J, Garbe C, Lebbe C, Baurain JF, Testori A, Grob JJ, et al. (2011). Ipilimumab plus dacarbazine for previously untreated metastatic melanoma. N Engl J Med 364, 2517–2526. 10.1056/NEJMoa1104621. - DOI - PubMed
    1. Topalian SL, Hodi FS, Brahmer JR, Gettinger SN, Smith DC, McDermott DF, Powderly JD, Carvajal RD, Sosman JA, Atkins MB, et al. (2012). Safety, activity, and immune correlates of anti-PD-1 antibody in cancer. N Engl J Med 366, 2443–2454. 10.1056/NEJMoa1200690. - DOI - PMC - PubMed
    1. Hamid O, Robert C, Daud A, Hodi FS, Hwu WJ, Kefford R, Wolchok JD, Hersey P, Joseph RW, Weber JS, et al. (2013). Safety and tumor responses with lambrolizumab (anti-PD-1) in melanoma. N Engl J Med 369, 134–144. 10.1056/NEJMoa1305133. - DOI - PMC - PubMed
    1. Miller BC, Sen DR, Al Abosy R, Bi K, Virkud YV, LaFleur MW, Yates KB, Lako A, Felt K, Naik GS, et al. (2019). Subsets of exhausted CD8(+) T cells differentially mediate tumor control and respond to checkpoint blockade. Nat Immunol 20, 326–336. 10.1038/s41590-019-0312-6. - DOI - PMC - PubMed

Publication types