. 2023 Jun 7;111(11):1776-1794.e10.
doi: 10.1016/j.neuron.2023.03.012. Epub 2023 Apr 6.

γ-Protocadherins control synapse formation and peripheral branching of touch sensory neurons

Affiliations

γ-Protocadherins control synapse formation and peripheral branching of touch sensory neurons

Shan Meltzer et al. Neuron. .

Abstract

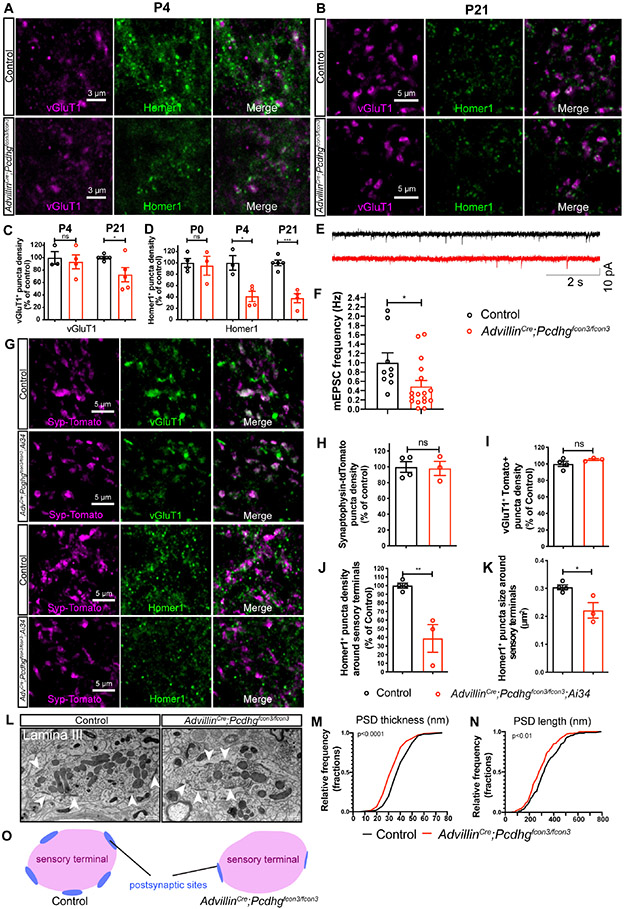
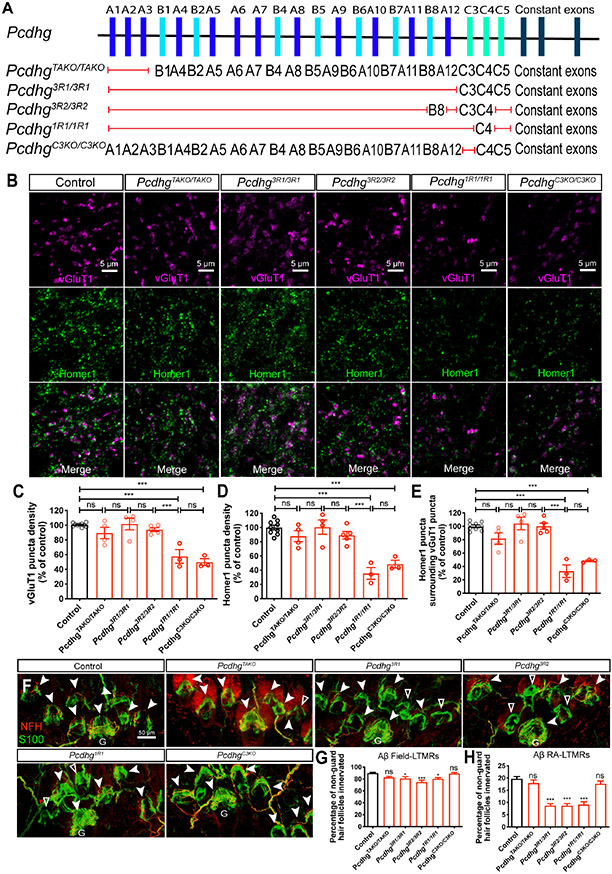
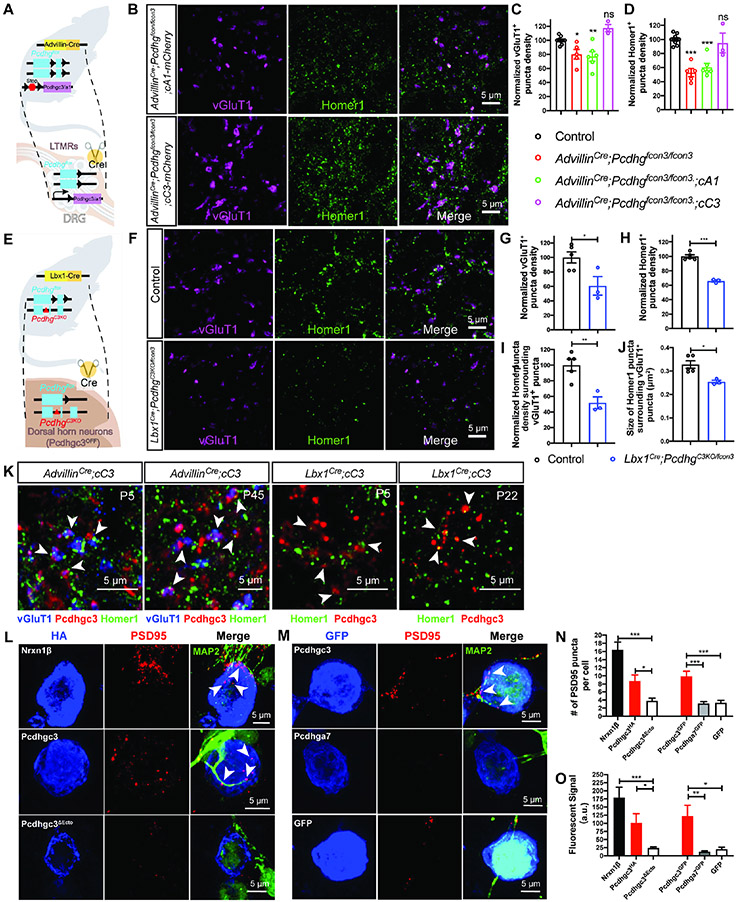
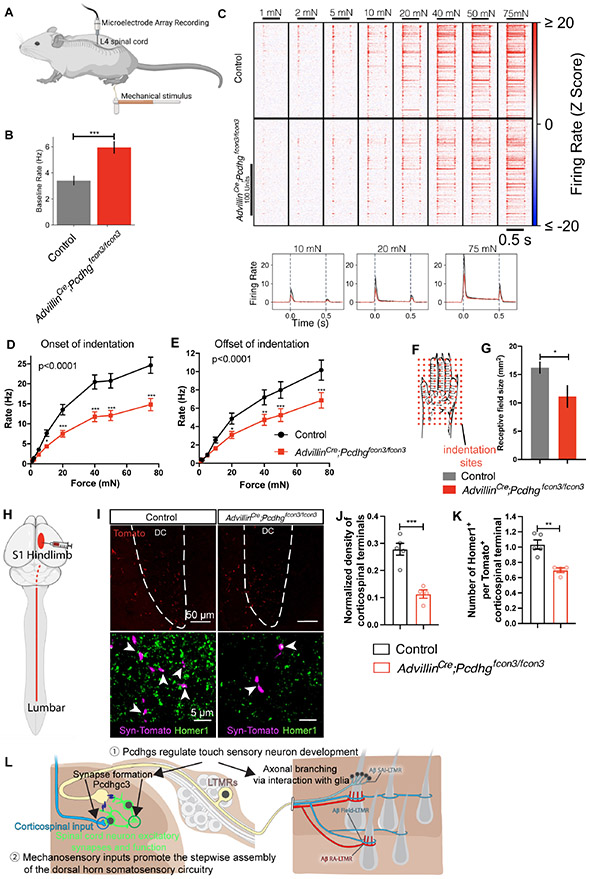
Light touch sensation begins with activation of low-threshold mechanoreceptor (LTMR) endings in the skin and propagation of their signals to the spinal cord and brainstem. We found that the clustered protocadherin gamma (Pcdhg) gene locus, which encodes 22 cell-surface homophilic binding proteins, is required in somatosensory neurons for normal behavioral reactivity to a range of tactile stimuli. Developmentally, distinct Pcdhg isoforms mediate LTMR synapse formation through neuron-neuron interactions and peripheral axonal branching through neuron-glia interactions. The Pcdhgc3 isoform mediates homophilic interactions between sensory axons and spinal cord neurons to promote synapse formation in vivo and is sufficient to induce postsynaptic specializations in vitro. Moreover, loss of Pcdhgs and somatosensory synaptic inputs to the dorsal horn leads to fewer corticospinal synapses on dorsal horn neurons. These findings reveal essential roles for Pcdhg isoform diversity in somatosensory neuron synapse formation, peripheral axonal branching, and stepwise assembly of central mechanosensory circuitry.

Keywords: axon; axonal branching; circuit wiring; somatosensory neurons; spinal cord; synapse; γ-protocadherins.


Conflict of interest statement

Declaration of interests D.D.G. is a member of the Neuron Advisory Board.

Figures

Figure 1.
Figure 1.. Pcdhgs are expressed during postnatal development when somatosensory axons actively form synapses in the dorsal horn
(A) IHC images of spinal cord dorsal horn lamina III from P0, P10 and P21 mice. Arrowheads point to some of the synapses made between sensory neuron terminals and spinal cord neurons. Scale bars represent 3 μm. (B) Quantifications of the sizes of sensory terminals labeled by synaptophysin-tdTomato at P0, P3, P10 and P21. RetCreER;Ai34: n = 2 animals for each time point. TrkBCreER;Ai34: n = 4 animals for P0, 2 animals for P3, 3 animals for P10, and 3 animals for P21. AdvillinCre;Ai34: n = 3 animals for P0, 2 animals for P3, 2 animals for P10, and 4 animals for P21. Two-way ANOVA. (C) Quantifications of the average numbers of Homer1+ puncta per sensory terminal labeled by synaptophysin-tdTomato at P0, P3, P10 and P21. Two-way ANOVA. (D) Summary of the synapse formation surrounding sensory terminals in the LTMR recipient zone during postnatal development. (E) Schematic of the RNA sequencing workflow. (F) Genetic labeling strategies for each of DRG neuron groups. (G) Heatmaps depicting expression patterns for differentially expressed genes encoding cell adhesion molecules or axon guidance proteins. Each column is one biological replicate, and each row shows the expression level for one gene. Prop., proprioceptors. (H) Heatmap depicting expression patterns of Pcdhg genes in the DRGs at P3. (I and J) RNAscope images (I) and quantification (J) for Pcdhga2, Pcdhga7, Pcdhgb1, Pcdhgc3, and Pcdhgc4 expression levels (n = 3 animals). SLC17A6(vGluT2) labels the excitatory neurons in the dorsal spinal cord. DAPI staining in blue labels cell nuclei. Student’s unpaired t test. ns, not significant; *p < 0.05; **p < 0.01; ***p < 0.001.
Figure 2.
Figure 2.. Pcdhgs function in primary sensory neurons for normal tactile behaviors and sensorimotor integration
(A) IHC images of DRG and spinal cord showing the GFP fused Pcdhg proteins in wildtype (negative control), Pcdhgfcon3/fcon3 (positive control) and AdvillinCre;Pcdhgfcon3/fcon3 mice. IB4 labels lamina IIi nonpeptidergic nociceptors in the DRG. (B) Diagram for the tactile PPI behavior assay. (C) Percentage of inhibition of startle response to 125 dB noise when the startle noise is preceded by a light air puff of 0.9 PSI (500 ms ISI). Student’s unpaired t test. (D) Quantification of the average movement of the back in response to 1.0 PSI air puff applied to the back hairy skin of P5 control and AdvillinCre;Pcdhgfcon3/fcon3 pups. Student’s unpaired t test. (E and F) Von Frey thresholds (E) and response rates (F) for littermate control and AdvillinCre;Pcdhgfcon3/fcon3 mice. Two-way ANOVA. Fisher's LSD post hoc test. (G) Diagram for the rough floor aversion assay. (H) Percentages of time spent on rough side for littermate control and AdvillinCre;Pcdhgfcon3/fcon3 mice. Student’s unpaired t test. (I) Distance traveled in an open field test. Student’s unpaired t test. (J) Example images of the balance beam test. (K and L) Total time it took for each animal to cross the beam (K) and average number of slips per trial (L) for littermate control and AdvillinCre;Pcdhgfcon3/fcon3 mice. Student’s unpaired t test. Each dot represents an animal. ns, not significant; *p < 0.05; **p < 0.01; ***p < 0.001.
Figure 3.
Figure 3.. Pcdhgs function in primary sensory neurons for postsynaptic specialization of synapses between sensory axon terminals and spinal cord neurons.
(A and B) IHC images of spinal cord dorsal horn lamina III from P4 (A) and P21 (B) littermate control and AdvillinCre;Pcdhgfcon3/fcon3 mice. (C and D) Normalized densities of vGluT1+ (C) and Homer1+ (D) puncta from littermate control and AdvillinCre;Pcdhgfcon3/fcon3 mice. Student’s unpaired t test. (E) Representative spontaneous mEPSC traces recorded in random spinal cord neurons in lamina III from P13-P16 littermate control (n = 3 animals) and AdvillinCre;Pcdhgfcon3/fcon3 mice (n = 4 animals). (F) Presynaptic Pcdhg deletion decreases the frequency of spontaneous mEPSCs in the spinal cord neurons. Each dot is the mEPSC frequency of a spinal cord neuron. Mann-Whitney test. (G) IHC images of spinal cord lamina III from P21 littermate control and AdvillinCre;Pcdhgfcon3/fcon3;Ai34 mice. (H-K) Normalized densities of synaptophysin-tdTomato (Ai34) puncta density (H) and vGluT1+ Tomato+ double positive puncta (I). The size and normalized density of Homer1+ puncta around Tomato+ sensory terminals is quantified in (K) and (J), respectively. Each dot represents one animal. Student’s unpaired t test. (L) EM images of synaptic glomeruli from lamina III in spinal cord dorsal horn from a control animal and a AdvillinCre;Pcdhgfcon3/fcon3 animal. Arrowheads point to the postsynaptic sites formed within the glomeruli. Scale bars represent 500 nm. (M and N) Quantifications of PSD thickness (M, control 42.1 ± 0.6 nm, 304 synapses from 3 animals; AdvillinCre;Pcdhgfcon3/fcon3: 32.4 ± 0.6 nm, 286 synapses from 3 animals). Quantifications of PSD length (N, control 340.0 ± 7.1 nm; AdvillinCre;Pcdhgfcon3/fcon3: 299.3 ± 6.2 nm). Kolmogorov-Smirnov test. (O) Summary of the synaptic formation phenotype in the AdvillinCre;Pcdhgfcon3/fcon3 mutants. ns, not significant; *p < 0.05; **p < 0.01; ***p < 0.001.
Figure 4.
Figure 4.. Pcdhgs function in LTMRs for axonal branching in the skin.
(A) Whole-mount immunostainings of adult back hairy skin sections from control and mutants. Aβ field-LTMRs form circumferential endings around hair follicles and are NFH+ (noted by white arrowheads). Guard hair follicles are noted as “G”. TSCs are labeled using S100 immunostaining (green). Hair follicles without any NFH+ Aβ field-LTMRs are denoted by triangles. (B-D) Quantification of the percentage of guard and non-guard hair follicles innervated by NFH+ Aβ field-LTMRs circumferential endings and Aβ RA-LTMRs lanceolate endings for AdvillinCre;Pcdhgfcon3/fcon3 mice (n = 958 hair follicles from 3 controls and n = 1357 hair follicles from 3 AdvillinCre;Pcdhgfcon3/fcon3 mice) and DhhCre;Pcdhgfcon3/fcon3 mice (n = 597 hair follicles from 3 controls and n = 863 hair follicles from 4 DhhCre;Pcdhgfcon3/fcon3 mice). Student’s unpaired t test. Each dot represents an imaging field. (E) Control and AdvillinCre;Pcdhgfcon3/fcon3 mice were injected with AAV-Retro-Flex-PLAP virus to retrogradely label DRG neurons that project to the DCN. (F) Example whole-mount AP images of the back hairy skin. Reconstructed axons are shown in the right panels (black). Aβ field-LTMR and Aβ RA-LTMR endings associated with hair follicles are marked in the reconstructions using red and blue circles, respectively. (G and H) Quantification of the number of innervated non-guard hair follicles (G) and the area of innervation (H) by Aβ field-LTMRs (n = 12 neurons from 6 control animals and n = 13 neurons from 5 AdvillinCre;Pcdhgfcon3/fcon3 mice) and Aβ RA-LTMRs (n = 28 neurons from 6 control animals and n = 27 neurons from 6 AdvillinCre;Pcdhgfcon3/fcon3 mice). Student’s unpaired t test. Dots represent individual neurons. (I and J) Example whole-mount immunostaining images of the Merkel cell complex. TSCs wrapping around major Aβ SAI-LTMRs branches are labeled with S100 (green), and Merkel cells are labeled with Troma-I (blue). Quantifications of the major S100+ branches from AdvillinCre;Pcdhgfcon3/fcon3 mice (n = 3 controls and n = 4 mutants) and DhhCre;Pcdhgfcon3/fcon3 mice (n = 3 control animals and n = 4 mutants) are shown in (J). Each dot represents a touch dome. Student’s unpaired t test. (K and L) Example immunostaining images of the forepaw glabrous skin. Meissner corpuscles are labeled by S100 (green, for visualizing lamellar cells) and NFH (magenta, for visualizing Aβ RA-LTMRs). Quantifications of the number of Meissner corpuscles normalized by the area of epidermis from AdvillinCre;Pcdhgfcon3/fcon3 (n = 4 animals per genotype) and DhhCre;Pcdhgfcon3/fcon3 mice (n = 3 controls and n = 4 mutant animals) are shown in (L). Dots represent individual skin sections. Student’s unpaired t test. ns, not significant; *p < 0.05; **p < 0.01; ***p < 0.001.
Figure 5.
Figure 5.. Differential requirements of Pcdhg isoforms for synapse formation and peripheral axonal branching.
(A) Summary of the Pcdhg mutants used. Red lines indicate the corresponding genes are disrupted, while the genes listed are not disrupted. (B) IHC images of spinal cord dorsal horn lamina III from P21 control and Pcdhg mutants. (C-E) Normalized densities of vGluT1+ (C) and Homer1+ (D) puncta from P21 control and various Pcdhg mutants. (E) shows the normalized densities of Homer1+ puncta that surrounds vGluT1+ puncta. One-way ANOVA with Tukey’s post hoc test. Each dot represents average value of an animal. (F) Whole-mount immunostaining of adult back hairy skin sections from control and various Pcdhg mutants. Aβ field-LTMRs innervations are noted by white arrowheads. Hair follicles without any NFH+ Aβ field-LTMRs are denoted by empty arrowheads. Scale bar represents 50 μm. (G and H) Quantification of the percentage of non-guard hair follicles innervated by NFH+ Aβ field-LTMRs circumferential endings (G) and Aβ RA-LTMRs lanceolate endings (H). n = 649 hair follicles from 5 wildtype animals; n = 336 hair follicles from 2 PcdhgTAKO animals; n = 710 hair follicles from 4 Pcdhg3R1 animals; n = 673 hair follicles from 5 Pcdhg3R2 animals; n = 614 hair follicles from 3 PcdhgC3KO animals. One-way ANOVA with Tukey’s post hoc test. ns, not significant; *p < 0.05; **p < 0.01; ***p < 0.001.
Figure 6.
Figure 6.. Pcdhgc3 is the only isoform that mediates sensory neuron synapse formation in vivo and can promote postsynaptic specialization in vitro
(A) Experiment design for expressing single Pcdhg isoforms (Pcdhga1 or Pcdhgc3) in AdvillinCre;Pcdhgfcon3/fcon3 mice. (B) IHC images of spinal cord dorsal horn lamina III from AdvillinCre;Pcdhgfcon3/fcon3;cA1 and AdvillinCre;Pcdhgfcon3/fcon3;cC3 mice. (C and D) Normalized densities of vGluT1+ (C) and Homer1+ (D) puncta. Each dot on the plot indicates a normalized value for an animal. One-way ANOVA test. (E) Experiment design for deleting both copies of the Pcdhgc3 isoforms only in the dorsal horn neurons in the Lbx1Cre;PcdhgC3KO/fcon3 mice. (F) IHC images of spinal cord dorsal lamina III from control and Lbx1Cre;PcdhgC3KO/fcon3 mice. (G-J) Quantifications of the synapses in lamina III, showing that deleting Pcdhgc3 in the dorsal horn neurons led to reduced densities of vGluT1+ (G), Homer1+ (H) puncta, as well as the density of Homer1+ puncta surrounding vGluT1+ terminals (I). Similarly, the average size of Homer1+ puncta is reduced in Lbx1Cre;PcdhgC3KO/fcon3 mice (J). Each dot on the plot indicates a normalized value for an animal. Student’s unpaired t test. (K) IHC showing the localizations of Pcdhgc3-mCherry in the spinal cord lamina III of P5 and P45 AdvillinCre;cC3 mice and P22 Lbx1Cre;cC3 mice (n = 3 animals for each genotype). (L) Representative images of artificial synapse formation assays in which Nrxn1β, Pcdhgc3, or Pcdhgc3ΔEcto is expressed in HEK293T cells that are cocultured with neonatal spinal cord neurons. (M) Representative images of in vitro synapse formation assays. Note the MAP2+ neuronal cell body in the upper right corner of the panel on the right (Pcdhga7 condition). (N and O) Average number (N) and intensity (O) of PSD-95 puncta per HEK 293 cell for each condition. Data are means ± SEM from three independent replicates. One-way ANOVA with Tukey’s post hoc test. ns, not significant; *p < 0.05; **p < 0.01; ***p < 0.001.
Figure 7.
Figure 7.. Aberrant physiological responses and corticospinal synaptic inputs in the dorsal horn of AdvillinCre; Pcdhgfcon3/fcon3 mice due to reduced functional mechanosensory synapses.
(A) MEA recordings from lumbar spinal cord dorsal horn in mice, while the glabrous skin from right hind paw is indented with a series of forces. (B) Quantifications of the baseline firing rates in littermate control and AdvillinCre;Pcdhgfcon3/fcon3 mice. n = 3 animals per genotype. Student’s unpaired t test. (C) Summary of representative units responding to indentation of the skin with different forces. The amount of force is labeled on the top. The indentations applied are indicated by the black bars below the force labels. Average firing rates in response to the indentation are shown on the bottom row. n = 187 neurons for 5 controls and n = 207 neurons for 5 mutants. (D and E) Quantifications of the onset (D) and offset (E) responses in littermate control and AdvillinCre;Pcdhgfcon3/fcon3 mice. Two-way ANOVA. (F) Diagram for mapping the functional receptive fields of the dorsal horn neurons. (G) Quantifications of the receptive field sizes in littermate control and AdvillinCre;Pcdhgfcon3/fcon3 mice. (H) Diagram showing viral labeling of corticospinal projections in the lumbar spinal cord. (I) IHC images showing corticospinal terminals labeled with synaptophysin-tdTomato in the dorsal column, and lamina III in control and AdvillinCre;Pcdhgfcon3/fcon3 mice. White dotted line outlines the shape of the dorsal column with labeling. (J) Quantification showing the density of Tomato+ corticospinal terminals in lamina III is reduced in the AdvillinCre;Pcdhgfcon3/fcon3 mice (number of puncta per 104 μm2). Each dot represents average number for an animal. Student’s unpaired t test. (K) Quantification showing the number of excitatory synapses (Homer1+ puncta) surrounding corticospinal terminals in lamina III is reduced in the AdvillinCre;Pcdhgfcon3/fcon3 mice. Student’s unpaired t test. (L) A schematic summarizing (1) the essential roles of Pcdhg isoform diversity in somatosensory neuron synapse formation (left), peripheral axonal branching (right), and (2) step-wise assembly of central mechanosensory circuitry. *p < 0.05; **p < 0.01; ***p < 0.001.

References

    1. Hertenstein MJ, Verkamp JM, Kerestes AM, and Holmes RM (2006). The communicative functions of touch in humans, nonhuman primates, and rats: a review and synthesis of the empirical research. Genetic, social, and general psychology monographs 132, 5–94. 10.3200/mono.132.1.5-94. - DOI - PubMed
    1. Main M, and Stadtman J (1981). Infant response to rejection of physical contact by the mother: aggression, avoidance, and conflict. Journal of the American Academy of Child Psychiatry 20, 292–307. 10.1016/s0002-7138(09)60990-0. - DOI - PubMed
    1. Orefice LL (2020). Peripheral Somatosensory Neuron Dysfunction: Emerging Roles in Autism Spectrum Disorders. Neuroscience 445, 120–129. 10.1016/j.neuroscience.2020.01.039. - DOI - PMC - PubMed
    1. Handler A, and Ginty DD (2021). The mechanosensory neurons of touch and their mechanisms of activation. Nat Rev Neurosci 22, 521–537. 10.1038/s41583-021-00489-x. - DOI - PMC - PubMed
    1. Abraira VE, and Ginty DD (2013). The Sensory Neurons of Touch. Neuron 79, 618–639. 10.1016/j.neuron.2013.07.051. - DOI - PMC - PubMed

Publication types

LinkOut - more resources