

Ultraprocessed Foods and Kidney Disease Progression, Mortality, and Cardiovascular Disease Risk in the CRIC Study
- PMID: 37028638
- PMCID: PMC10524102
- DOI: 10.1053/j.ajkd.2023.01.452
Ultraprocessed Foods and Kidney Disease Progression, Mortality, and Cardiovascular Disease Risk in the CRIC Study
Abstract
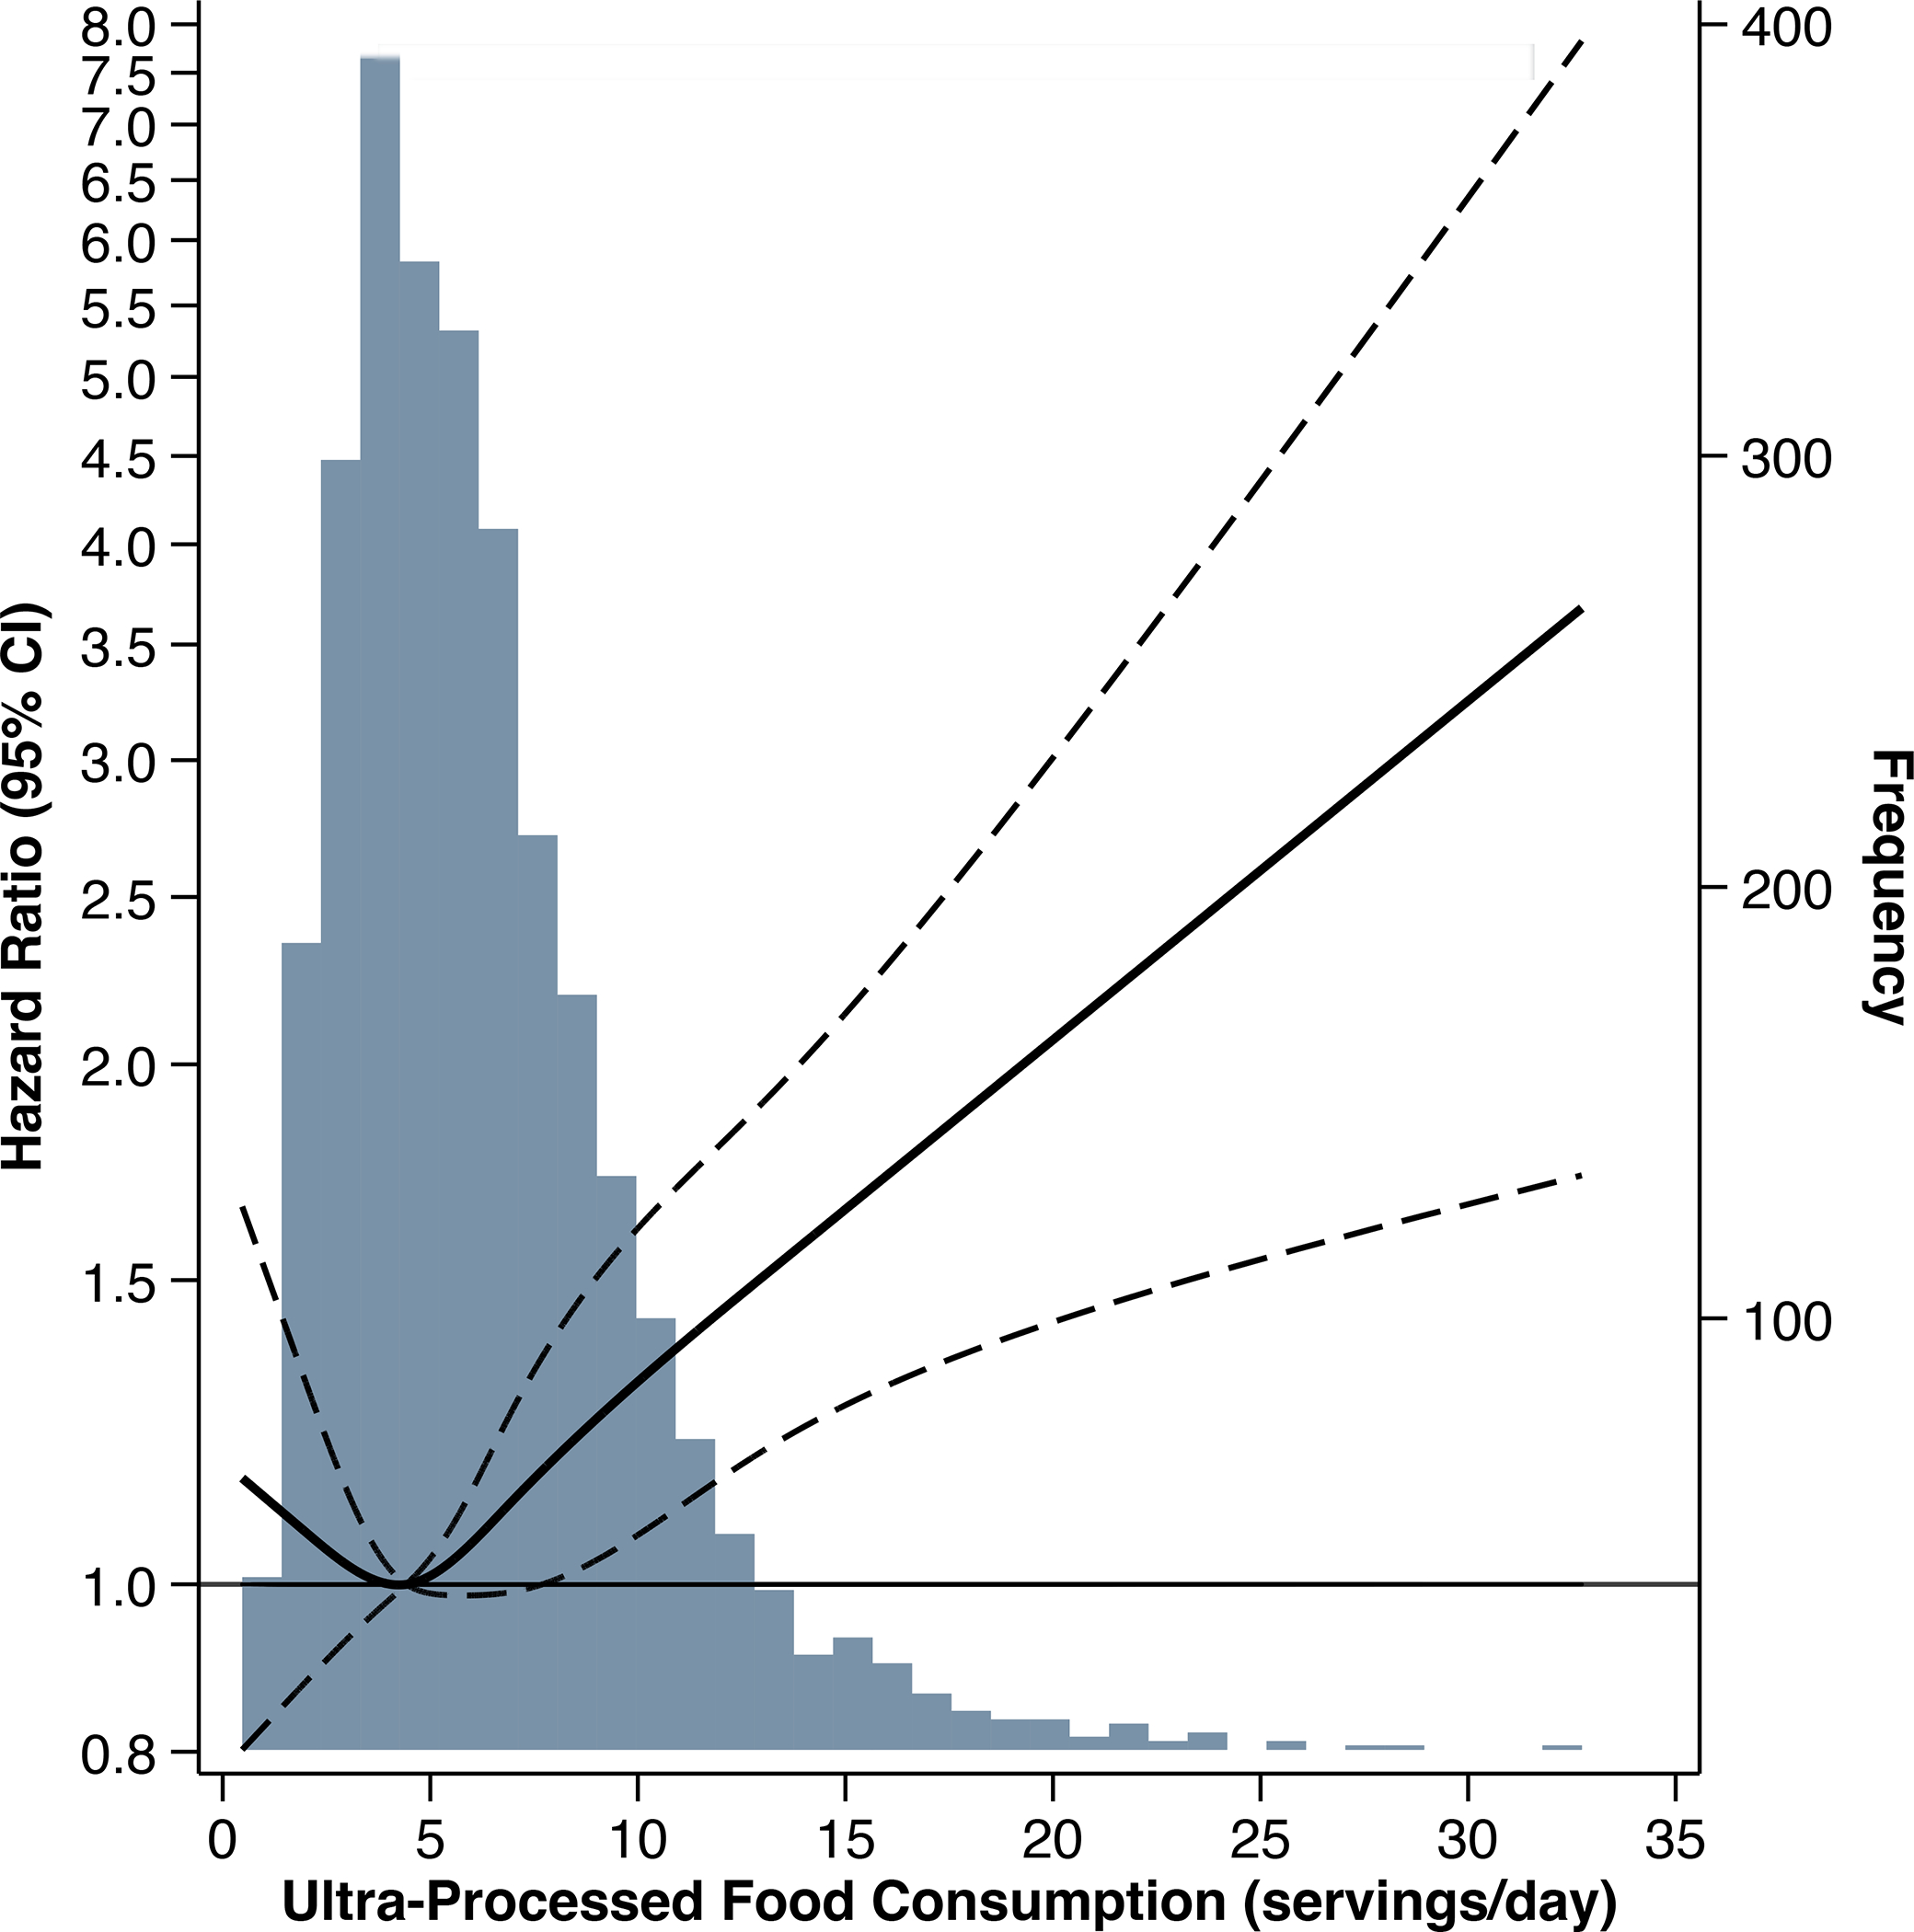
Rationale & objective: Ultraprocessed foods are widely consumed in the United States and are associated with cardiovascular disease (CVD), mortality, and kidney function decline in the general population. We investigated associations between ultraprocessed food intake and chronic kidney disease (CKD) progression, all-cause mortality, and incident CVD in adults with chronic kidney disease (CKD).
Study design: Prospective cohort study.
Setting & participants: Chronic Renal Insufficiency Cohort Study participants who completed baseline dietary questionnaires.
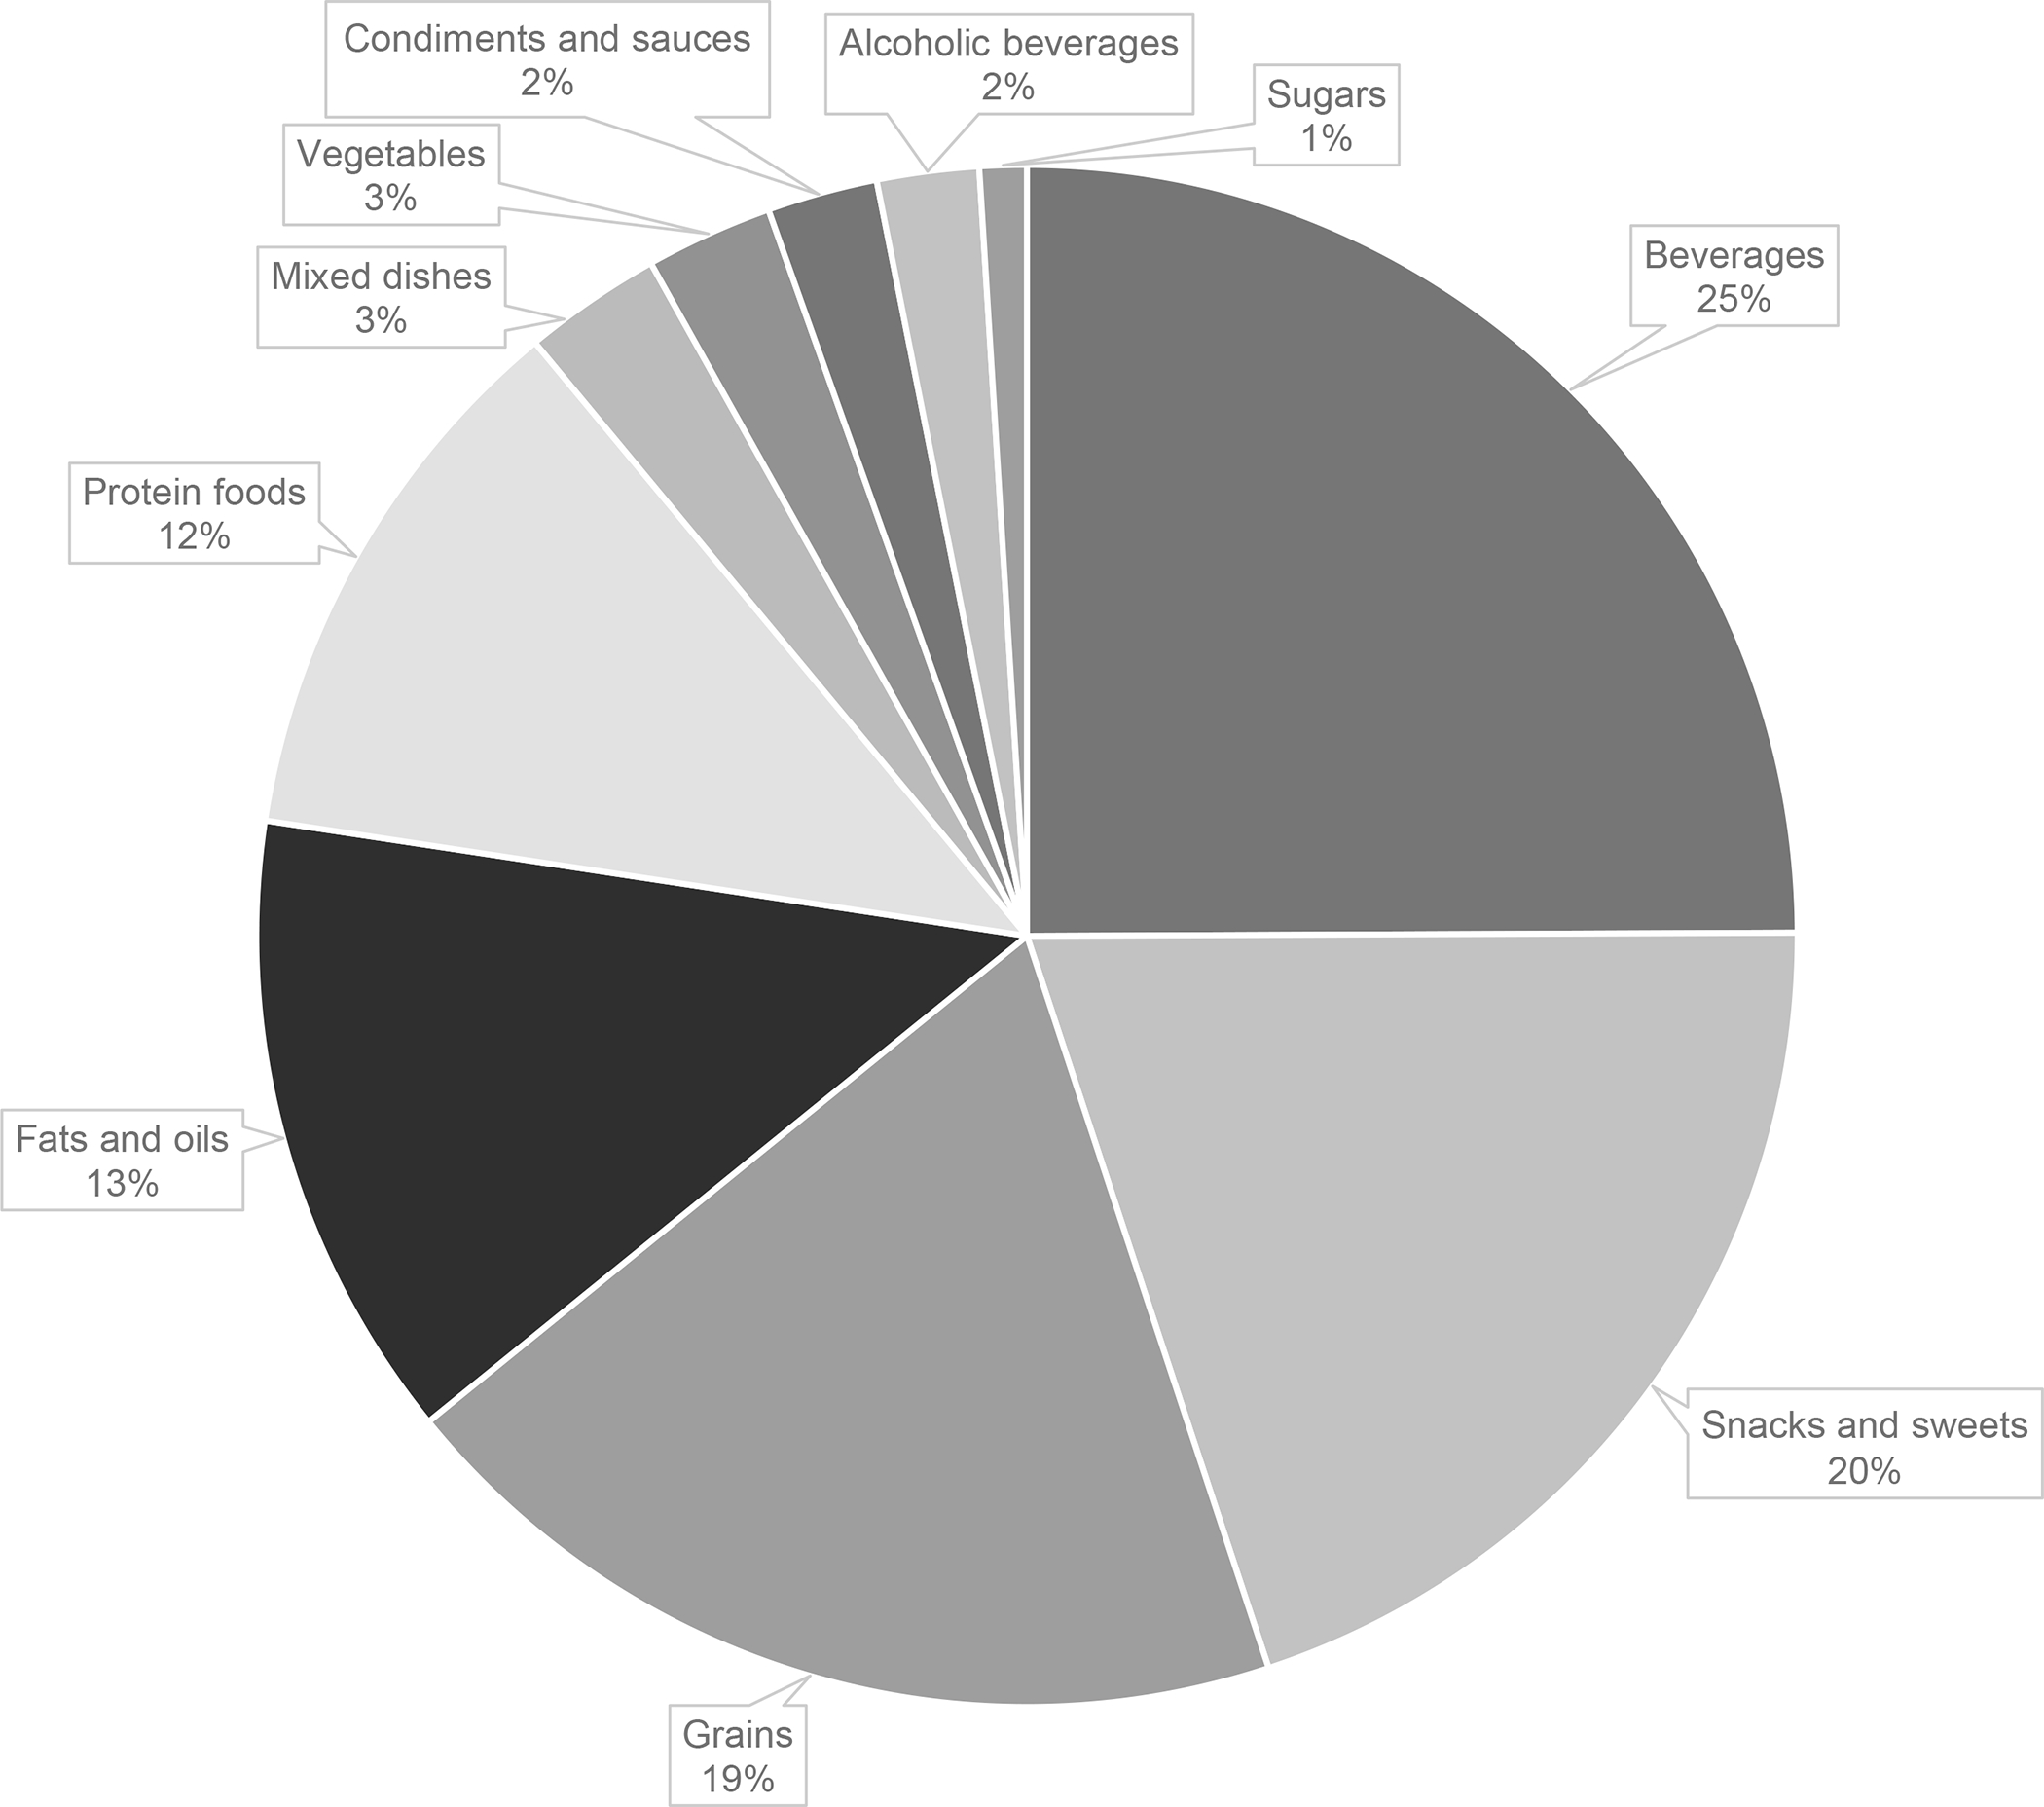
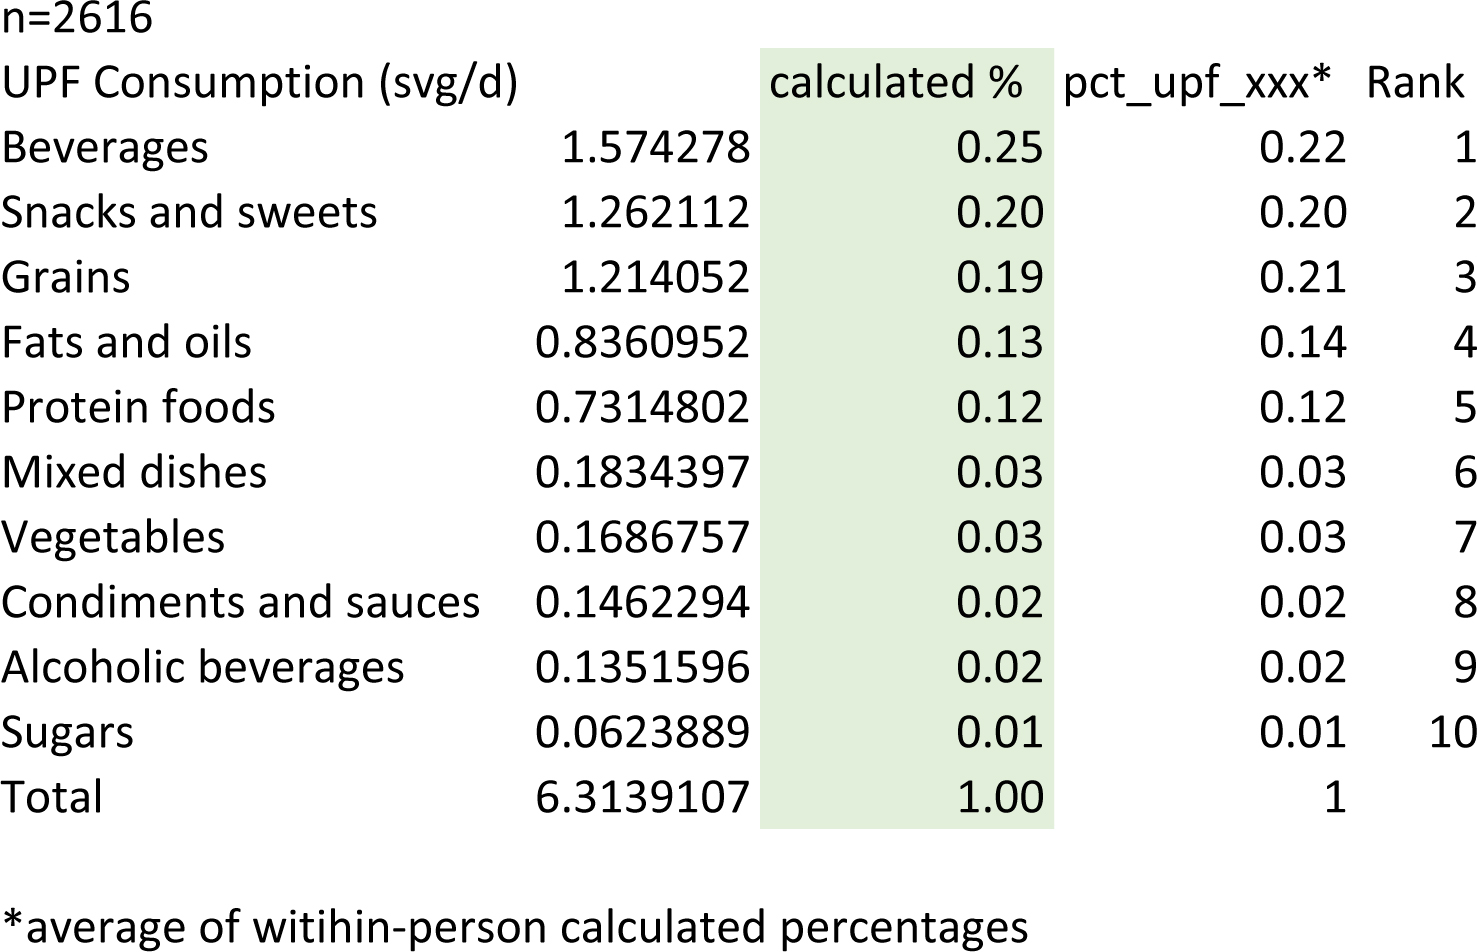
Exposure: Ultraprocessed food intake (in servings per day) classified according to the NOVA system.
Outcomes: CKD progression (≥50% decrease in estimated glomerular filtration rate [eGFR] or initiation of kidney replacement therapy), all-cause mortality, and incident CVD (myocardial infarction, congestive heart failure, or stroke).
Analytical approach: Cox proportional hazards models adjusted for demographic, lifestyle, and health covariates.
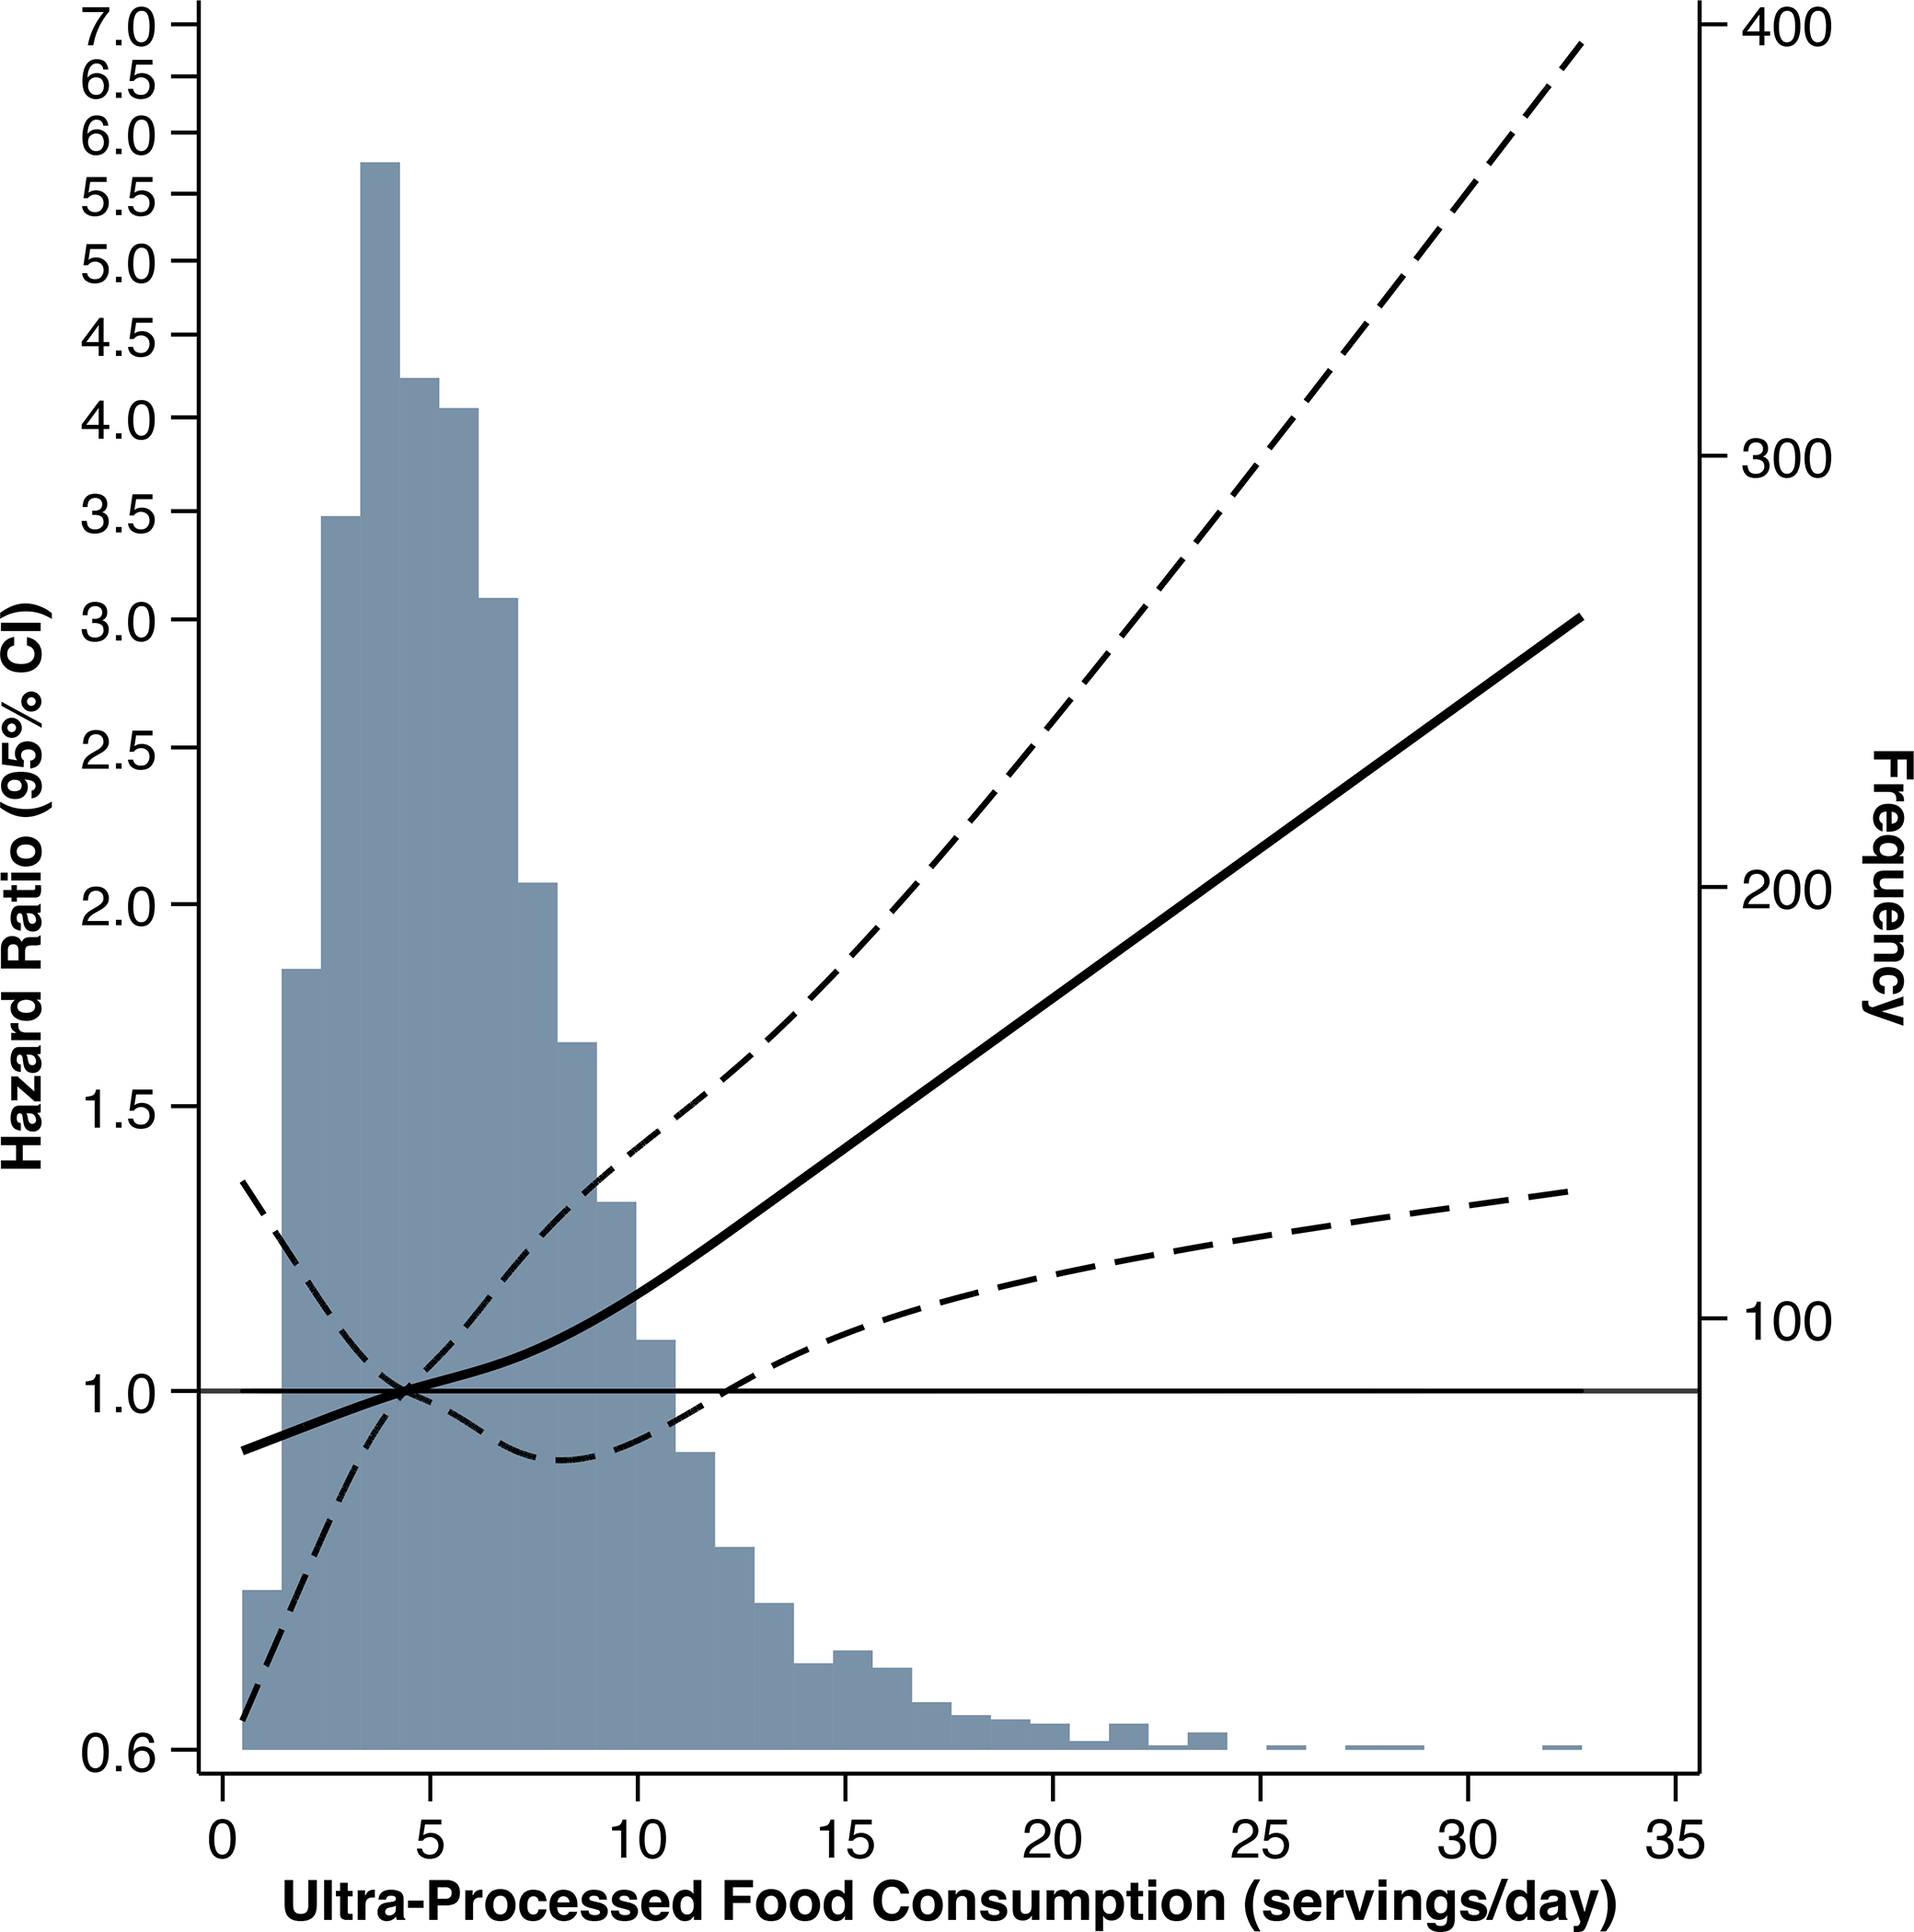
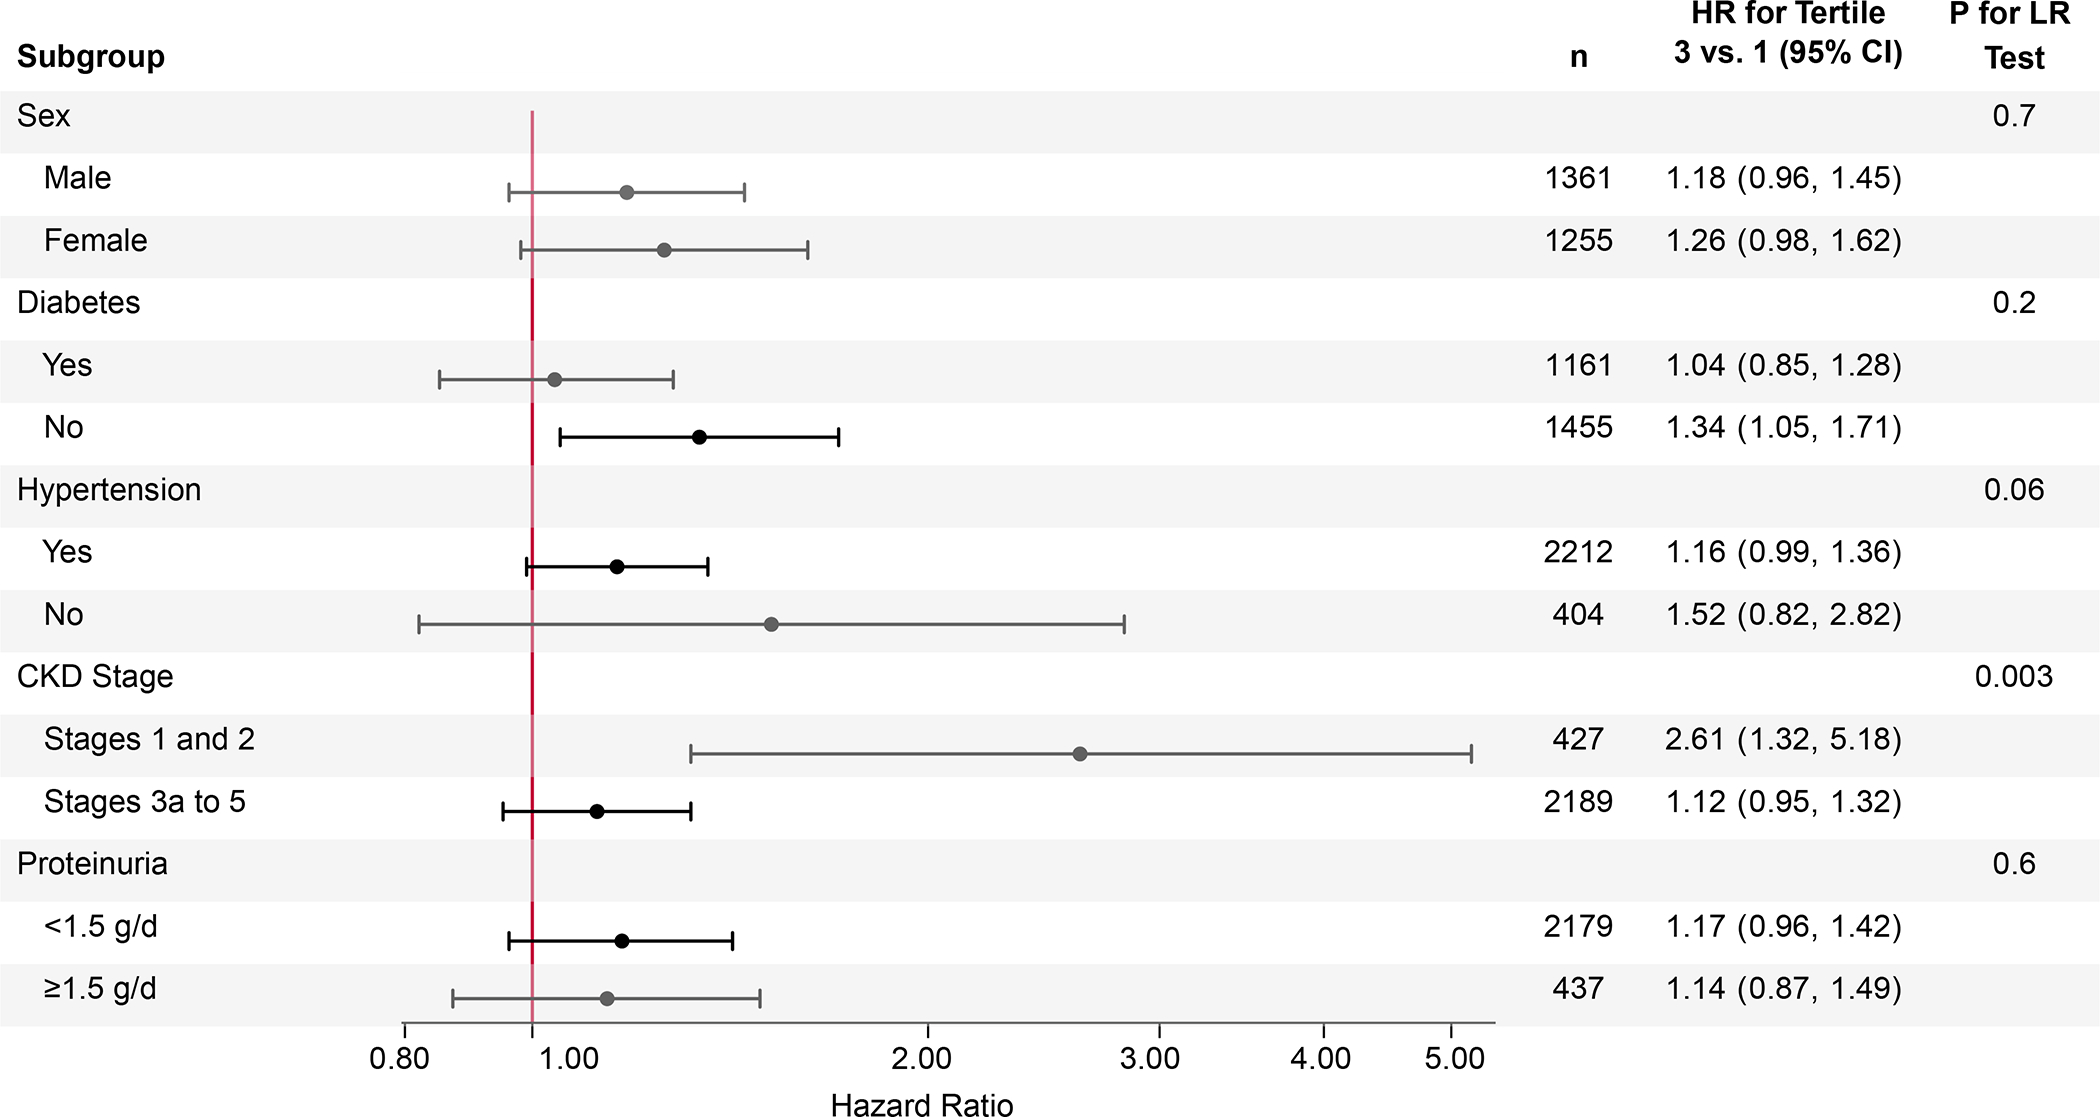
Results: There were 1,047 CKD progression events observed during a median follow-up of 7 years. Greater ultraprocessed food intake was associated with higher risk of CKD progression (tertile 3 vs tertile 1, HR, 1.22; 95% CI, 1.04-1.42; P=0.01 for trend). The association differed by baseline kidney function, such that greater intake was associated with higher risk among people with CKD stages 1/2 (eGFR≥60mL/min/1.73m2; tertile 3 vs tertile 1, HR, 2.61; 95% CI, 1.32-5.18) but not stages 3a-5 (eGFR<60mL/min/1.73m2; P=0.003 for interaction). There were 1,104 deaths observed during a median follow-up of 14 years. Greater ultraprocessed food intake was associated with higher risk of mortality (tertile 3 vs tertile 1, HR, 1.21; 95% CI, 1.04-1.40; P=0.004 for trend).
Limitations: Self-reported diet.
Conclusions: Greater ultraprocessed food intake may be associated with CKD progression in earlier stages of CKD and is associated with higher risk of all-cause mortality in adults with CKD.
Plain language summary: Ultraprocessed foods are industrial formulations produced using ingredients and processes that are not commonly used in culinary preparations and contain few, if any, intact unprocessed foods. Ultraprocessed foods are widely consumed in the United States, and high intakes of such foods have been linked to cardiovascular disease, kidney disease, and mortality in the general population. In this study, we found that greater intake of ultraprocessed foods was associated with higher risk of kidney disease progression and mortality in adults with chronic kidney disease. Our findings suggest that patients with kidney disease may benefit from greater consumption of fresh, whole, and homemade or hand-prepared foods and fewer highly processed foods.
Keywords: CRIC Study; NOVA; dietary intake; epidemiology; kidney disease; nutrition; ultraprocessed foods.
Copyright © 2023 National Kidney Foundation, Inc. Published by Elsevier Inc. All rights reserved.
Figures
References
-
- Baraldi LG, Martinez Steele E, Canella DS, Monteiro CA. Consumption of ultra-processed foods and associated sociodemographic factors in the USA between 2007 and 2012: evidence from a nationally representative cross-sectional study. BMJ Open. 2018;8(3). doi: 10.1136/BMJOPEN-2017-020574 - DOI - PMC - PubMed
Publication types
MeSH terms
Grants and funding
- U01 DK060963/DK/NIDDK NIH HHS/United States
- T32 HL007024/HL/NHLBI NIH HHS/United States
- UL1 RR024131/RR/NCRR NIH HHS/United States
- U01 DK061022/DK/NIDDK NIH HHS/United States
- R01 DK119199/DK/NIDDK NIH HHS/United States
- UL1 TR000003/TR/NCATS NIH HHS/United States
- UL1 RR029879/RR/NCRR NIH HHS/United States
- U01 DK061028/DK/NIDDK NIH HHS/United States
- UL1 TR000433/TR/NCATS NIH HHS/United States
- UL1 TR002548/TR/NCATS NIH HHS/United States
- R03 DK128386/DK/NIDDK NIH HHS/United States
- U01 DK060984/DK/NIDDK NIH HHS/United States
- U01 DK061021/DK/NIDDK NIH HHS/United States
- U24 DK060990/DK/NIDDK NIH HHS/United States
- U01 DK060980/DK/NIDDK NIH HHS/United States
- UL1 TR000439/TR/NCATS NIH HHS/United States
- R01 HL153178/HL/NHLBI NIH HHS/United States
- UL1 TR000424/TR/NCATS NIH HHS/United States
- R01 HL141846/HL/NHLBI NIH HHS/United States
- M01 RR016500/RR/NCRR NIH HHS/United States
- P20 GM109036/GM/NIGMS NIH HHS/United States
- U01 DK060902/DK/NIDDK NIH HHS/United States
- U01 DK060990/DK/NIDDK NIH HHS/United States
- UM1 TR004528/TR/NCATS NIH HHS/United States
LinkOut - more resources
Full Text Sources
Medical
Research Materials
Miscellaneous
