. 2023 May;299(5):104677.
doi: 10.1016/j.jbc.2023.104677. Epub 2023 Apr 5.

VIRMA promotes nasopharyngeal carcinoma, tumorigenesis, and metastasis by upregulation of E2F7 in an m6A-dependent manner

Affiliations

VIRMA promotes nasopharyngeal carcinoma, tumorigenesis, and metastasis by upregulation of E2F7 in an m6A-dependent manner

Zi-Qi Zheng et al. J Biol Chem. 2023 May.

Abstract

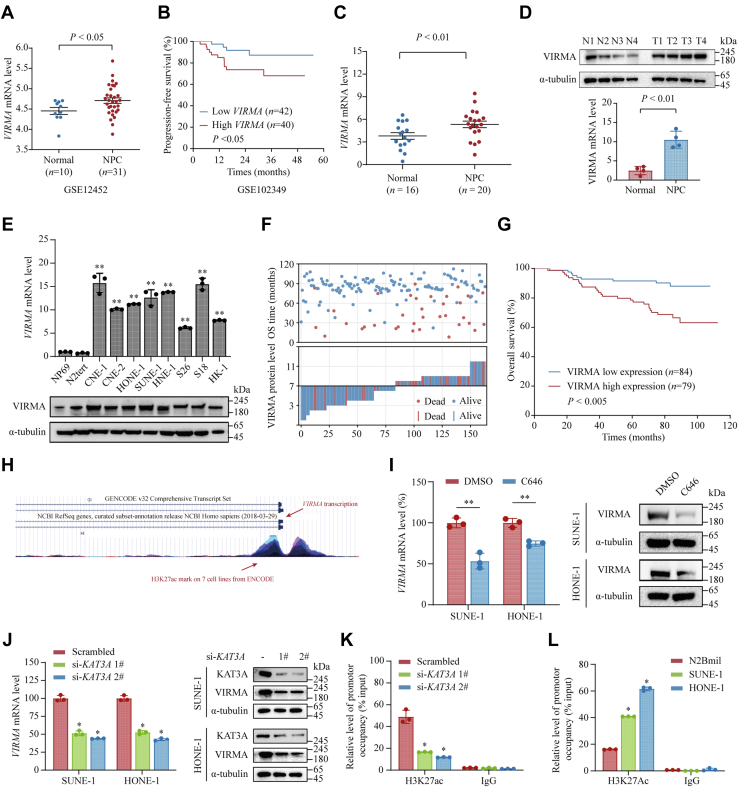
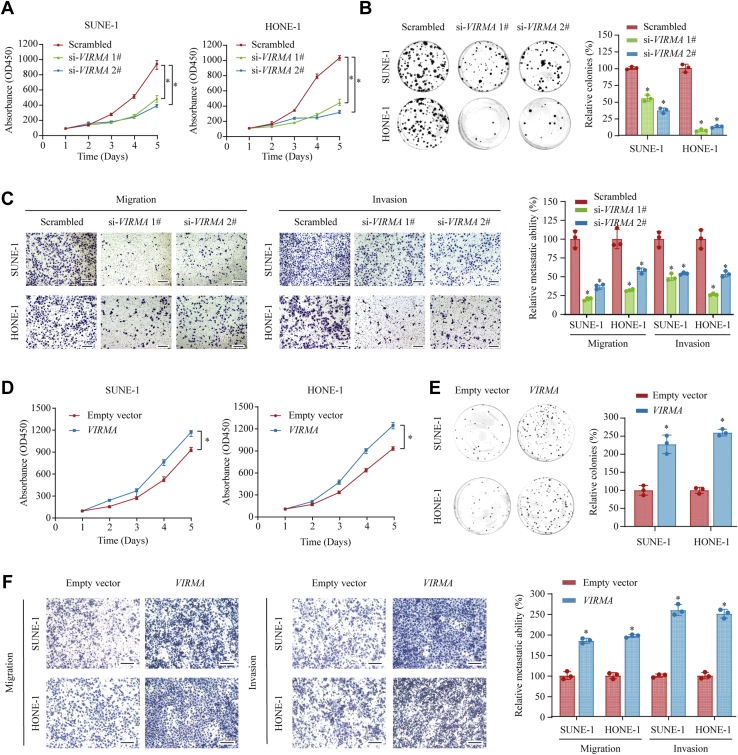
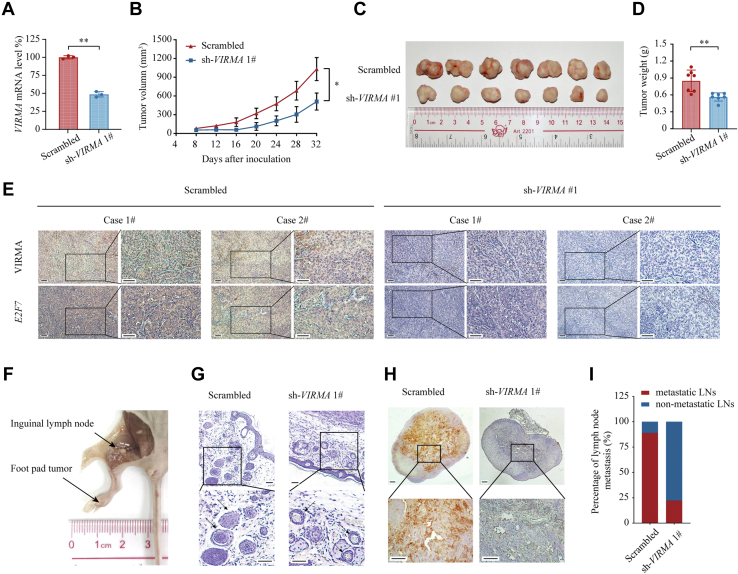
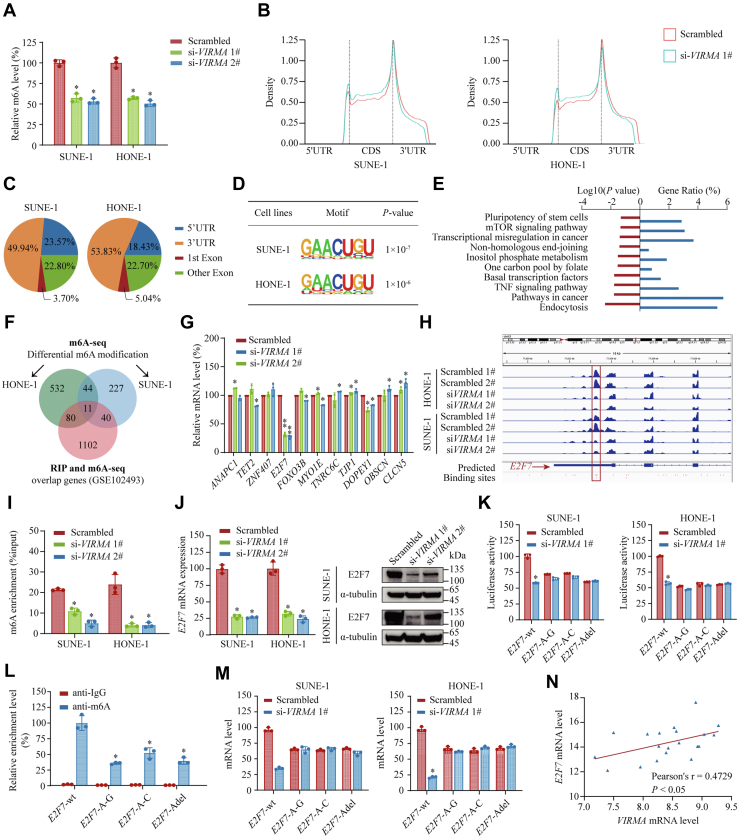
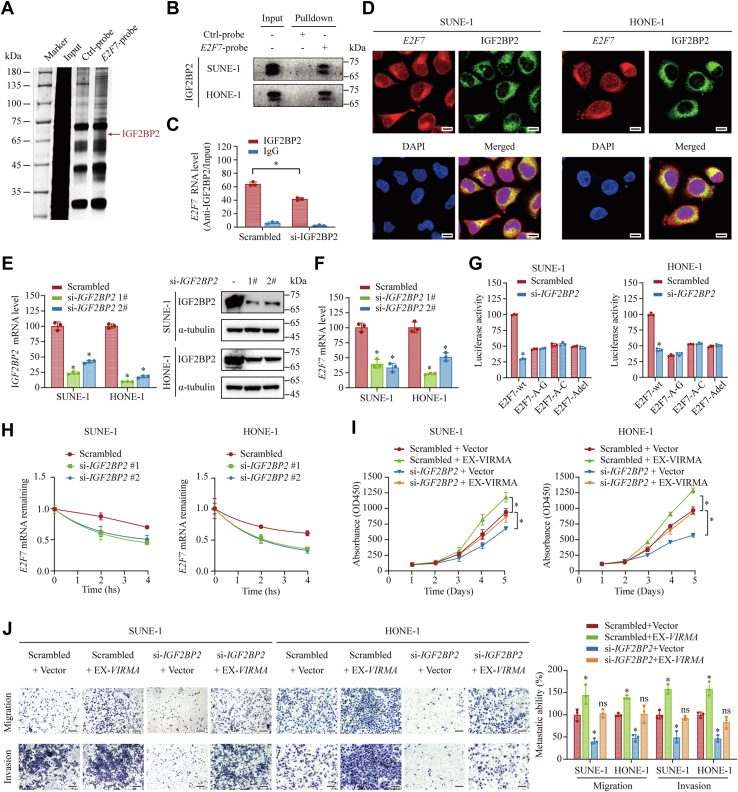
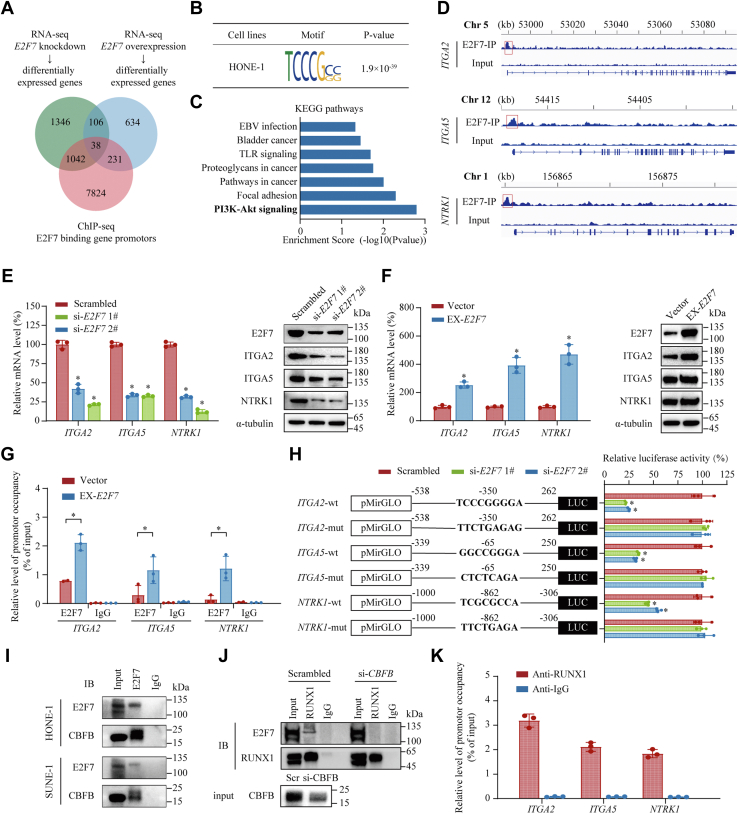
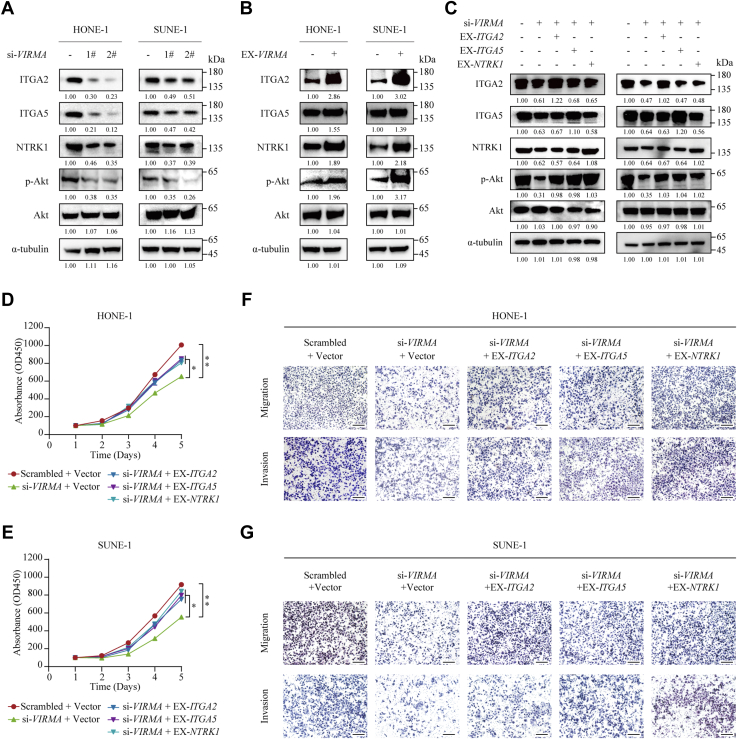
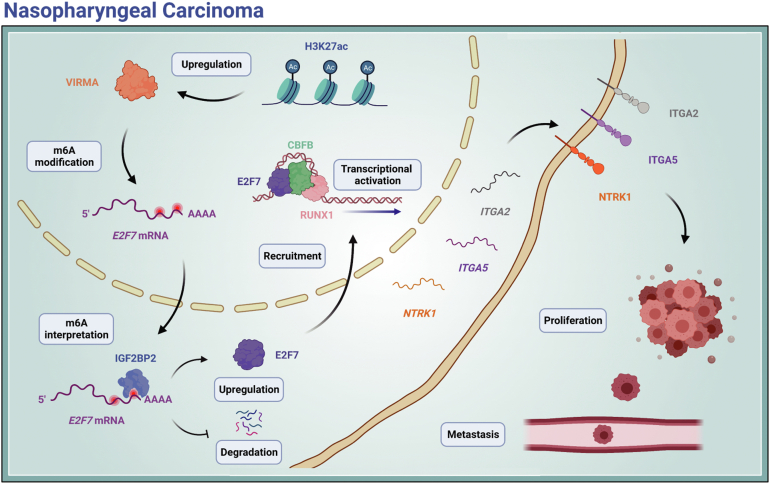
The N6-methyladenosine (m6A) modification possesses new and essential roles in tumor initiation and progression by regulating mRNA biology. However, the role of aberrant m6A regulation in nasopharyngeal carcinoma (NPC) remains unclear. Here, through comprehensive analyses of NPC cohorts from the GEO database and our internal cohort, we identified that VIRMA, an m6A writer, is significantly upregulated in NPC and plays an essential role in tumorigenesis and metastasis of NPC, both in vitro and in vivo. High VIRMA expression served as a prognostic biomarker and was associated with poor outcomes in patients with NPC. Mechanistically, VIRMA mediated the m6A methylation of E2F7 3'-UTR, then IGF2BP2 bound, and maintained the stability of E2F7 mRNA. An integrative high-throughput sequencing approach revealed that E2F7 drives a unique transcriptome distinct from the classical E2F family in NPC, which functioned as an oncogenic transcriptional activator. E2F7 cooperated with CBFB-recruited RUNX1 in a non-canonical manner to transactivate ITGA2, ITGA5, and NTRK1, strengthening Akt signaling-induced tumor-promoting effect.

Keywords: E2F7; VIRMA; m6A; metastasis; nasopharyngeal carcinoma.


Conflict of interest statement

Conflict of interest The authors declare that they have no conflicts of interest with the contents of this article.

Figures

Figure 1
Figure 1
Upregulation of VIRMA in NPC tissues and cell lines is controlled by H3K27 acetylation.A, expression levels of VIRMA in NPC tissues and normal nasopharyngeal tissues were compared based on the GEO database GSE12452. B, Kaplan–Meier analysis was applied to compare the survival between patients with NPC with VIRMA low and high expression based on GEO database GSE102349. C and D, RNA (qPCR analysis) (C) and protein (Western blotting analysis) (D) levels of VIRMA in NPC tissues and normal nasopharyngeal tissues were compared. E, RNA (qPCR analysis) and protein (Western blotting analysis) levels of VIRMA in NPC cell lines (CNE-1, CNE-2, HONE-1, SUNE-1, HNE-1, S26, S18, and HK-1) and immortalized nasopharyngeal epithelia (NP69 and N2tert). F, the overall survival time (upper panel) and VIRMA expression (lower panel) of our NPC cohort (n = 163). G, Kaplan–Meier analysis was applied to compare the survival between patients with VIRMA low and high expression in our NPC cohort. H, H3K27 acetylation of the VIRMA promoter region was analyzed based on UCSC Genome Browser (http://genome.ucsc.edu/). The layered H3K27ac tracks show where modification of histone proteins is suggestive of enhancer. Different colors represent the H3K27ac mark (often found near regulatory elements) on 7 cell lines from ENCODE database (https://www.encodeproject.org). I, relative expression of VIRMA was examined by qPCR (left panel) and Western blotting (right panel) with or without C646 (10 μM) treatment for 48 h in HONE-1 and SUNE-1 cells. J, relative expression of VIRMA was examined by qPCR (left panel) and Western blotting (right panel), with or without KAT3A knockdown in NPC cells. K, ChIP analysis of H3K27ac enrichment in the VIRMA promoter region upon KAT3A knockdown. L, ChIP analysis of H3K27ac enrichment in VIRMA in SUNE-1, HONE-1, and N2Bmil cells. Data are presented as the mean ± SD. ∗p < 0.05, ∗∗p < 0.01. ChIP, chromatin immunoprecipitation; NPC, nasopharyngeal carcinoma; VIRMA, vir-like m6A methyltransferase associated.
Figure 2
Figure 2
VIRMA promotes NPC cell proliferation, migration, and invasion in vitro.A, CCK-8 assays were performed to analyze the proliferation ability of SUNE-1 and HONE-1 cells after silencing of VIRMA. Data are presented as the mean ± range. B, colony formation assays were conducted to analyze the growth ability of SUNE-1 and HONE-1 cells upon VIRMA silencing. C, the migration and invasion capacities of VIRMA-silenced SUNE-1 and HONE-1 cells were analyzed using Transwell assays. Scale bar: 200 μm. D, CCK-8 assays were performed to analyze the proliferation ability of SUNE-1 and HONE-1 cells overexpressing VIRMA. Data are presented as the mean ± range. E, colony formation assays were conducted to analyze the growth ability of SUNE-1 and HONE-1 cells with VIRMA overexpression. F, migration and invasion capacities of VIRMA-overexpressing SUNE-1 and HONE-1 cells were analyzed using Transwell assays. Scale bar: 200 μm. Data are presented as the mean ± SD. ∗p < 0.05. CCK-8, Cell Counting Kit-8; NPC, nasopharyngeal carcinoma; VIRMA, vir-like m6A methyltransferase associated.
Figure 3
Figure 3
Depletion of VIRMA impaired the proliferation and invasion of NPC in vivo.A, SUNE-1 cells were stably transduced with scrambled shRNA or sh-VIRMA 1# lentivirus, and quantitative RT-PCR was used for validation. BE, subcutaneous tumorigenesis model. B, tumor volume of subcutaneous xenografts with or without VIRMA depletion was measured every 4 days during 5 weeks of growth. Subcutaneous xenograft tumors were retrieved from sacrificed mice on day 32 after axilla inoculation (C), and the tumor weight was measured (D). E, subcutaneous xenograft tumors were embedded in paraffin and cut into 5 μm sections, which were stained using IHC (VIRMA, upper row) and ISH (E2F7, lower row). Scale bar: 50 μm. FI, SUNE-1 cells with or without VIRMA silencing were inoculated into the footpad of nude mice to establish the inguinal lymph node metastasis model. F, representative image of primary tumors (footpad) and metastatic inguinal lymph nodes in the inguinal lymph node metastasis model. G, representative images of primary tumor sections stained with hematoxylin and eosin showing tumor cells invasion into lymphatic vessels (arrows). Scale bar: 100 μm. H, representative images of pan-cytokeratin staining in inguinal lymph nodes. Scale bar: 100 μm. I, ratios of inguinal lymph nodes metastasis from primary tumors in the footpad. Data are presented as the mean ± SD. ∗p < 0.05, ∗∗p < 0.01. IHC, immunohistochemistry; ISH, In situ hybridization; NPC, nasopharyngeal carcinoma; VIRMA, vir-like m6A methyltransferase associated.
Figure 4
Figure 4
VIRMA promotes m6A deposition on E2F7 3′ UTR and upregulates E2F7 expression in NPC.A, the effects of VIRMA depletion on total polyadenylated RNA m6A modification levels were quantified using an ELISA-based m6A quantification assays (A). B, the profiles of m6A peak density along with RNA transcripts, with or without VIRMA silencing. C, top consensus motif identified by MeRIP-seq in SUNE-1 and HONE-1 cells. D, pie charts illustrating the proportion of m6A peaks distribution in the 5′ UTR, CDS, and 3′ UTR regions of the mapped transcripts. E, Kyoto Encyclopedia of Genes and Genomes (KEGG) pathway analysis of MeRIP-seq data in HONE-1 cells. F, Venn diagram of differential m6A modifications in SUNE-1 and HONE-1 cells upon VIRMA knockdown and the overlapping genes of VIRMA RIP-seq and m6A-seq in the GEO database (GSE102493). G, relative expression levels of 11 high-confidence VIRMA downstream candidates after VIRMA silencing analyzed by qRT-PCR. H, m6A peaks enriched in the 3′ UTR and around the stop codon of E2F7, with or without VIRMA knockdown in SUNE-1 and HONE-1 cells from the MeRIP-seq data visualized by Integrative Genomics Viewer (IGV) browser tracks. I, relative m6A enrichment in the E2F7 3′ UTR analyzed using MeRIP-qPCR in control and VIRMA-silencing cells. J, relative expression level of E2F7 in VIRMA-deficient SUNE-1 and HONE-1 cells detected by qRT-PCR (left panel) and Western blotting (right panel). K, relative luciferase activity in SUNE-1 and HONE-1 cells transfected with E2F7 3′ UTR wild-type or mutant constructs upon VIRMA knockdown. Data are shown as the relative ratio of Firefly to Renilla luciferase activity. L, relative m6A enrichment of E2F7 3′ UTR fragments in HONE-1 cells transfected with E2F7 3′ UTR wild-type or mutant constructs analyzed by MeRIP-qPCR. M, relative expression levels of E2F7 3′ UTR fragments in SUNE-1 and HONE-1 cells transfected with E2F7 3′ UTR wild-type or mutant constructs, with or without VIRMA knockdown. N, Pearson correlation analysis of VIRMA and E2F7 expression in 20 NPC tissues. Data are presented as the mean ± SD. ∗p < 0.05, ∗∗p < 0.01. Adel mut, mutant with adenine residues deletion; A mut G, mutant with A–G transition mutations; A mut T mut, mutant with A–T transversion mutations; m6A, N6-methyladenosine; NPC, nasopharyngeal carcinoma; VIRMA, vir-like m6A methyltransferase associated; WT, wild-type.
Figure 5
Figure 5
IGF2BP2 maintains E2F7 RNA stability and through an m6A-dependent mechanism.A and B, an RNA pulldown assay was conducted using a biotin-labeled E2F7 probe and a control probe. The subsequently enriched proteins were subjected to silver staining (A) and Western blotting analysis (B). C, relative enrichment level of E2F7 transcripts immunoprecipitated by anti-IGF2BP2 or anti-IgG antibodies. D, intracellular distribution of E2F7 transcripts and IGF2BP2 visualized by FISH accompanied by IF. Red, E2F7 transcripts; Green, IGF2BP2 proteins; Blue, DAPI. Scale bar: 10 μm. E, knockdown efficiency of IGF2BP2 was validated using qRT-PCR (left panel) and Western blotting (right panel). F, relative mRNA expression level of E2F7 in control or IGF2BP2-depleted SUNE-1 and HONE-1 cells. G, relative luciferase activity in SUNE-1 and HONE-1 cells transfected with wild-type or mutant E2F7 3′ UTR constructs upon IGF2BP2 silencing. Data are shown as the relative ratio of Firefly to Renilla luciferase activity. H, E2F7 RNA stability with or without IGF2BP2 silencing in SUNE-1 and HONE-1 cells quantified by qRT-PCR. I and J, the effect of IGF2BP2 knockdown on abrogating the VIRMA-mediated promotion of cell proliferation and invasion. CCK-8 assays (I) and Transwell assays (J) were performed, respectively, for cell proliferation and invasion. Scale bar: 200 μm. Data are presented as the mean ± SD. ∗p < 0.05, ∗∗p < 0.01. CCK-8, Cell Counting Kit-8; IGF2BP, insulin-like growth factor 2 mRNA-binding protein; VIRMA, vir-like m6A methyltransferase associated.
Figure 6
Figure 6
E2F7 transactivates ITGA2, ITGA5, and NTRK1 cooperatively with CBFB-recruited RUNX1.A, Venn diagram of differentially expressed genes after E2F7 knockdown or E2F7 overexpression identified by RNA-seq and E2F7 binding gene promoters identified by ChIP-seq. B, the top consensus motif was analyzed by the motif discovery algorithm DREME (https://meme-suite.org/meme/tools/dreme) based on the ChIP-seq data. C, Kyoto Encyclopedia of Genes and Genomes (KEGG) pathway analysis of differentially expressed genes identified by RNA-seq. D, ChIP-seq revealed E2F7 binding to promoter regions of ITGA2, ITGA5, and NTRK1 in HONE-1. E, relative RNA (left panel) and protein (right panel) levels of ITGA2, ITGA5, and NTRK1 upon E2F7 knockdown. F, relataive RNA (left panel) and protein (right panel) levels of ITGA2, ITGA5, and NTRK1 with or without E2F7 overexpression. G, relative level of occupancy in ITGA2, ITGA5, and NTRK1 promoter regions by E2F7, with or without E2F7 overexpression. H, left, schematic representation of the ITGA2, ITGA5, and NTRK1 promoter regions constructed on luciferase reporter expression vectors; Right, relative luciferase activity in HONE-1 cells transfected with wild-type or E2F7-binding-site mutant ITGA2, ITGA5, or NTRK1 luciferase reporter expression vectors upon E2F7 silencing. The numbers indicated the distance to transcription start sites (TSS) of the corresponding gene. I, Co-IP assays performed using anti-E2F7 antibodies or normal rabbit IgG to detect the interaction between endogenous E2F7 and CBFB in HONE-1 and SUNE-1 cells. J, immunoblotting of exogenous E2F7 and RUNX1 immunoprecipitated using anti-RUNX1 antibodies or normal rabbit IgG, with or without CBFB silencing, using immunoprecipitation assays. K, relative level of occupancy in the ITGA2, ITGA5, and NTRK1 promoter regions by RUNX1. Data are presented as the mean ± SD. ∗p < 0.05. CBFB, Core-binding factor subunit beta; ITGA, integrin subunit alpha; mut, mutant; NTRK1, neurotrophic receptor tyrosine kinase; RUNX1, RUNX family transcription factor 1; WT, wild-type.
Figure 7
Figure 7
VIRMA upregulates ITGA2, ITGA5, and NTRK1 expression and activates the PI3K-Akt signaling pathway to promote NPC cell proliferation and metastasis.A, Western blotting analysis of ITGA2, ITGA5, NTRK1, phospho-Akt (p-Akt), and Akt in SUNE-1 and HONE-1 cells transfected with scrambled control or si-VIRMA. B, Western blotting analysis of ITGA2, ITGA5, NTRK1, p-Akt, and Akt in SUNE-1 and HONE-1 cells transfected with empty vectors or VIRMA overexpressing vectors. C, Western blotting analysis of ITGA2, ITGA5, NTRK1, p-Akt, and Akt in SUNE-1 and HONE-1 cells co-transfected with scrambled control or si-VIRMA, together with the empty vector, or ITGA2, ITGA5, or NTRK1 overexpression vectors. D and E, CCK-8 assays determining the proliferation ability of SUNE-1 (D) and HONE-1 (E) cells co-transfected with scrambled control or si-VIRMA, together with empty vector, ITGA2, ITGA5, or NTRK1 overexpression vectors. F and G, Transwell assays to evaluate the migration and invasion capacity of SUNE-1 (F) and HONE-1 (G) cells co-transfected with scrambled control or scrambled control or si-VIRMA, together with empty vector, ITGA2, ITGA5, or NTRK1 overexpression vectors. Scale bar: 200 μm. Data are presented as the mean ± SD. ∗p < 0.05. CCK-8, Cell Counting Kit-8; ITGA, integrin subunit alpha; NTRK1, neurotrophic receptor tyrosine kinase; RUNX1, RUNX family transcription factor 1; VIRMA, vir-like m6A methyltransferase associated.
Figure 8
Figure 8
The diagram of VIMRA promotes tumorigenesis and metastasis in an m6A-dependent manner.VIRMA was transcriptionally activated by KAT3A-mediated H3K27ac. Upregulation of VIRMA substantially increased m6A deposition in E2F7 mRNA, which promoted E2F7 expression in an m6A-IGF2BP2-dependent manner. Ultimately, E2F7 interacted with CBFB, then recruited RUNX1 to transcriptionally activate ITGA2, ITGA5, and NTRK1, and endowed proliferative and metastatic properties for NPC cells. ITGA, integrin subunit alpha; m6A, N6-methyladenosine; NPC, nasopharyngeal carcinoma; NTRK1, neurotrophic receptor tyrosine kinase; VIRMA, vir-like m6A methyltransferase associated.

Similar articles

Cited by

References

    1. Bray F., Ferlay J., Soerjomataram I., Siegel R.L., Torre L.A., Jemal A. Global cancer statistics 2018: GLOBOCAN estimates of incidence and mortality worldwide for 36 cancers in 185 countries. CA Cancer J. Clin. 2018;68:394–424. - PubMed
    1. Mao Y.P., Tang L.L., Chen L., Sun Y., Qi Z.Y., Zhou G.Q., et al. Prognostic factors and failure patterns in non-metastatic nasopharyngeal carcinoma after intensity-modulated radiotherapy. Chin. J. Cancer. 2016;35:103. - PMC - PubMed
    1. Chen Y.P., Chan A.T.C., Le Q.T., Blanchard P., Sun Y., Ma J. Nasopharyngeal carcinoma. Lancet. 2019;394:64–80. - PubMed
    1. Qiao H., Tan X.R., Li H., Li J.Y., Chen X.Z., Li Y.Q., et al. Association of intratumoral microbiota with prognosis in patients with nasopharyngeal carcinoma from 2 hospitals in China. JAMA Oncol. 2022;8:1301–1309. - PMC - PubMed
    1. Dawson M.A., Kouzarides T. Cancer epigenetics: from mechanism to therapy. Cell. 2012;150:12–27. - PubMed

Publication types

MeSH terms