. 2023 Apr 7;11(4):e004150.
doi: 10.1136/jitc-2021-004150.

Glucocorticoid activation by HSD11B1 limits T cell-driven interferon signaling and response to PD-1 blockade in melanoma

Affiliations

Glucocorticoid activation by HSD11B1 limits T cell-driven interferon signaling and response to PD-1 blockade in melanoma

Luiza Martins Nascentes Melo et al. J Immunother Cancer. .

Abstract

Background: Immune responses against tumors are subject to negative feedback regulation. Immune checkpoint inhibitors (ICIs) blocking Programmed cell death protein 1 (PD-1), a receptor expressed on T cells, or its ligand PD-L1 have significantly improved the treatment of cancer, in particular malignant melanoma. Nevertheless, responses and durability are variables, suggesting that additional critical negative feedback mechanisms exist and need to be targeted to improve therapeutic efficacy.

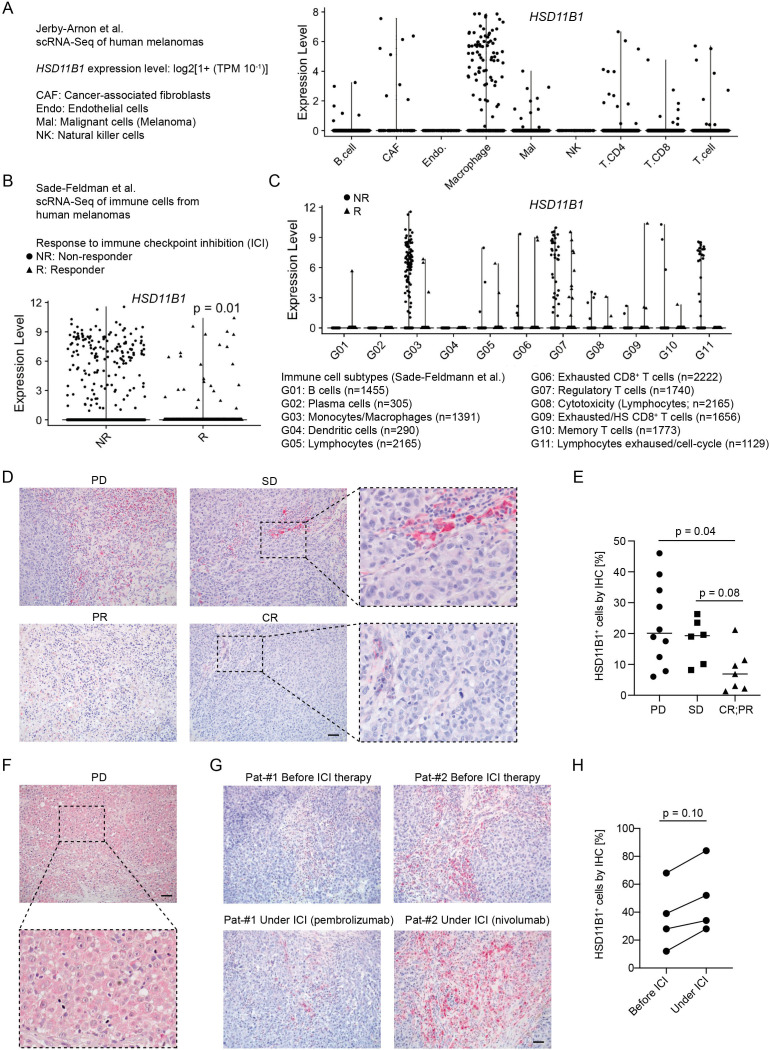
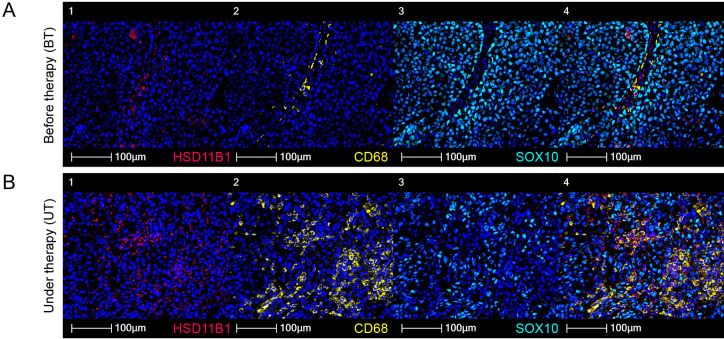
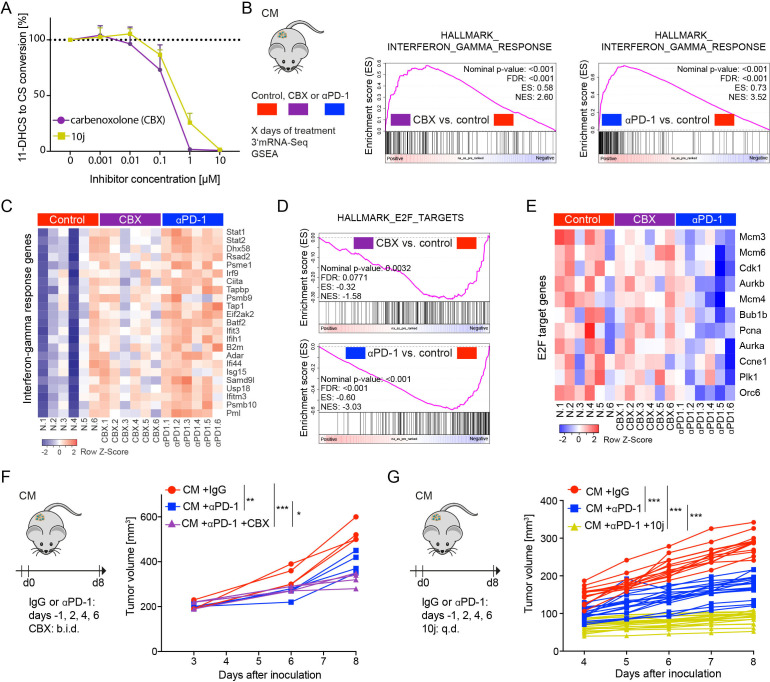
Methods: We used different syngeneic melanoma mouse models and performed PD-1 blockade to identify novel mechanisms of negative immune regulation. Genetic gain-of-function and loss-of-function approaches as well as small molecule inhibitor applications were used for target validation in our melanoma models. We analyzed mouse melanoma tissues from treated and untreated mice by RNA-seq, immunofluorescence and flow cytometry to detect changes in pathway activities and immune cell composition of the tumor microenvironment. We analyzed tissue sections of patients with melanoma by immunohistochemistry as well as publicly available single-cell RNA-seq data and correlated target expression with clinical responses to ICIs.

Results: Here, we identified 11-beta-hydroxysteroid dehydrogenase-1 (HSD11B1), an enzyme that converts inert glucocorticoids into active forms in tissues, as negative feedback mechanism in response to T cell immunotherapies. Glucocorticoids are potent suppressors of immune responses. HSD11B1 was expressed in different cellular compartments of melanomas, most notably myeloid cells but also T cells and melanoma cells. Enforced expression of HSD11B1 in mouse melanomas limited the efficacy of PD-1 blockade, whereas small molecule HSD11B1 inhibitors improved responses in a CD8+ T cell-dependent manner. Mechanistically, HSD11B1 inhibition in combination with PD-1 blockade augmented the production of interferon-γ by T cells. Interferon pathway activation correlated with sensitivity to PD-1 blockade linked to anti-proliferative effects on melanoma cells. Furthermore, high levels of HSD11B1, predominantly expressed by tumor-associated macrophages, were associated with poor responses to ICI therapy in two independent cohorts of patients with advanced melanomas analyzed by different methods (scRNA-seq, immunohistochemistry).

Conclusion: As HSD11B1 inhibitors are in the focus of drug development for metabolic diseases, our data suggest a drug repurposing strategy combining HSD11B1 inhibitors with ICIs to improve melanoma immunotherapy. Furthermore, our work also delineated potential caveats emphasizing the need for careful patient stratification.

Keywords: CD8-positive T-lymphocytes; immunotherapy; interferon; melanoma; programmed cell death 1 receptor.


Conflict of interest statement

Competing interests: None declared.

Figures

Figure 1
Figure 1
HSD11B1 expression in human melanomas associates with clinical response to ICI therapy. (A–C) Violin plot visualization of HSD11B1 expression in publicly available scRNA-seq datasets from human melanomas separated by cell types (A, C) or response to ICI (B) as indicated. (D) Detection of HSD11B1 expression in human melanomas by IHC. Right panels. Zoom-in views as indicated. (E) Summary of automated quantification of HSD11B1 signals and group comparisons by best clinical responses to ICI therapy. (F) Melanoma case with strong IHC signal for HSD11B1 within melanoma cell compartment. (G) HSD11B1 expression by IHC expression in patient-matched melanoma biopsies of patients finally diagnosed for PD before and under ICI therapy. (H) Quantification of (F) by paired comparisons. Scale bars=50 µm (C, E, F). Statistics: Unpaired (B, E) and paired (H) Wilcoxon rank-sum tests. CR, complete response; ICI, immune checkpoint inhibitor; IHC, immunohistochemistry; PD, progressive disease; PR, partial response; SD, stable disease.
Figure 2
Figure 2
Recruitment of HSD11B1+ macrophages in human melanoma under ICI therapy. Co-detection by indexing tissue imaging for HSD11B1 (red), CD68+ macrophages (yellow), Sox 10+ melanoma cells (light blue) and DAPI (nuclei, dark blue) before (A) and under ICI therapy (B). Scale bars=100 µm. ICI, immune checkpoint inhibitor.
Figure 3
Figure 3
HSD11B1 expression confers resistance to PD-1 blockade. (A) Overview of mouse melanoma cell lines and Hsd11b1 expression (3’mRNA-seq). (B) Kinetic of 11-DHCS to CS conversion in indicated cell lines assayed by CS-specific ELISA (n=3). Dashed line indicates input (100%) of 11-DHCS. Error bars, SD. (C) 11-DHCS to CS conversion (% of input 11-DHCS) in indicated cell lines at 40 min and 3 hours assayed by CS-specific ELISA (n=3). (D) GSEA plot for indicated gene set. Comparison of CM and LN transcriptomes (3’mRNA-seq). (E) In vitro cell growth of CM vs LN cells exposed to IFN-γ. Upper panel: Quantification of n=3. Lower panel: Representative images of stained tissue culture wells. (F) Tumor growth kinetics (left) and final tumor weight at day 12 (right) of CM and LN melanomas treated with αPD-1 or IgG control. (G) Heatmap showing proliferation-associated gene expression (3’mRNA-seq) in CM and LN melanomas from (F). (H, I) Correlation of Hsd11b1 expression with T cell (cytotoxic) marker genes (H) and myeloid cell marker genes (I) in CM melanomas treated with αPD-1 or IgG control. (J) Individual tumor growth curves and (K) tumor weight (at day 8) of CM melanomas ectopically expressing Hsd11b1 (pRP.Hsd11b1) vs CM controls (pRP) treated with αPD-1 or IgG control. (L, M) Intratumoral CD8+ T cells (L) and CD4+ T cells (M) assessed by immunofluorescence from multiple representative regions. Statistics: *p<0.05, **p<0.01, ***p<0.001. Two-sided unpaired t-tests (B, F, K–M), with logarithms (C, E). Correction for multiple comparison with Benjamini and Hochberg method (E). 11-DHCS, 11-dehydrocorticosterone; CM, cutaneous melanoma; CS, corticosterone; FDR, false discovery rate; GSEA, gene set enrichment analysis; IFN-γ, interferon-γ; LN, lymph node; (N)ES,(normalized) enrichment score; r, Pearson’s correlation coefficient.
Figure 4
Figure 4
Pharmacological HSD11B1 inhibition enhances anti-PD-1 therapy. (A) Titration of HSD11B1 inhibitors carbenoxolone (CBX) and 10j and inhibitory effect on 11-DHCS to CS conversion (% of input 11-DHCS) assayed by CS-specific ELISA in CM cells. (B) Overview of CM melanoma samples (n=6 per group) for 3’mRNA-seq analysis and GSEA plots of top enriched interferon response gene sets in CBX and αPD-1-treated CM melanoma samples compared with non-treated controls. (C) Heatmap visualizing expression of subset of interferon response genes in CM melanoma samples from (B). (D) GSEA plots for proliferation-associated gene sets. Samples and group comparisons as in (B, C). (E) Heatmap visualizing expression of subset of proliferation-associated genes in CM melanoma samples from (B). (F) Individual CM melanoma growth curves treated as indicated (n=4 per group). (G) Individual CM melanoma growth curves treated as indicated (n=13 control group, n=17 αPD-1 and n=17 αPD-1 + 10j group). Statistics: *p<0.05, **p<0.01, ***p<0.001. Two-sided unpaired t-tests (F, G) with correction for multiple comparisons (Benjamini and Hochberg method). 11-DHCS, 11-dehydrocorticosterone; CM, cutaneous melanoma; CS, corticosterone; FDR, false discovery rate; GSEA, gene set enrichment analysis; (N)ES, (normalized) enrichment score.
Figure 5
Figure 5
HSD11B1 inhibition modulates macrophage polarization and activity. (A) Experimental outline of bone marrow-derived macrophages (BMDM) and treatment conditions for in vitro polarization. (B) Representative FACS blots of Ly6C as marker for M1 and CD206 and Arg1 as markers for M2 macrophages from bone marrow-derived (CD11b+F4/80+) cells. Distribution of Hsd11b1 expression in BMDM from non-treated (C) and treated mice (D) bearing CM melanomas (n=2). Liver tissue was used as a control. Dotted line indicates the median. M0 median: 0.00005, M1 median: 0.0002, M2 median: 0.00008. (E) Sorting of tumor-derived macrophages. Gating strategy for flow cytometry. (F) Hsd11b1 expression in tumor-derived macrophages from mice bearing CM melanomas under indicated treatment conditions (n=2). (G) Detection of M2 macrophage markers CD206 and Arg1 in TAMs of mice under therapy. Median fluorescence intensity (MFI). (H) Quantitative analyses of IL-12 in tumor-derived macrophages in mice of indicated treatment conditions (n=2). CM, cutaneous melanoma; H, IL-4, interleukin-4; M-CSF, macrophage colony-stimulating factor; LPS, lipopolysaccharide; TAMs, tumor-associated macrophages.FCS, forward scatter; SSC, side scatter.
Figure 6
Figure 6
HSD11B1 inhibition augments IFN-γ production of CD8+ T cells under PD-1 blockade. (A) Effect of HSD11B1 inhibition on IFN-γ production by intratumoral (CM) CD8+ T cells. Gating strategy for flow cytometry. (B) Representative FACS blots showing frequencies of IFN-γ +CD8+ cells in CM melanomas treated as indicated. (C) Quantification of experiment described in (B). Two-sided unpaired t-test with logarithms. (D) Effect of HSD11B1 inhibition on IFN-γ production by Pmel-1 T cells in vitro. Gating strategy for flow cytometry. (E) Representative FACS blots (IFN-γ positivity) of gp100 activated Pmel-1 T cells treated as indicated. (F) Quantification of experiments (n=3) described in (D, E). 11-DHCS, DEXA (100 nM), CBX and 10j (10 µM). (G) Experimental outline of CD8+ T cell depletion in mice bearing CM melanomas and treatment conditions. (H, I) Frequencies of CD8+ T cells in (H) tumor and (I) tumor-draining LN assessed by flow cytometry. (J) Individual CM melanoma tumor growth curves and (K) tumor volume at day 8 after inoculation treated as indicated with or without antibody-mediated depletion of CD8+ cells. Statistics: *p<0.05, **p<0.01, ***p<0.001. Two-sided unpaired t-tests (for ratios with logarithms). 11-DHCS, 11-dehydrocorticosterone; CM, cutaneous melanoma; DEXA, dexamethasone; IFN-γ, interferon-γ; tdLN, tumor-draining lymph node.

References

    1. Larkin J, Chiarion-Sileni V, Gonzalez R, et al. . Five-Year survival with combined nivolumab and ipilimumab in advanced melanoma. N Engl J Med 2019;381:1535–46. 10.1056/NEJMoa1910836 - DOI - PubMed
    1. Robert C, Ribas A, Schachter J, et al. . Pembrolizumab versus ipilimumab in advanced melanoma (KEYNOTE-006): post-hoc 5-year results from an open-label, multicentre, randomised, controlled, phase 3 study. Lancet Oncol 2019;20:1239–51. 10.1016/S1470-2045(19)30388-2 - DOI - PubMed
    1. Schadendorf D, van Akkooi ACJ, Berking C, et al. . Melanoma. Lancet 2018;392:971–84. 10.1016/S0140-6736(18)31559-9 - DOI - PubMed
    1. Fritz JM, Lenardo MJ. Development of immune checkpoint therapy for cancer. J Exp Med 2019;216:1244–54. 10.1084/jem.20182395 - DOI - PMC - PubMed
    1. Gide TN, Wilmott JS, Scolyer RA, et al. . Primary and acquired resistance to immune checkpoint inhibitors in metastatic melanoma. Clin Cancer Res 2018;24:1260–70. 10.1158/1078-0432.CCR-17-2267 - DOI - PubMed

Publication types

MeSH terms

Substances