. 2023 Apr 7;10(3):e200096.
doi: 10.1212/NXI.0000000000200096. Print 2023 May.

Comparative Effects of Domain-Specific Human Monoclonal Antibodies Against LGI1 on Neuronal Excitability

Affiliations

Comparative Effects of Domain-Specific Human Monoclonal Antibodies Against LGI1 on Neuronal Excitability

Josefine Sell et al. Neurol Neuroimmunol Neuroinflamm. .

Abstract

Background and objectives: Autoantibodies to leucine-rich glioma inactivated protein 1 (LGI1) cause an autoimmune limbic encephalitis with frequent focal seizures and anterograde memory dysfunction. LGI1 is a neuronal secreted linker protein with 2 functional domains: the leucine-rich repeat (LRR) and epitempin (EPTP) regions. LGI1 autoantibodies are known to interfere with presynaptic function and neuronal excitability; however, their epitope-specific mechanisms are incompletely understood.

Methods: We used patient-derived monoclonal autoantibodies (mAbs), which target either LRR or EPTP domains of LGI1 to investigate long-term antibody-induced alteration of neuronal function. LRR- and EPTP-specific effects were evaluated by patch-clamp recordings in cultured hippocampal neurons and compared with biophysical neuron modeling. Kv1.1 channel clustering at the axon initial segment (AIS) was quantified by immunocytochemistry and structured illumination microscopy techniques.

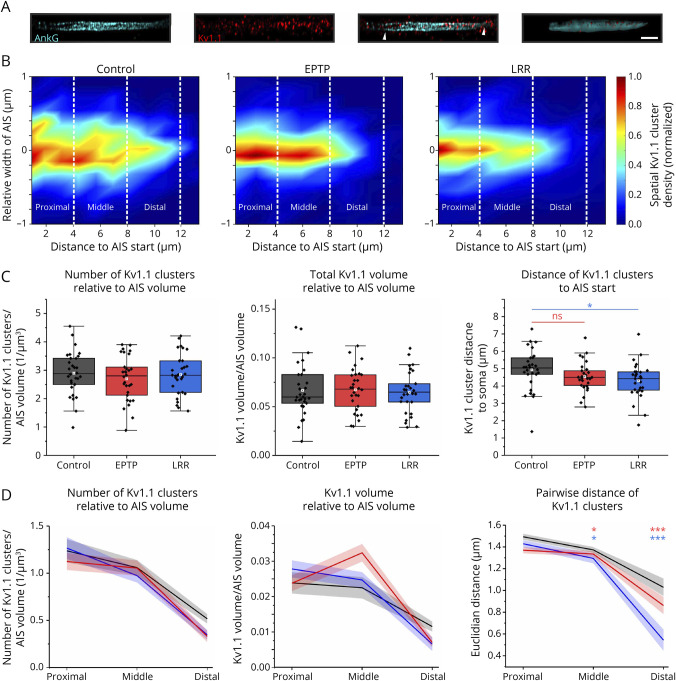
Results: Both EPTP and LRR domain-specific mAbs decreased the latency of first somatic action potential firing. However, only the LRR-specific mAbs increased the number of action potential firing together with enhanced initial instantaneous frequency and promoted spike-frequency adaptation, which were less pronounced after the EPTP mAb. This also led to an effective reduction in the slope of ramp-like depolarization in the subthreshold response, suggesting Kv1 channel dysfunction. A biophysical model of a hippocampal neuron corroborated experimental results and suggests that an isolated reduction of the conductance of Kv1-mediated K+ currents largely accounts for the antibody-induced alterations in the initial firing phase and spike-frequency adaptation. Furthermore, Kv1.1 channel density was spatially redistributed from the distal toward the proximal site of AIS under LRR mAb treatment and, to a lesser extant, under EPTP mAb.

Discussion: These findings indicate an epitope-specific pathophysiology of LGI1 autoantibodies. The pronounced neuronal hyperexcitability and SFA together with dropped slope of ramp-like depolarization after LRR-targeted interference suggest disruption of LGI1-dependent clustering of K+ channel complexes. Moreover, considering the effective triggering of action potentials at the distal AIS, the altered spatial distribution of Kv1.1 channel density may contribute to these effects through impairing neuronal control of action potential initiation and synaptic integration.


Conflict of interest statement

C. Geis received honoraria and/or research support from Alexion and Roche. S.R. Irani is an inventor on Diagnostic Strategy to improve specificity of CASPR2 antibody detection (PCT/G82019/051257) and receives royalties on a licensed patent application for LGI1/CASPR2 testing as coapplicant (PCT/GB2009/051441) entitled “Neurological Autoimmune Disorders”. S.R. Irani has received honoraria and/or research support from UCB, Immunovant, MedImmune, Roche, Janssen, Cerebral therapeutics, CSL Behring, and ONO Pharma. The other authors report no disclosures relevant to the manuscript. Go to Neurology.org/NN for full disclosures.

Figures

Figure 1
Figure 1. LRR- But Not EPTP-mAb Increases the Neuronal Firing Rate in Primary Hippocampal Cell Cultures
(A) Membrane potential traces of cell responses to 1-second depolarizing current steps (bottom: +40 pA, middle: +90 pA, and top: +130 pA) from neurons treated with control-mAb (n = 18 cells, left panel, black), EPTP-mAb12 (n = 13, middle panel, red), or LRR-mAb02 (n = 13, right panel, blue) for 7 days. (B) Neurons fire more action potentials (APs) with increasing step currents from 0 to 250 pA under LRR-mAb treatment (whole-curve permutation test: P [EPTP vs control] = 0.313; P [LRR vs control] = 0.023 [blue *]). (C) The LRR and EPTP mAb treatment cause a reduction in the latency to 1st AP at the individual rheobase current (one-way ANOVA followed by the Fisher LSD post hoc test, P [EPTP vs control] = 0.010 [blue *]; P [LRR vs control] = 0.033 [red *]). Box plots show the median, 25th, and 75th percentiles; whiskers indicate the 10th and 90th percentiles; open squares represent the mean, and each filled dot represents single cells. EPTP = epitempin; LRR = leucine-rich repeat.
Figure 2
Figure 2. LRR-mAb Enhances Initial Firing and Spike-Frequency Adaptation Effect
(A) Sample traces of spiking behavior of neurons treated with control- (left), EPTP-(middle), or LRR-mAb (right) in response to a step current of +180 pA. (B) LRR-mAbs induce a more pronounced enhancement of, in particular initial, firing frequency (f) of neurons, particularly at current steps above 150 pA. (B, left) Initial instantaneous frequency, f0 (whole-curve permutation test: P [EPTP vs control] = 0.087, P [LRR vs control] = 0. [blue ***]). (B, middle) Mean instantaneous frequency (P [EPTP vs control] = 0.338; P [LRR vs control] = 0.021 [blue *]). Inset shows the levels of the instantaneous frequency at steady state (fss), which remained unaffected (P [EPTP vs control] = 0.485; P [LRR vs control] = 0.137). (B, right) Absolute spike frequency adaptation measured as f0fss shows a potent increase under LRR-mAb (whole-curve permutation test: P [EPTP vs control] = 0.041 [red *]; P [LRR vs control] = 0.0001 [blue ***]). (C) Neuronal firing frequency undergoes a stronger and faster adaptation (attenuation) after LRR-mAb treatment. Spike frequency adaptation was quantified by SFArelative (C, left) and SFAaccomodation (C, middle), where a higher index represents a stronger attenuation of instantaneous frequency over time, per current step. (C, left) SFArelative (one-way ANOVA followed by the Fisher LSD post hoc test: P [EPTP vs control] = 0.117; P [LRR vs control] = 0.005 [blue **]). (C, middle) SFAaccomodation (Kruskal-Wallis test followed by the MWU post hoc test: P [EPTP vs control] = 0.143; P [LRR vs control] = 0.0002 [blue ***]). (C, right) SFA effective time (P [EPTP vs control] = 0.043 [red *]; P [LRR vs control] = 0.0007 [blue ***]). (D) LRR-mAbs cause a remarkable drop in the ID current-dependent slope of the ramp-like depolarization in the subthreshold response. (D, left) Sample voltage traces showing the subthreshold response at the corresponding prerheobase current step for each group. (D, right) The slope of ramp for all individual neurons (one-way ANOVA followed by the Fisher LSD post hoc test: P [EPTP vs control] = 0.271; P [LRR vs control] = 0.007 [blue **]). Box plots show the median, 25th, and 75th percentiles; whiskers indicate the 10th and 90th percentiles; open squares represent the mean, and each filled dot represents a single cell value. EPTP = epitempin; LRR = leucine-rich repeat; MWU = Mann-Whitney U test; ; ns = non-significant; SFA = spike frequency adaption.
Figure 3
Figure 3. Biophysical Neuron Model Identifies Disrupted D-Type K+ Current (ID) Accounting for the Observed Higher Neuronal Excitability
(A) Presence of a slow ramp-like depolarization in the simulated, subthreshold somatic response to the current step (1 second), due to activation of ID current. Current steps: 0.1, 0.2, …,∼0.5. (B) The slope of ramp-like depolarization reduces by lowering GD density. The membrane potential traces were shown at the prerheobase current step at each simulated GD scale; 1 × GD: control (Iapp = 0.48), 0.5 × GD: half-blockage of Kv1 channels (Iapp = 0.35), 0 × GD: complete blockage (Iapp = 0.23). (C and D) Neuron model fires more spikes and exhibit shorter first spike latency at smaller GD. (C) Example voltage traces of 3 different GD scales. Iapp = 0.53. (D) The number of evoked spikes and the latency to first spike for a complete range of GD scale.
Figure 4
Figure 4. Biophysical Neuron Model Identifies Disrupted D-Type K+ Current (ID) Accounting for the Observed Higher Initial Frequency and SFA Effect
(A and B) Lowering GD leads to a remarkable increase in the initial instantaneous frequency (f0) and SFAaccomodation index with a minor effect on the steady-state value fss. The representative results were simulated at Iapp = 2.5. (A) Example voltage traces for conditions of GD scale = 1 (control) and 0.5. (B) The SFAaccomodation index, f0, and fss values for a complete range of GD scale. (C) The time course of ID current during the current step, related to the voltage traces in (A). (C and D) Lowering GD decreases D-type K+ current (ID), thereby impairing the ability of the neuron model to constrain its initial firing frequency (compare corresponding panels in [A]). Current traces were normalized to the maximum value across the 2 conditions. SFA = spike frequency adaption.
Figure 5
Figure 5. LRR-Specific Antibodies Cause an Abnormal Redistribution of Kv1.1 Clusters at the Distal AIS
(A) Sample images of ankyrinG staining, demonstrating the AIS, Kv1.1 channel clusters and the overlay of both detections. Arrowheads indicate the beginning and end of the AIS used for 3D reconstruction. Right: 3D reconstruction of AIS and colocalized Kv1.1 clusters after SIM imaging. Scale bar = 2 µm. (B) The overall density maps of Kv1.1 clusters over AIS, showing a marked shrinkage of their spatial dispersion across AIS, after LRR-mAb treatment (control: n = 30, EPTP-mAb: n = 30, and LRR-mAb: n = 31 AIS). The map of each group was normalized to its maximum value. (C) The number (left, one-way ANOVA followed by the Fisher LSD post hoc test, P [EPTP vs control] = 0.313; P [LRR vs control] = 0.796) and total volume (middle, one-way ANOVA followed by the Fisher LSD post hoc test, P [EPTP vs control] = 0.914; P [LRR vs control] = 0.747) of Kv1 clusters remained unchanged. LGI1 mAbs redistribute Kv1 clusters towards the proximal site of the AIS (right). (D) LRR-mAb affects Kv1.1 cluster density largely at the distal AIS. The analysis was performed per each of the proximal, middle, and distal sections of the AIS (as depicted in B). Left and middle: the number and total volume of Kv1 clusters relative to AIS volume. Right: the mean Euclidian distance of each cluster to the others within each AIS section. Data presented as median ± SEM. The tests were performed based on the permutation test of Cohen, thereby accounting for multiple comparison problem (*p < 0.05; ***p < 0.001). AIS = axonal initial segment; ANOVA = analysis of variance; EPTP = epitempin; LGI1 = leucine-rich glioma inactivated protein 1; LRR = leucine-rich repeat; NS = non-significant; SEM = standard error of the mean.
Figure 6
Figure 6. LRR-mAb Disturb Higher-Assembly LGI1-ADAM22-Kv1 Complexes at the AIS and Trigger a Proximal Shift of Kv1.1 Channels
The scheme depicts the model of a 3:3 heterohexamer where LGI1 binds ADAM22 in a cis-conformation, as well as the cell adhesion molecules (e.g., TAG-1 and Caspr2), which anchor these complexes at the AIS membrane, thereby leading to tight clusters of Kv1.1 channels along the AIS (based on Ref.). LGI1 autoantibodies, in particular LRR-mAb, disrupt the interaction between LGI1 molecules, which may destabilize the tripartite complexes and anchoring of Kv1.1. This altered cluster organization results in a noticeable redistribution of Kv1.1 channels toward the proximal site of the AIS and subsequent disturbances in the neuronal control on AP initiation and subthreshold integration. Created with BioRender.com. AIS = axonal initial segment; LGI1 = leucine-rich glioma inactivated protein 1.

References

    1. Irani SR, Alexander S, Waters P, et al. . Antibodies to Kv1 potassium channel-complex proteins leucine-rich, glioma inactivated 1 protein and contactin-associated protein-2 in limbic encephalitis, Morvan's syndrome and acquired neuromyotonia. Brain. 2010;133(9):2734-2748. doi. 10.1093/brain/awq213 - DOI - PMC - PubMed
    1. Lai M, Huijbers MG, Lancaster E, et al. . Investigation of LGI1 as the antigen in limbic encephalitis previously attributed to potassium channels: a case series. Lancet Neurol. 2010;9(8):776-785. doi. 10.1016/S1474-4422(10)70137-X - DOI - PMC - PubMed
    1. Dalmau J, Geis C, Graus F. Autoantibodies to synaptic receptors and neuronal cell surface proteins in autoimmune diseases of the central nervous system. Physiol Rev. 2017;97(2):839-887. doi. 10.1152/physrev.00010.2016 - DOI - PMC - PubMed
    1. Irani SR, Michell AW, Lang B, et al. . Faciobrachial dystonic seizures precede Lgi1 antibody limbic encephalitis. Ann Neurol. 2011;69(5):892-900. doi. 10.1002/ana.22307 - DOI - PubMed
    1. Geis C, Planaguma J, Carreno M, Graus F, Dalmau J. Autoimmune seizures and epilepsy. J Clin Invest. 2019;129(3):926-940. doi. 10.1172/JCI125178 - DOI - PMC - PubMed

Publication types

Supplementary concepts