. 2023 Apr 7;9(1):56.
doi: 10.1038/s41531-023-00500-5.

Aberrant somatic calcium channel function in cNurr1 and LRRK2-G2019S mice

Affiliations

Aberrant somatic calcium channel function in cNurr1 and LRRK2-G2019S mice

Olga Skiteva et al. NPJ Parkinsons Dis. .

Abstract

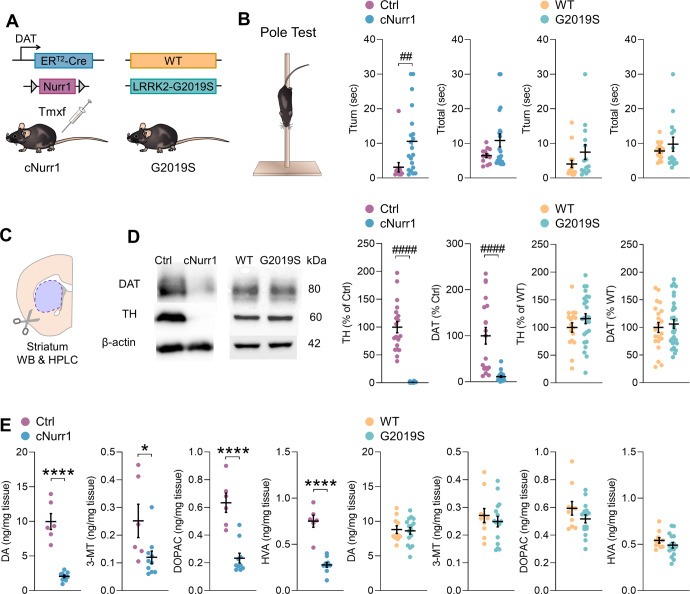
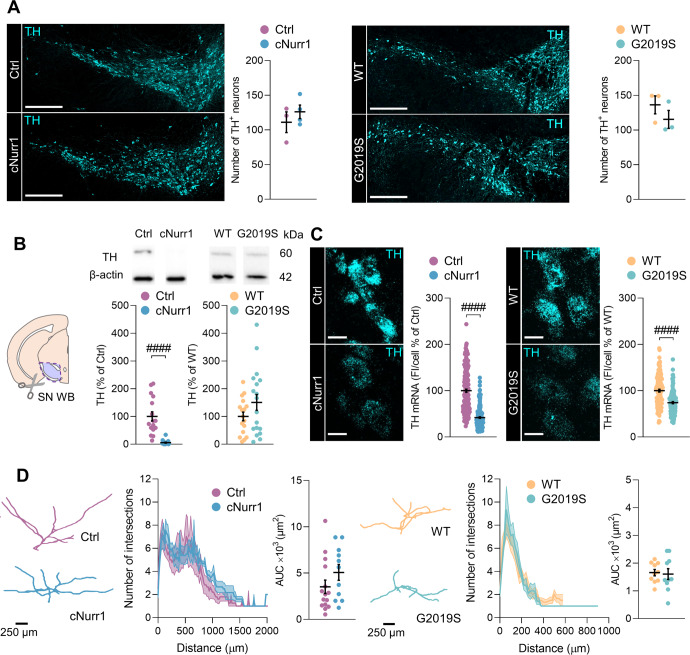
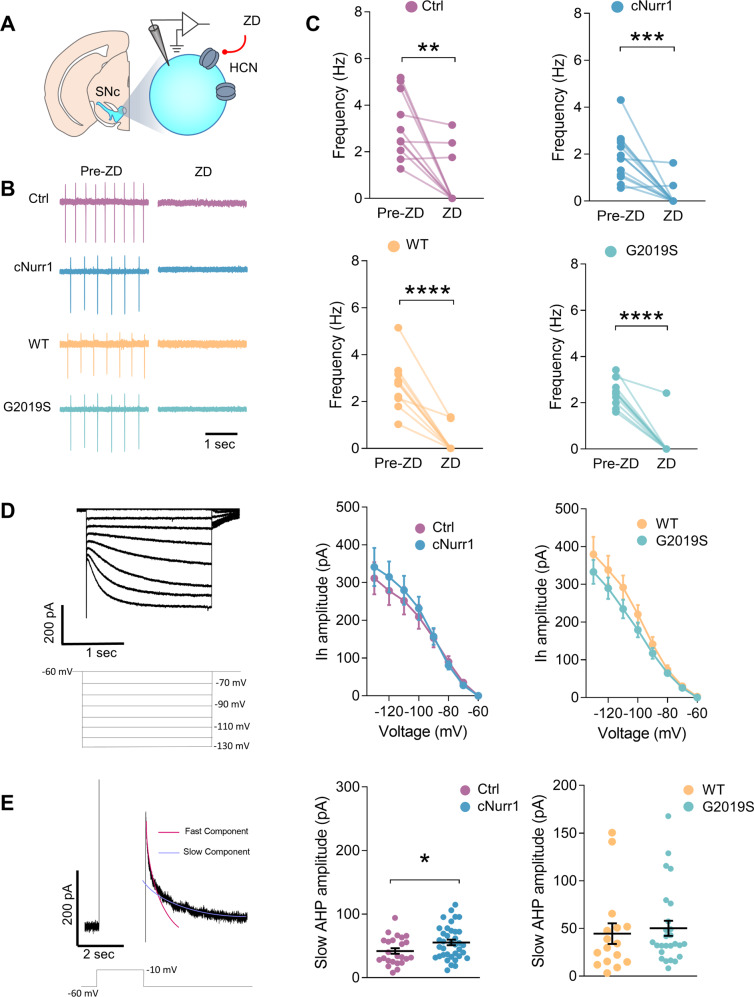
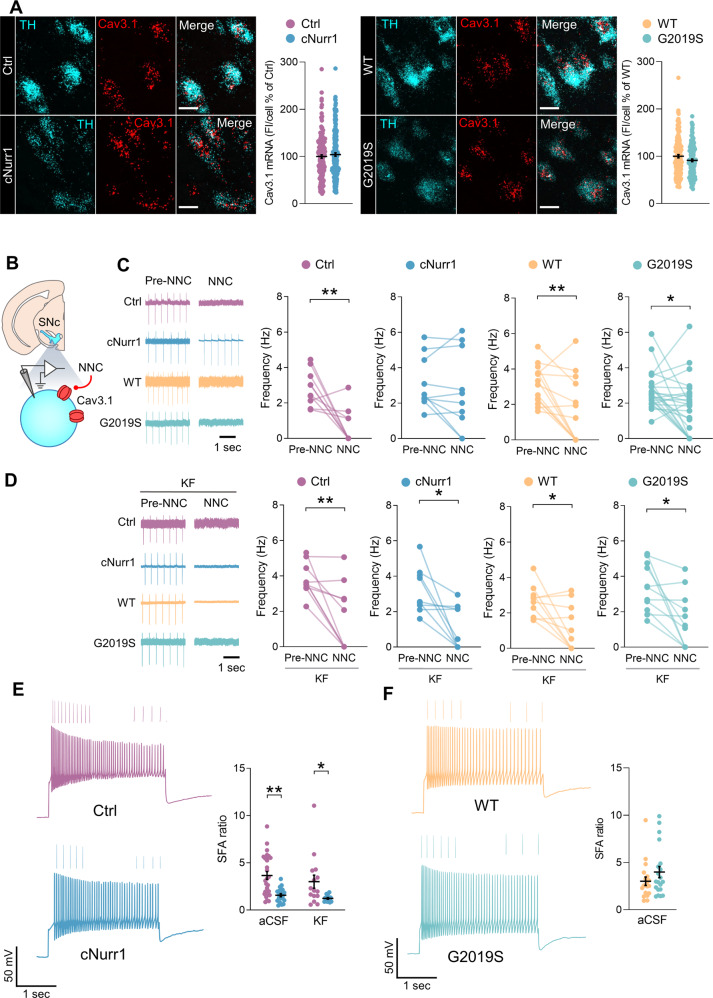
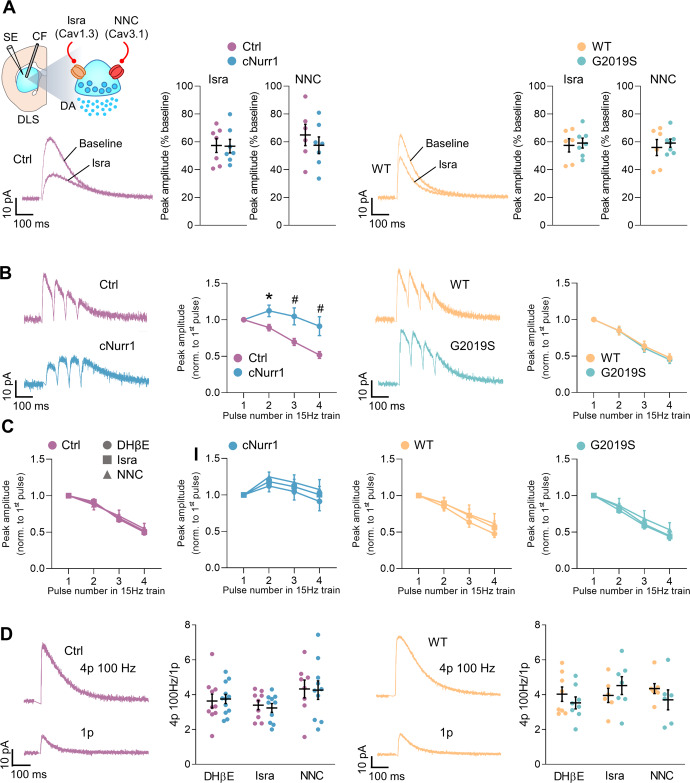
In Parkinson's disease (PD), axons of dopaminergic (DA) neurons in the substantia nigra pars compacta (SNc) degenerate before their cell bodies. Calcium influx during pacemaker firing might contribute to neuronal loss, but it is not known if dysfunctions of voltage-gated calcium channels (VGCCs) occur in DA neurons somata and axon terminals. We investigated T-type and L-type VGCCs in SNc-DA neurons of two mouse models of PD: mice with a deletion of the Nurr1 gene in DA neurons from an adult age (cNurr1 mice), and mice bearing the G2019S mutation in the gene coding for LRRK2 (G2019S mice). Adult cNurr1 mice displayed motor and DA deficits, while middle-aged G2019S mice did not. The number and morphology of SNc-DA neurons, most of their intrinsic membrane properties and pacemaker firing were unaltered in cNurr1 and G2019S mice compared to their control and wild-type littermates. L-type VGCCs contributed to the pacemaker firing of SNc-DA neurons in G2019S mice, but not in control, wild-type, and cNurr1 mice. In cNurr1 mice, but not G2019S mice, the contribution of T-type VGCCs to the pacemaker firing of SNc-DA neurons was reduced, and somatic dopamine-D2 autoreceptors desensitized more. Altered contribution of L-type and T-type VGCCs to the pacemaker firing was not observed in the presence of a LRRK2 kinase inhibitor in G2019S mice, and in the presence of a flavonoid with antioxidant activity in G2019S and cNurr1 mice. The role of L-type and T-type VGCCs in controlling dopamine release from axon terminals in the striatum was unaltered in cNurr1 and G2019S mice. Our findings uncover opposite changes, linked to oxidative stress, in the function of two VGCCs in DA neurons somata, but not axon terminals, in two different experimental PD models.


Conflict of interest statement

The authors declare no competing interests.

Figures

Fig. 1
Fig. 1. cNurr1, but not G2019S, mice display motor deficits and DA biochemical alterations.
A Scheme illustrating the cNurr1 and G2019S mouse lines. Tamoxifen (Tmxf) injections produced Cre-mediated ablation of Nurr1 in mature DA neurons in cNurr1 mice. B Fine motor coordination was assessed with the pole test. Tturn: time taken by the mice to turn downward from the top of a vertical pole; Ttotal: total time to descend the pole. N = 13 Ctrl, 20 cNurr1, 16 WT and 14 G2019S mice. ##P < 0.01; Mann–Whitney U-test. C Schematic representation depicting the striatum, which was dissected for Western blotting (WB) and HPLC experiments. D Western blotting of TH in the striatum of N = 19 Ctrl, 26 cNurr1, 17 WT and 25 G2019S mice, and DAT in the striatum of N = 19 Ctrl, 26 cNurr1, 21 WT and 30 G2019S mice. ####P < 0.0001; Mann–Whitney U-test. E Amounts of dopamine and its metabolites 3-MT, DOPAC and HVA measured with HPLC in the striatum of N = 6 Ctrl, 10 cNurr1, 10 WT and 16 G2019S mice. *P < 0.05; ****P < 0.0001; Unpaired Student’s t-test.
Fig. 2
Fig. 2. SNc-DA neurons in cNurr1 and G2019S mice have intact cell count and morphology but display reduced TH mRNA.
A TH immunofluorescence in midbrain sections containing the SNc; scale bars, 500 µm. Number of TH-positive neurons in the SNc of N = 3 Ctrl, 4 cNurr1, 3 WT and 3 G2019S mice. B Western blotting of TH in the ventral midbrain region containing the SNc of N = 16 Ctrl, 19 cNurr1, 17 WT and 18 G2019S mice. ####P < 0.0001; Mann–Whitney U-test. C Representative images of neurons in the SNc from FISH experiments of TH mRNA; scale bars, 15 µm. Quantification of fluorescence in individual TH-containing cells in the SNc. n = 186, 185, 135, 126 TH-positive neurons from N = 3 Ctrl, 3 cNurr1, 3 WT and 3 G2019S mice. ####P < 0.0001; Mann–Whitney U-test. D Representative drawings illustrating the dendritic arborization of neurobiotin-injected neurons in the SNc of Ctrl, cNurr1, WT and G2019S mice. Sholl analysis shows the number of intersections and area under the curve (AUC) measured in n = 15, 11, 10, 10 neurobiotin-injected neurons from N = 6 Ctrl, 8 cNurr1, 4 WT and 4 G2019S mice.
Fig. 3
Fig. 3. SNc-DA neurons have unaltered Ih currents in cNurr1 and G2019S mice but display an increased slow AHP in cNurr1 mice.
A Schematic representation depicting the SNc and a DA neuron with a patch clamp recording electrode. ZD 7288 (ZD) was used to block HCN channels. B Representative traces of pacemaker firing recorded in the cell-attached mode in four SNc-DA neurons from Ctrl, cNurr1, WT and G2019S mice before (Pre-ZD) and during (ZD) the perfusion with ZD 7288 (50 μM). C Firing frequency of individual SNc-DA neurons before and during perfusion with ZD 7288. n = 11, 13, 10, 11 neurons from N = 5 Ctrl, 6 cNurr1, 3 WT and 4 G2019S mice. **P < 0.01, ***P < 0.001, ****P < 0.0001; Paired Student’s t-test. D Representative traces of Ih currents measured in whole-cell voltage-clamp mode at different hyperpolarizing voltage steps (bottom traces, from a holding potential of −60 mV to −130 mV with 10 mV increments, 2 s duration). Graphs show Ih amplitude at varying voltage steps measured in n = 18, 11, 34, 21 SNc-DA neurons from N = 4 Ctrl, 2 cNurr1, 8 WT and 4 G2019S mice. E Representative trace of an AHP current measured in voltage-clamp mode and evoked by a depolarizing voltage step (bottom trace, from a holding potential of −60 mV to −10 mV, 1 s duration). Red and blue lines illustrate fast and slow components of the AHP current. Graphs show slow AHP current amplitude measured in n = 24, 37, 16, 26 SNc-DA neurons from N = 9 Ctrl, 11 cNurr1, 5 WT and 8 G2019S mice. *P < 0.05; Unpaired Student’s t-test.
Fig. 4
Fig. 4. Increased contribution of L-type VGCCs in SNc-DA neurons of G2019S mice but not cNurr1 mice.
A Representative images of neurons in the SNc from double FISH experiments of CACNA1D mRNA, which encodes the Cav1.3 L-type channel, and TH mRNA; scale bars, 15 µm. Quantification of fluorescence for CACNA1D mRNA in individual TH-containing cells in the SNc. n = 186, 185, 135, 126 neurons from N = 3 Ctrl, 3 cNurr1, 3 WT and 3 G2019S mice. ####P < 0.0001; Mann–Whitney U-test. B Schematic representation depicting the SNc and a DA neuron. Isradipine (Isra) was used to block Cav1.3 L-type channels. C, D Representative traces of pacemaker firing recorded in the cell-attached mode in SNc-DA neurons from Ctrl, cNurr1, WT and G2019S mice before (Pre-Isra) and during (Isra) the perfusion with isradipine (0.2 μM) in control condition (aCSF, C), in slices incubated with the LRRK2 kinase inhibitor GSK2578215A (1 μM, D) or with kaempferol (KF, 5 μM, D). Graphs show the firing frequency of individual SNc-DA neurons before (Pre-Isra) and during (Isra) the perfusion with Isradipine. Cells recorded in aCSF: n = 8, 9, 13, 13 neurons from N = 6 Ctrl, 8 cNurr1, 4 WT and 5 G2019S mice (C). *P < 0.05; Paired Student’s t-test. Cells recorded in GSK2578215A: n = 6 and 6 neurons from N = 2 WT and 4 G2019S mice. Cells recorded in kaempferol: n = 10 and 11 neurons from N = 5 WT and 5 G2019S mice (D).
Fig. 5
Fig. 5. Reduced contribution of T-type VGCCs in SNc-DA neurons of cNurr1 mice but not G2019S mice.
A Representative images of neurons in the SNc from double FISH experiments of CACNA1G mRNA, which encodes the Cav3.1 T-type channel, and TH mRNA; scale bars, 15 µm. Quantification of fluorescence for CACNA1G mRNA in individual TH-containing cells in the SNc. n = 164, 186, 141, 144 neurons from N = 3 Ctrl, 3 cNurr1, 3 WT and 3 G2019S mice. B Schematic representation depicting the SNc and a DA neuron. NNC 55-0396 (NNC) was used to block Cav3.1 T-type channels. C, D Representative traces of pacemaker firing recorded in the cell-attached mode in SNc-DA neurons from Ctrl, cNurr1, WT and G2019S mice before (Pre-NNC) and during (NNC) the perfusion with NNC 55-0396 (10 μM) in control condition (aCSF, C), and in slices incubated with kaempferol (KF, 5 μM, D). Graphs show the firing frequency of individual SNc-DA neurons before (Pre-NNC) and during (NNC) the perfusion with NNC 55-0396. Cells recorded in aCSF: n = 10, 10, 14, 25 neurons from N = 5 Ctrl, 7 cNurr1, 5 WT and 10 G2019S mice (C). Cells recorded in kaempferol: n = 10, 10, 10, 11 neurons from N = 7 Ctrl, 5 cNurr1, 5 WT and 4 G2019S mice (D). *P < 0.05; **P < 0.01, Paired Student’s t-test. E, F Representative current-clamp recordings of the firing of SNc-DA neurons during a hyperpolarization-depolarization step protocol. Insets above the traces are magnified firing at the beginning and at the end of the positive current steps. Graphs show the spike firing adaptation (SFA) ratio calculated by dividing the interval between the last two action potentials with the interval between the first two action potentials. n = 28 and 20 neurons from N = 10 Ctrl and 8 cNurr1 mice in aCSF; n = 15 and 14 neurons from N = 7 Ctrl and 4 cNurr1 mice in kaempferol (KF, E). *P < 0.05; **P < 0.01, Two-way ANOVA followed by Multiple comparisons (Tukey). n = 19 and 20 neurons from N = 5 WT and 4 G2019S mice (F).
Fig. 6
Fig. 6. Decreased DA-D2 autoreceptor function in SNc-DA neurons of cNurr1 mice.
A Schematic representation depicting the SNc and a DA neuron. The DA-D2 receptor (D2R) agonist Quinpirole (Quin) was used in this experiment. B, C Representative current-clamp recordings of the pacemaker firing measured at resting membrane potential (dotted lines) before, during and after the perfusion with quinpirole (10 μM, 60 sec) in control slices (aCSF) and in slices incubated with kaempferol (KF, 5 μM). Graphs show the amplitude of the quinpirole-induced membrane hyperpolarization. n = 8 and 7 neurons in aCSF from N = 4 Ctrl and 3 cNurr1 mice; n = 8 and 7 neurons in kaempferol from N = 3 Ctrl and 6 cNurr1 mice (B). *P < 0.05; Two-way ANOVA followed by Multiple comparisons (Tukey). n = 7 and 7 neurons in aCSF from N = 6 WT and 5 G2019S mice (C). D, E Western blotting of D2R and NCS-1 in the ventral midbrain region containing the SNc of N = 17 Ctrl, 18 cNurr1, 16 WT and 17 G2019S mice from control conditions (aCSF) and N = 16 Ctrl and 18 cNurr1 mice from slices incubated in kaempferol (KF).
Fig. 7
Fig. 7. Unaltered role of L-type and T-type channels in the control of dopamine release from axon terminals.
A Schematic representation of the experiment. A carbon fiber electrode (CF) and a stimulating electrode (SE) were placed in the dorsolateral striatum in coronal brain slices. The experiments were performed in the presence of the nicotinic acetylcholine receptor antagonist DhβE (0.1 μM). Traces are representative amperometric recordings of dopamine release evoked by single stimulation pulses before (Baseline) and during the application of isradipine (Isra). Graphs show the average magnitude of the effect of isradipine (0.2 μM) and NNC 55-0396 (10 μM) on dopamine release evoked by single stimulation pulses. Isradipine: n = 7, 7, 6, 7 slices from N = 4 Ctrl, 4 cNurr1, 4 WT and 3 G2019S mice. NNC 55-0396: n = 6, 7, 6, 7 slices from N = 5 Ctrl, 6 cNurr1, 5 WT and 4 G2019S mice. B Traces are representative amperometric recordings of dopamine release evoked by trains of four pulses at 15 Hz. Graphs show the average peak amplitude evoked by individual pulses within 15 Hz trains, normalized to the amplitude of the peak evoked by the first pulse in the train. n = 10, 15, 6, 8 slices from N = 8 Ctrl, 12 cNurr1, 5 WT and 7 G2019S mice. *P < 0.05; Unpaired t Student’s t-test. #P < 0.05; Mann–Whitney U-test. C Average peak amplitude evoked by individual pulses within 15 Hz trains, normalized to the amplitude of the peak evoked by the first pulse in the train. In DhβE (0.1 μM): same as in (B). In isradipine (0.2 μM): n = 9, 11, 5, 8 slices from N = 5 Ctrl, 5 cNurr1, 3 WT and 4 G2019S mice. In NNC 55-0396 (10 μM): n = 8, 11, 7, 6 slices from N = 6 Ctrl, 5 cNurr1, 5 WT and 4 G2019S mice. D Traces are representative amperometric recordings of dopamine release evoked by trains of four pulses at 100 Hz and by single stimulation pulses (1p). Graphs show the average peak amplitude evoked by 100 Hz trains, normalized to the amplitude of the peak evoked by single pulses. In DhβE (0.1 μM): n = 10, 12, 8, 8 slices from N = 8 Ctrl, 10 cNurr1, 7 WT and 7 G2019S mice. In isradipine (0.2 μM): n = 9, 10, 6, 7 slices from N = 5 Ctrl, 4 cNurr1, 3 WT and 5 G2019S mice. In NNC 55-0396 (10 μM): n = 8, 10, 7, 6 slices from N = 6 Ctrl, 6 cNurr1, 5 WT and 4 G2019S mice.

References

    1. Surmeier DJ. Determinants of dopaminergic neuron loss in Parkinson’s disease. FEBS J. 2018;285:3657–3668. doi: 10.1111/febs.14607. - DOI - PMC - PubMed
    1. Swart T, Hurley MJ. Calcium channel antagonists as disease-modifying therapy for Parkinson’s disease: therapeutic rationale and current status. CNS Drugs. 2016;30:1127–1135. doi: 10.1007/s40263-016-0393-9. - DOI - PubMed
    1. Duda J, Potschke C, Liss B. Converging roles of ion channels, calcium, metabolic stress, and activity pattern of Substantia nigra dopaminergic neurons in health and Parkinson’s disease. J. Neurochem. 2016;139:156–178. doi: 10.1111/jnc.13572. - DOI - PMC - PubMed
    1. Guzman JN, Sanchez-Padilla J, Chan CS, Surmeier DJ. Robust pacemaking in substantia nigra dopaminergic neurons. J. Neurosci. 2009;29:11011–11019. doi: 10.1523/JNEUROSCI.2519-09.2009. - DOI - PMC - PubMed
    1. Surmeier DJ, Guzman JN, Sanchez-Padilla J, Schumacker PT. The role of calcium and mitochondrial oxidant stress in the loss of substantia nigra pars compacta dopaminergic neurons in Parkinson’s disease. Neuroscience. 2011;198:221–231. doi: 10.1016/j.neuroscience.2011.08.045. - DOI - PMC - PubMed

LinkOut - more resources