. 2023 Apr 7;13(1):5708.
doi: 10.1038/s41598-023-32955-0.

Automatic detection of circulating tumor cells and cancer associated fibroblasts using deep learning

Affiliations

Automatic detection of circulating tumor cells and cancer associated fibroblasts using deep learning

Cheng Shen et al. Sci Rep. .

Abstract

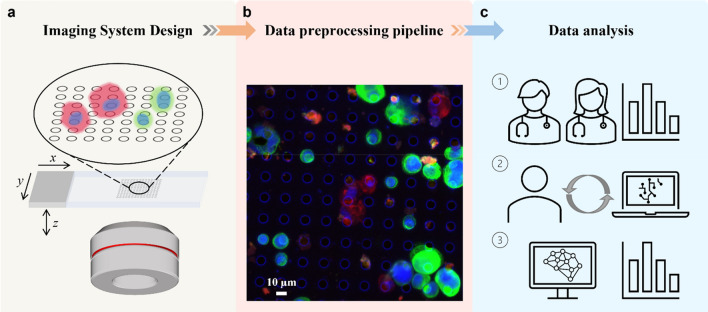
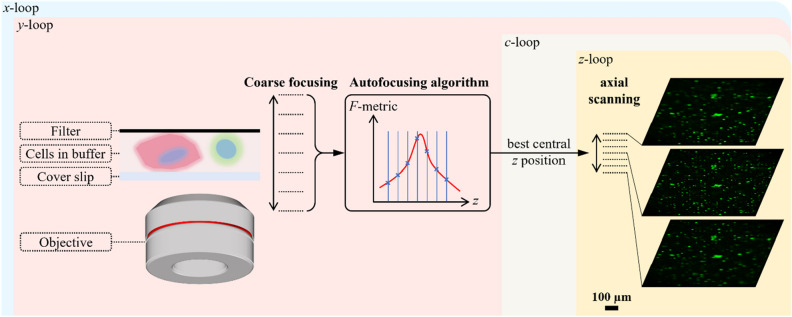
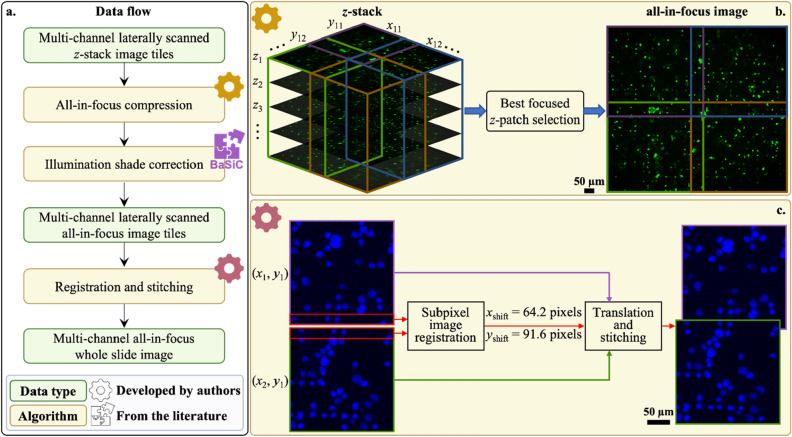
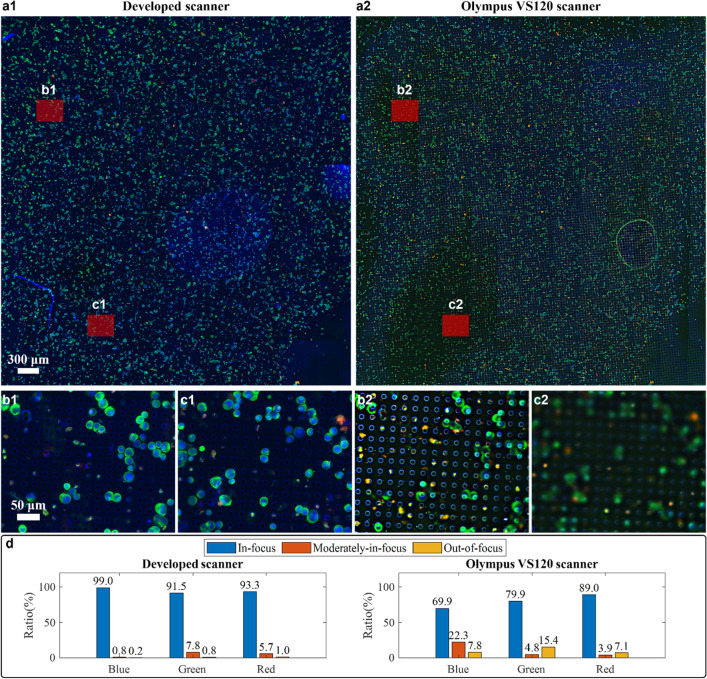
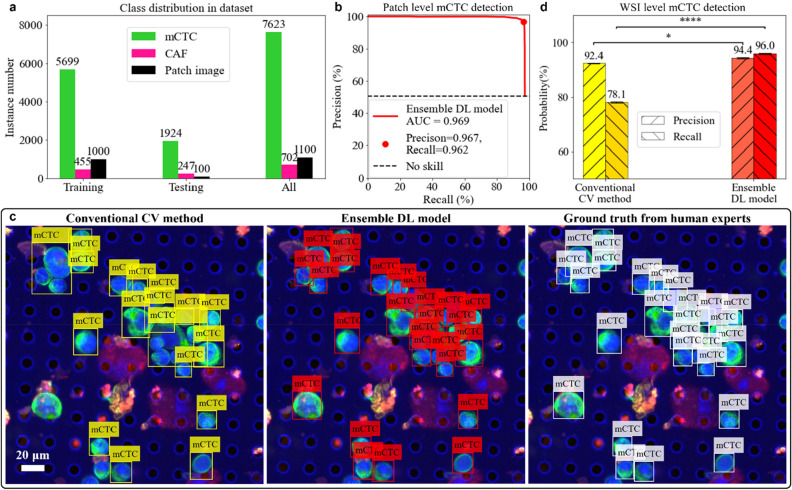
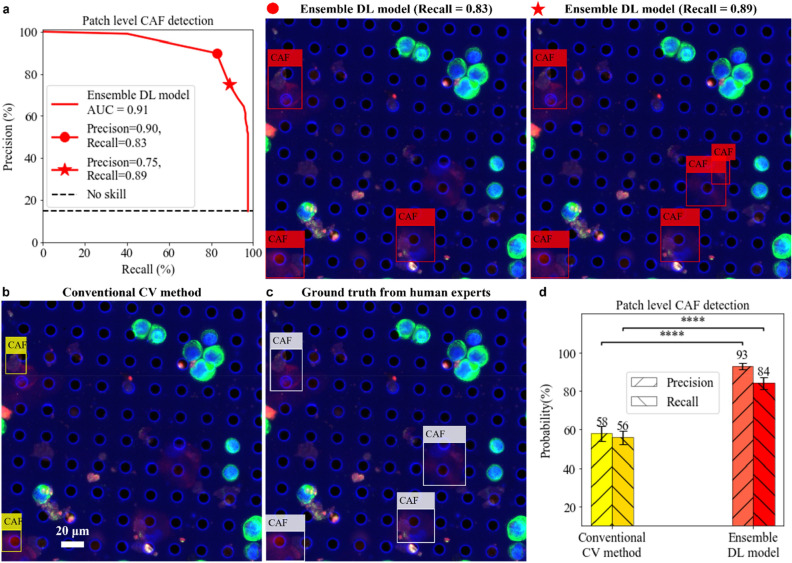
Circulating tumor cells (CTCs) and cancer-associated fibroblasts (CAFs) from whole blood are emerging as important biomarkers that potentially aid in cancer diagnosis and prognosis. The microfilter technology provides an efficient capture platform for them but is confounded by two challenges. First, uneven microfilter surfaces makes it hard for commercial scanners to obtain images with all cells in-focus. Second, current analysis is labor-intensive with long turnaround time and user-to-user variability. Here we addressed the first challenge through developing a customized imaging system and data pre-processing algorithms. Utilizing cultured cancer and CAF cells captured by microfilters, we showed that images from our custom system are 99.3% in-focus compared to 89.9% from a top-of-the-line commercial scanner. Then we developed a deep-learning-based method to automatically identify tumor cells serving to mimic CTC (mCTC) and CAFs. Our deep learning method achieved precision and recall of 94% (± 0.2%) and 96% (± 0.2%) for mCTC detection, and 93% (± 1.7%) and 84% (± 3.1%) for CAF detection, significantly better than a conventional computer vision method, whose numbers are 92% (± 0.2%) and 78% (± 0.3%) for mCTC and 58% (± 3.9%) and 56% (± 3.5%) for CAF. Our custom imaging system combined with deep learning cell identification method represents an important advance on CTC and CAF analysis.


Conflict of interest statement

R.J.C. and S.R. are co-founders and principals at Circulogix Inc. The other authors declare that there are no competing interests.

Figures

Figure 1
Figure 1
Schematic of overall design. (a) Multi-channel epifluorescence microscope imaging system. Since our target cells are distributed on the micro-filter at varied heights, the sample is three-dimensional in nature. They are scanned axially under four channels to fully capture the cell-specific biomarker expression. (b) Data preprocessing pipeline. The raw image data are synthesized into a single multi-color all-in-focus whole slide image for further analysis. (c) Data analysis. The classical way to detect CTCs and CAFs relies on human experts. ① First, the experienced pathologists review the whole slide, annotate cells of interest, and count their number. ② Then this annotation paired with fluorescence images is used to train a deep learning model. Because of inherent human observer bias in calling or ignoring positive cells, the prediction from the pre-trained deep learning model is used to cross-validate human expert annotation. ③ Finally, the well-trained deep learning model can independently conduct the cell detection and analysis task.
Figure 2
Figure 2
Auto-focusing principle during scanning. First, a coarse scanning with large step size over a wide z range is performed. Then, the image at each z position is used to calculate the focus measure (F-metric). The best focus z position is then estimated as the peak location by fitting a Gaussian function to discrete F-metrics. Centered on this estimated best focus z position, a fine axial scanning with small step size is performed to capture the whole 3D information. Autofocusing is repeated for every lateral xy scanning position and executed only in DAPI channel. The estimated best focus z position will be used across all channels. Chromatic aberration can be compensated by axial scanning.
Figure 3
Figure 3
Data preprocessing pipeline. (a) Data flow starting from raw measurement and ending with a multi-channel all-in-focus whole slide image. Preprocessing consists of three algorithms, among which two are developed by authors and the other one is adapted from an existing work. (b) Principle of all-in-focus compression. Z-stack at each xy location is split into smaller patches and the best focused z-patch is selected with focus measure. Finally, z-patches are fused into an all-in-focus xy tile. c Principle of registration and stitching. There is overlap between adjacent xy tiles due to the tilt between scanner lateral movement coordinates and camera frame coordinates. Subpixel image registration algorithm relies on the overlapping region to find the subpixel shift between two adjacent xy tiles. Taking the upper left corner tile (x1, y1) as the anchor for the final mosaic, all other xy tiles are translated and stitched to it by blending based on distance transform.
Figure 4
Figure 4
Comparison of the whole slide image focus quality by our developed scanner and Olympus VS120 scanner. (a1) Whole slide image (WSI) of a model sample under 20X objective from our developed scanner. (a2) WSI of the same model sample under 20X objective from Olympus VS120 scanner. (b1,b2) and (c1,c2) are the zoom-in on the same regions from two WSIs. Their area size is the same as the image tile from VS120 scanner, 366 μm × 287 μm. (d) Quantitative analysis of focus quality of WSI from both scanners in blue, green and red channel.
Figure 5
Figure 5
Cell detection via deep learning. (a) Training pipeline. An experienced pathologist annotates the cells of interest in training images with dots and simultaneously these images are processed by a conventional computer vision (CV) method to segment cell regions. Results from both methods are cross validated by matching annotation dots and segmentation regions. Any region containing annotation dots is used to generate a bounding box and paired with the annotation label. For dots which do not lie in any region, a bounding box centered at each of them is generated with the size of empirical cell diameter. Then, training images and their corresponding bounding boxes with class labels are used to train a generic object detection deep learning model. Here, transfer learning is adopted by using weights pretrained on the COCO benchmark dataset. (b) Testing pipeline. The unseen testing images are analyzed in three ways. First, the same experienced pathologist screens testing images by annotating the cells of interest with bounding boxes, which are sequentially double checked by another computational pathology researcher to make sure there is no oversight or mislabeling. This result is taken as ground truth. In parallel, testing images are segmented by the conventional CV method and then the prediction boxes with labels are generated from segmented regions. Finally, they are sent to our well-trained cell detection model and the predicted bounding boxes can be directly generated. Comparing results from the latter two methods with the ground truth, we find our trained deep learning model outperforms the conventional CV method.
Figure 6
Figure 6
Evaluation of mCTC detection. (a) Class distribution and the number of patches images in the training/testing/whole dataset. (b) Precision-recall curve of the ensemble deep learning (DL) model to detect mCTCs in testing patch images. The red dot represents the final chosen operating point. (c) Example of mCTC detection by conventional computer vision (CV) method and ensemble DL model shown horizontally with ground truth from human annotation. (d) Performance comparison between conventional CV method and ensemble DL model to detect mCTCs on the whole slide image level. Both precision and recall of ensemble DL model are significantly higher than the ones of conventional CV method. Statistical analysis uses the ensemble DL model result as the reference to test their difference significance, error bars show standard deviation of precisions and recalls by randomly sampling testing dataset 1000 times and the p-values are specified in the figure for *p < 0.05, **p < 0.01, ***p < 0.001, ****p < 0.0001, NS, not significant, two-sided z-test.
Figure 7
Figure 7
Evaluation of CAF detection. (a) Precision-recall curve of the ensemble deep learning (DL) model to detect CAFs in testing patch images. The red dot represents the final chosen operating point. The red star represents another operating point with higher recall but lower precision. Any possible CAF event will be caught but it requires further human analysis to exclude the false alarms. (b) CAF detection by conventional computer vision (CV) method. (c) Ground truth from human expert annotation. (d) Performance comparison between conventional CV method and ensemble DL model to detect CAFs on the patch image level. Both precision and recall of ensemble DL model are significantly higher than the ones of conventional CV method. Statistical analysis uses the ensemble DL model result as the reference to test their difference significance, error bars show standard deviation of precisions and recalls by randomly sampling testing dataset 1000 times and the p-values are specified in the figure for *p < 0.05, **p < 0.01, ***p < 0.001, ****p < 0.0001, NS not significant, two-sided z-test.

Similar articles

Cited by

References

    1. Lambert AW, Pattabiraman DR, Weinberg RA. Emerging biological principles of metastasis. Cell. 2017;168(4):670–691. doi: 10.1016/j.cell.2016.11.037. - DOI - PMC - PubMed
    1. Taftaf R, Liu X, Singh S, Jia Y, Dashzeveg NK, Hoffmann AD, El-Shennawy L, et al. ICAM1 initiates CTC cluster formation and trans-endothelial migration in lung metastasis of breast cancer. Nat. Commun. 2021;12(1):1–15. doi: 10.1038/s41467-021-25189-z. - DOI - PMC - PubMed
    1. Plaks V, Koopman CD, Werb Z. Circulating tumor cells. Science. 2013;341(6151):1186–1188. doi: 10.1126/science.1235226. - DOI - PMC - PubMed
    1. Williams SCP. Circulating tumor cells. Proc. Natl. Acad. Sci. 2013;110(13):4861–4861. doi: 10.1073/pnas.1304186110. - DOI - PMC - PubMed
    1. Potdar PD, Lotey NK. Role of circulating tumor cells in future diagnosis and therapy of cancer. J. Cancer Metastasis Treatm. 2015;1:44–56. doi: 10.4103/2394-4722.158803. - DOI

Publication types