. 2023 Jun;30(6):1503-1516.
doi: 10.1038/s41418-023-01152-x. Epub 2023 Apr 7.

Developmental growth plate cartilage formation suppressed by artificial light at night via inhibiting BMAL1-driven collagen hydroxylation

Affiliations

Developmental growth plate cartilage formation suppressed by artificial light at night via inhibiting BMAL1-driven collagen hydroxylation

Guangjin Chen et al. Cell Death Differ. 2023 Jun.

Abstract

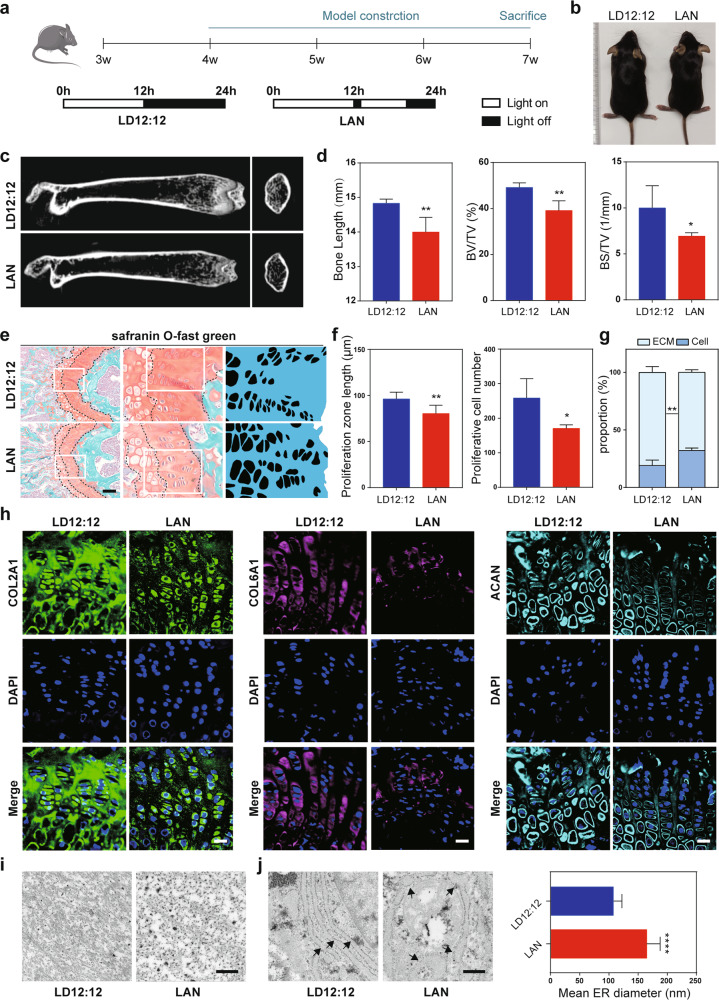
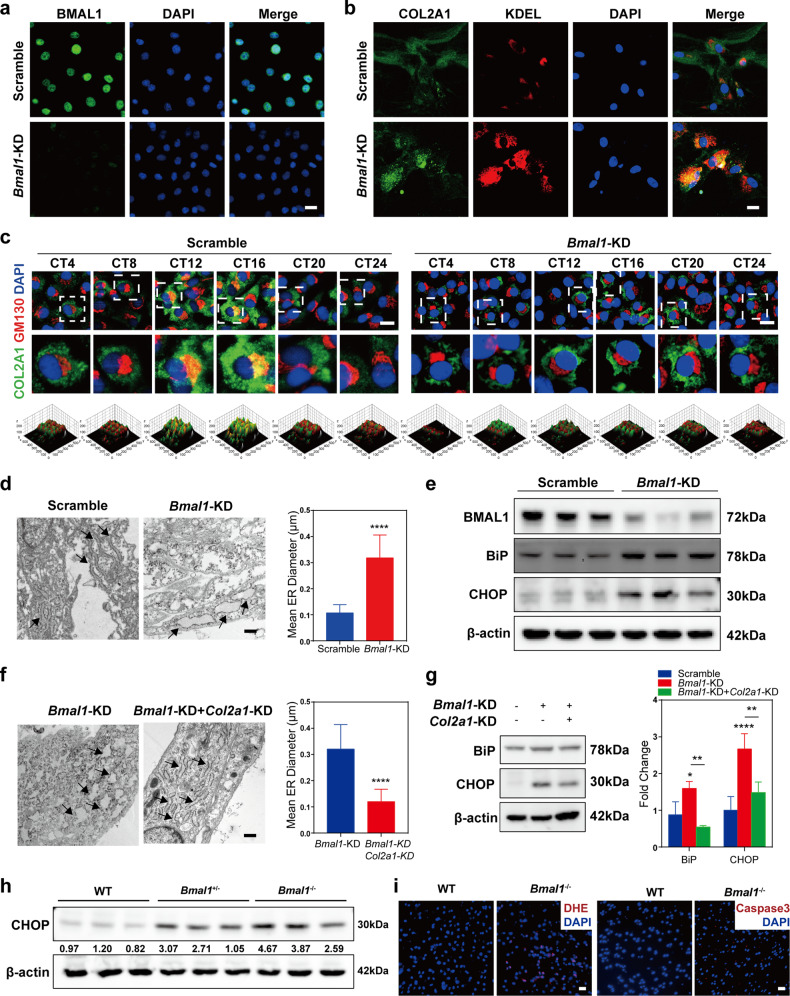
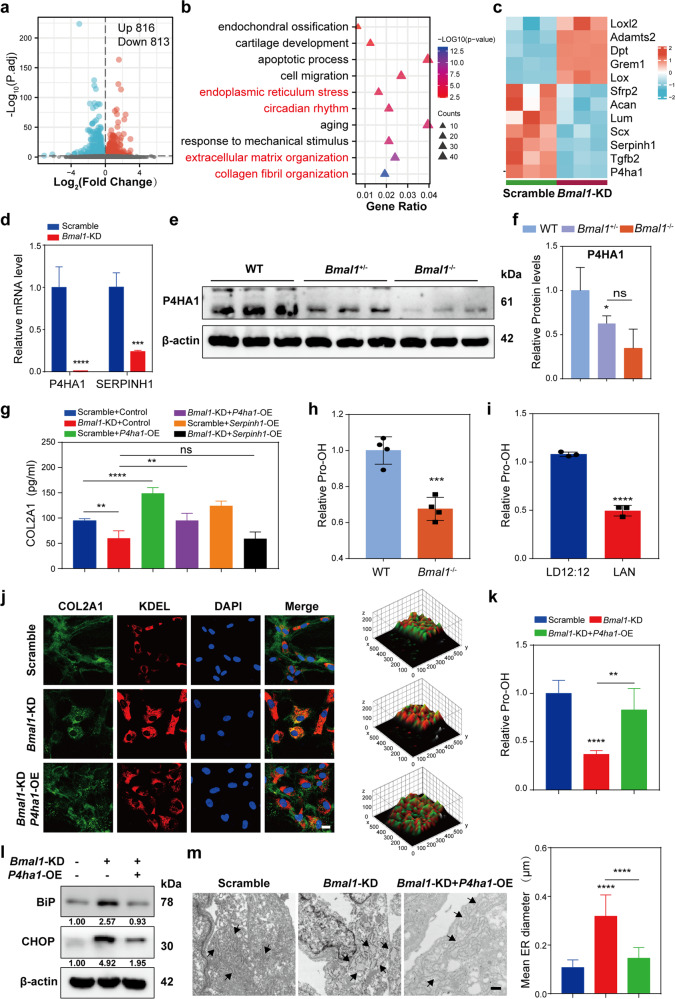
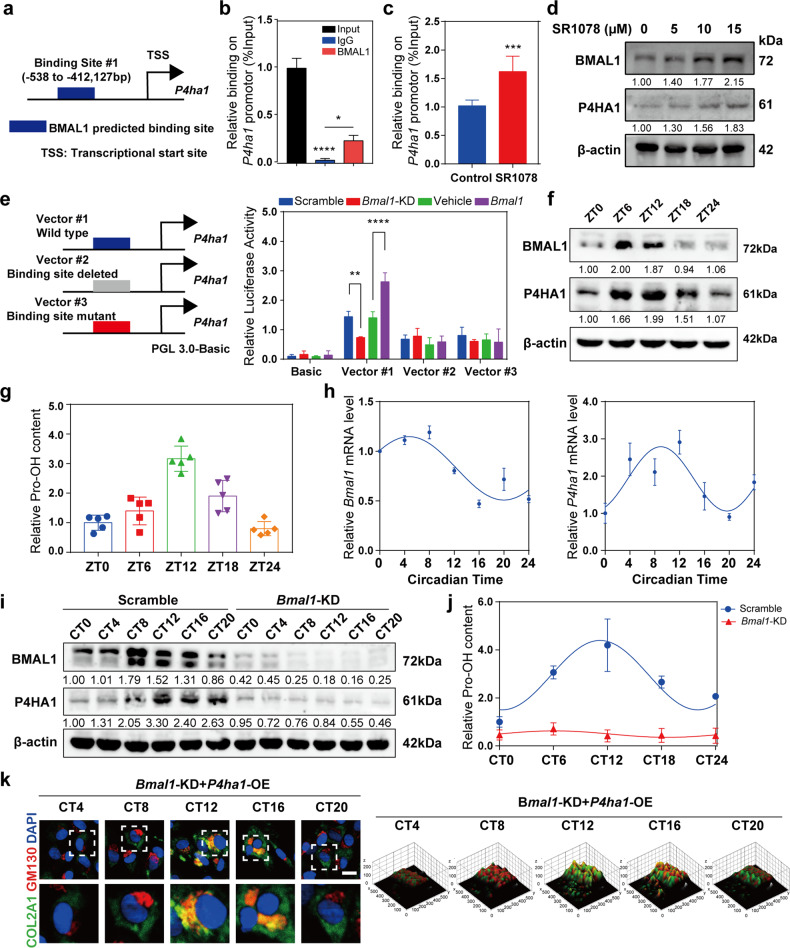
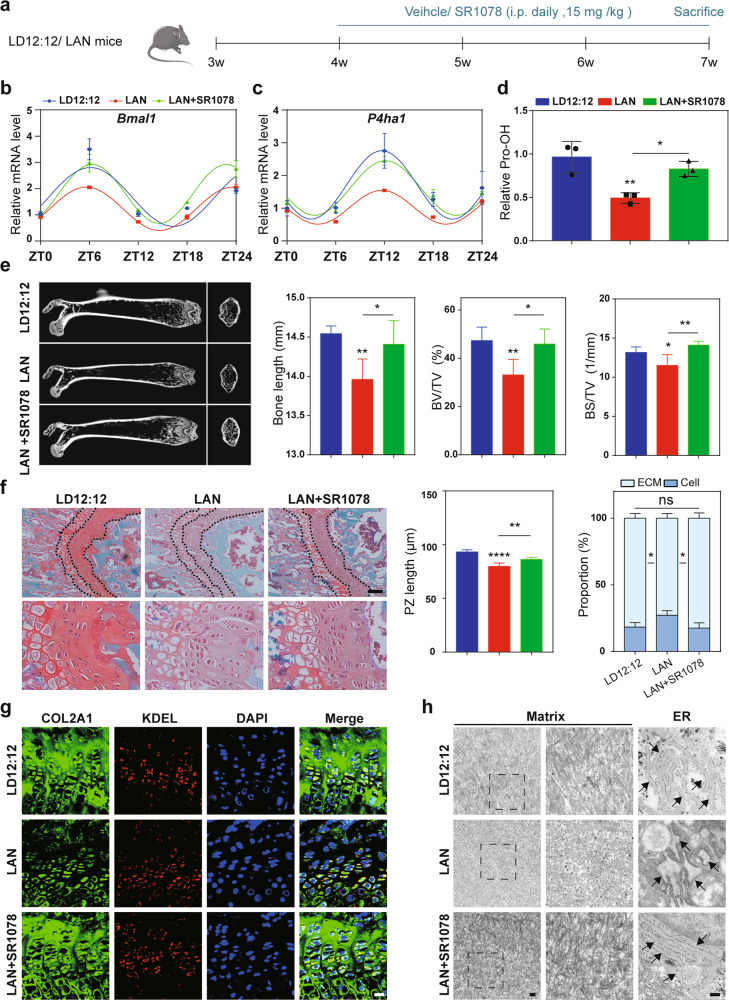
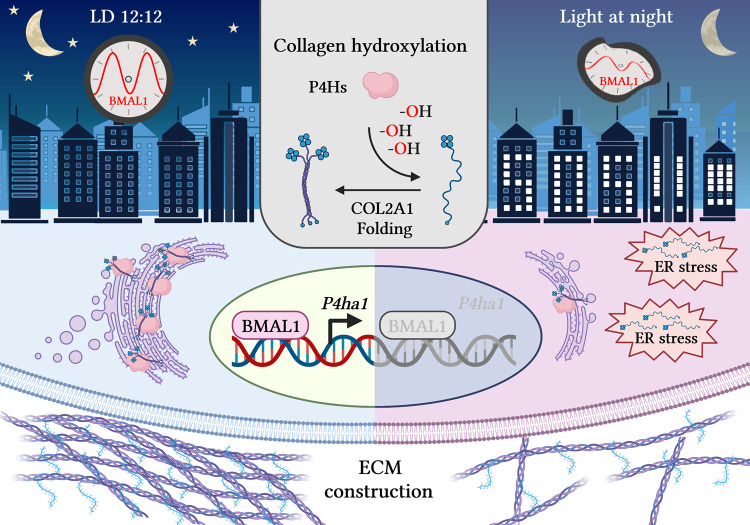
Exposure to artificial light at night (LAN) can induce obesity, depressive disorder and osteoporosis, but the pernicious effects of excessive LAN exposure on tissue structure are poorly understood. Here, we demonstrated that artificial LAN can impair developmental growth plate cartilage extracellular matrix (ECM) formation and cause endoplasmic reticulum (ER) dilation, which in turn compromises bone formation. Excessive LAN exposure induces downregulation of the core circadian clock protein BMAL1, which leads to collagen accumulation in the ER. Further investigations suggest that BMAL1 is the direct transcriptional activator of prolyl 4-hydroxylase subunit alpha 1 (P4ha1) in chondrocytes, which orchestrates collagen prolyl hydroxylation and secretion. BMAL1 downregulation induced by LAN markedly inhibits proline hydroxylation and transport of collagen from ER to golgi, thereby inducing ER stress in chondrocytes. Restoration of BMAL1/P4HA1 signaling can effectively rescue the dysregulation of cartilage formation within the developmental growth plate induced by artificial LAN exposure. In summary, our investigations suggested that LAN is a significant risk factor in bone growth and development, and a proposed novel strategy targeting enhancement of BMAL1-mediated collagen hydroxylation could be a potential therapeutic approach to facilitate bone growth.


Conflict of interest statement

The authors declare no competing interests.

Figures

Fig. 1
Fig. 1. LAN inhibits growth plate cartilage ECM formation and causes ER dilation.
a Schematic illustration of the experimental protocol. b Representative images of LD12:12 and LAN-exposure mice. c Representative Micro-CT images of distal femurs from 7-week-old LD12:12 and LAN-exposure mice. d Quantitative skeletal parameters of femurs from LD12:12 and LAN-exposure mice, including bone length, bone volume per tissue volume (BV/TV) and bone surface per tissue volume (BS/TV), showing the variation of endochondral ossification. (n = 5 per group). *P < 0.05, **P < 0.01. eg Representative Safranin O staining shows the morphology of distal femur growth plate cartilage and quantitative analysis of proliferative zone length, cell number and ECM proportion in LD12:12 and LAN mice. *P < 0.05, **P < 0.01. Scale bars, 100 μm. The black area indicates the chondrocytes and the blue area indicates the cartilage ECM. h Immunofluorescent staining of COL2A1, COL6A1 and ACAN in femur growth plates from LD12:12 and LAN mice, respectively. Scale bars, 20 μm. i, j Representative TEM images of growth plate cartilage ECM and rough ER within chondrocytes and quantification of ER diameter from LD12:12 and LAN-exposure mice. ****P < 0.0001. Black arrows indicate the rough ER. In LAN-exposure mice, the rough ER was dilated abnormally. Scale bars, 500 nm.
Fig. 2
Fig. 2. Bmal1 knockout suppresses cartilage ECM formation and elicits ER dilation.
a Relative mRNA expression of Bmal1, Clock, Per1 and Cry2 in LD12:12 and LAN mice (n = 3 per group). *P < 0.05, ***P < 0.001, ****P < 0.0001, ns, not significant. b Immunohistochemistry staining of BMAL1 in growth plate cartilage of distal femur. Scale bars, 100 μm. ce Representative Safranin O staining images of distal femur growth plate cartilage and quantitative analysis of proliferative zone lengths, proliferative chondrocyte numbers and ECM proportions in WT, Bmal1+/− and Bmal1−/− mice (n = 5 per group). Scale bars, 100 μm. fh Representative Safranin O staining images of femur growth plate cartilage and quantitative analysis of proliferative zone lengths, proliferative chondrocyte numbers and ECM proportions in Bmal1fl/fl and Twist2-Cre Bmal1fl/fl mice. *P < 0.05, **P < 0.01, ***P < 0.001. Scale bars, 100 μm. i Immunofluorescence images of COL2A1 and KDEL within the proliferative zone of growth plate cartilage from WT and Bmal1−/− mice. j Immunofluorescence images of COL2A1 and KDEL within the proliferative zone in the femur of Bmal1fl/fl and Twist2-Cre Bmal1fl/fl mice. Scale bars, 20 μm. k Colocalization analysis of COL2A1 and KDEL by pearson’s correlation in WT and Bmal1−/− mice. **P < 0.01. l Colocalization analysis of COL2A1 and KDEL by pearson’s correlation in Bmal1fl/fl and Twist2-Cre Bmal1fl/fl mice. m Representative TEM images of growth plate ECM of wild type and Bmal1−/− mice. Scale bars, 500 nm. n Representative TEM images of rough ER within proliferative chondrocytes from wild type and Bmal1−/− mice. Black arrows indicate the rough ER. In Bmal1−/− mice, the rough ER was dilated abnormally. Scale bars, 500 nm. o Quantitative analysis of ER diameter from wild type and Bmal1−/− mice. ****P < 0.0001. p Representative TEM images of growth plate ECM of Bmal1fl/fl and Twist2-Cre Bmal1fl/fl mice. Scale bars, 500 nm. q Representative TEM images of rough ER within proliferative chondrocytes from Bmal1fl/fl Bmal1fl/fl Twist2-Cre mice. Black arrows indicate the rough ER. In Bmal1fl/fl Twist2-Cre mice, the rough ER was dilated abnormally. Scale bars, 500 nm. r Quantitative analysis of ER diameters from Bmal1fl/fl and Twist2-Cre Bmal1fl/fl mice. ****P < 0.0001.
Fig. 3
Fig. 3. BMAL1 deficiency inhibits collagen secretion and contributes to ER stress in vitro.
a Validation of Bmal1 knockdown using anti-BMAL1 antibody. (Green: BMAL1; blue: DAPI; Scale bar, 20 μm). b Immunofluorescence analysis of COL2A1 and KDEL in scramble and Bmal1-KD chondrocytes, respectively. (Green: COL2A1; red: KDEL; blue: DAPI; Scale bar, 20 μm). c Time-series immunofluorescence analysis of COL2A1 and GM130 in synchronized scramble and Bmal1-KD chondrocytes, respectively. (Green: COL2A1; red: GM130; blue: DAPI; Scale bar: 20 μm). Bottom: 3D surface plots of the immunofluorescent images. d Representative TEM images of ER and quantitative analysis of ER diameters in scramble and Bmal1-KD chondrocytes. Black arrows indicate the rough ER. Right: Quantitative analysis of mean ER diameters. ****P < 0.0001. Scale bar, 500 nm. e Protein levels of ER stress markers, including BiP and CHOP in scramble and Bmal1-KD chondrocytes. f Representative TEM images of ER and quantitative analysis of ER diameters in Bmal1-KD and Bmal1, Col2a1 double-knockdown chondrocytes. Black arrows indicate the rough ER. Right: Quantitative analysis of mean ER diameters. ****P < 0.0001. Scale bar, 500 nm. g Protein levels of BiP and CHOP in chondrocytes with Bmal1 and Col2a1 double-knockdown. *P < 0.05, **P < 0.01, ****P < 0.0001. h Western blot showed the CHOP expression in WT, Bmal1+/− and Bmal1−/− mice. i Representative immunofluorescence images of DHE and Caspase-3 in WT and Bmal1−/− mice. Scale bar, 20 μm.
Fig. 4
Fig. 4. Impaired COL2A1 hydroxylation in BMAL1 deficient chondrocytes triggers ER stress in a P4HA1-dependent manner.
a Volcano plot showed the DEGs between scramble and Bmal1-KD chondrocytes (P < 0.01). b Gene ontology (GO) enrichment analysis of those DEGs in sequence data of scramble and Bmal1-KD chondrocytes. c Heatmap showing the DEGs of collagen fibril organization. d Relative mRNA analysis of P4ha1, Serpinh1 by qRT-PCR in scramble and Bmal1-KD chondrocytes. ***P < 0.001, ****P < 0.0001. e, f Protein expression levels of P4HA1 in WT, Bmal1+/− and Bmal1−/− mice. *P < 0.05. g Quantitative analysis of COL2A1 content in supernatants of Bmal1-KD chondrocytes with P4HA1 or SERPINH1 upregulation. **P < 0.01, ****P < 0.0001. h Hydroxyproline content analysis of WT and Bmal1−/− mice (n = 3 per group). i Hydroxyproline content analysis of LD12:12 and LAN mice (n = 3 per group). j Immunofluorescence analysis of COL2A1 and KDEL expression in Bmal1-KD chondrocytes with or without P4ha1 overexpression. Scale bar, 20 μm. Right: 3D surface plots of the immunofluorescent images. k Hydroxyproline content analysis of scramble and Bmal1-KD chondrocytes with or without P4ha1 overexpression. l Protein expression levels of BiP and CHOP in Bmal1-KD chondrocytes with or without P4ha1 overexpression. m Representative TEM images of rough ER and quantitative analysis of ER diameters in Bmal1-KD chondrocytes with P4ha1 overexpression. Scale bar, 500 nm.
Fig. 5
Fig. 5. Transcriptional regulation by BMAL1 induces rhythmic expression of P4HA1 in chondrocytes.
a Schematic representation of P4ha1 promotor and predicted BMAL1 binding site. b ChIP-qPCR analysis of the interaction between BMAL1 and P4ha1 promotor. c ChIP-qPCR analysis of the interaction between BMAL1 and P4ha1 promotor after SR1078 administration. ***P < 0.001. d Protein fold change analysis of BMAL1 and P4HA1 expression in chondrocytes treated with SR1078. e Dual-luciferase analysis of BMAL1 promoting P4ha1 transcription. f Protein levels of BMAL1 and P4HA1 within the growth plates of 7-week-old LD12:12 mice. g Hydroxyproline content analysis of the growth plates in 7-week-old LD12:12 mice over a 24-h period. h qRT-PCR analysis of the relative expression of P4ha1 and Bmal1 over a 24-h period in primary chondrocytes after synchronization. i Protein levels of BMAL1 and P4HA1 in scramble and Bmal1 deficient chondrocytes over a 24-h period. j Hydroxyproline content analysis of scramble and Bmal1-KD chondrocytes over a 24-h period after synchronization. k Time-series immunofluorescence analysis of COL2A1 and GM130 in synchronized Bmal1-KD mice with P4ha1 upregulated chondrocytes. (Green: COL2A1; red: GM130; blue: DAPI; Scale bar: 20 μm). Down direction: 3D surface plots of the immunofluorescent images.
Fig. 6
Fig. 6. Restoration of BMAL1 expression reverses LAN-induced dysregulation of growth plate cartilage formation.
a Schematic illustration of the experimental protocol. b, c qRT-PCR analysis of the relative expression of P4ha1 and Bmal1 over a 24-h period within the growth plates of 7-week-old LD12:12 and LAN-exposure mice, with or without SR1078 administration (n = 5 per group). d Hydroxyproline content analysis of growth plate cartilage in LD12:12, LAN and LAN-exposure mice treated with SR1078. *P < 0.05, **P < 0.01. e Micro-CT and quantitative skeletal parameters of femur in LD12:12 and LAN-exposure mice with or without SR1078 administration. f Safranin O staining of femur growth plate cartilage and quantitative analysis of proliferative zone length and ECM proportion in LD12:12 and LAN-exposure mice with or without SR1078 administration. *P < 0.05. g Immunofluorescence analysis of COL2A1 AND KDEL in the femur of LD12:12 and LAN-exposure mice, with or without SR1078 administration. Scale bar: 20 μm. h Representative TEM images of cartilage ECM and rough ER within proliferative chondrocytes of LD12:12 and LAN-exposure mice, with or without SR1078 administration. Black arrows indicate the rough ER.
Fig. 7
Fig. 7. Schematic illustration of the mechanism via which LAN inhibits cartilage ECM formation.
BMAL1 downregulation induced by LAN markedly inhibits P4ha1 transcription in chondrocytes. Less P4HA1 caused insufficient collagen prolyl hydroxylation, leading to ER stress and inhibition of COL2A1 secretion. Thus, cartilage ECM formation within the growth plate was suppressed by artificial LAN exposure (Created with BioRender.com).

References

    1. Falchi F, Cinzano P, Duriscoe D, Kyba CC, Elvidge CD, Baugh K, et al. The new world atlas of artificial night sky brightness. Sci Adv. 2016;2:e1600377. doi: 10.1126/sciadv.1600377. - DOI - PMC - PubMed
    1. Münzel T, Hahad O, Daiber A. The dark side of nocturnal light pollution. Outdoor light at night increases risk of coronary heart disease. Eur Heart J. 2021;42:831–4. doi: 10.1093/eurheartj/ehaa866. - DOI - PMC - PubMed
    1. Navara KJ, Nelson RJ. The dark side of light at night: physiological, epidemiological, and ecological consequences. J Pineal Res. 2007;43:215–24. doi: 10.1111/j.1600-079X.2007.00473.x. - DOI - PubMed
    1. An K, Zhao H, Miao Y, Xu Q, Li YF, Ma YQ, et al. A circadian rhythm-gated subcortical pathway for nighttime-light-induced depressive-like behaviors in mice. Nat Neurosci. 2020;23:869–80. doi: 10.1038/s41593-020-0640-8. - DOI - PubMed
    1. Mason IC, Grimaldi D, Reid KJ, Warlick CD, Malkani RG, Abbott SM, et al. Light exposure during sleep impairs cardiometabolic function. Proc Natl Acad Sci USA. 2022;119:e2113290119. doi: 10.1073/pnas.2113290119. - DOI - PMC - PubMed

Publication types

MeSH terms