. 2023 Apr 4;40(4):msad081.
doi: 10.1093/molbev/msad081.

Hydrophobicity-Driven Increases in Editing in Mitochondrial mRNAs during the Evolution of Kinetoplastids

Affiliations

Hydrophobicity-Driven Increases in Editing in Mitochondrial mRNAs during the Evolution of Kinetoplastids

Fanny Rusman et al. Mol Biol Evol. .

Abstract

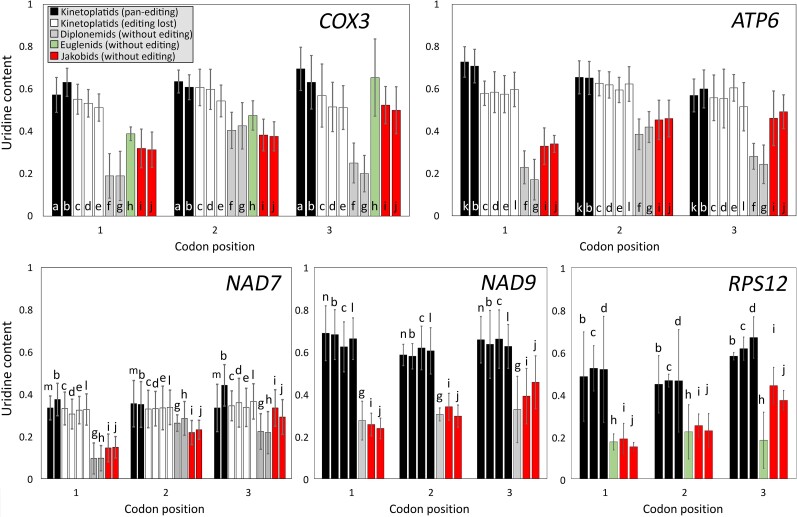
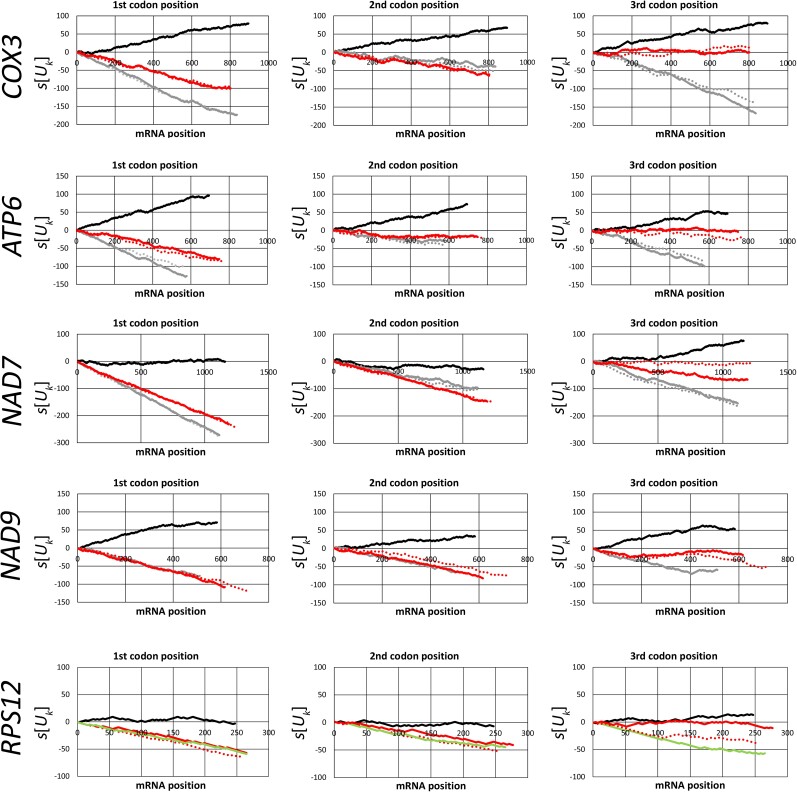
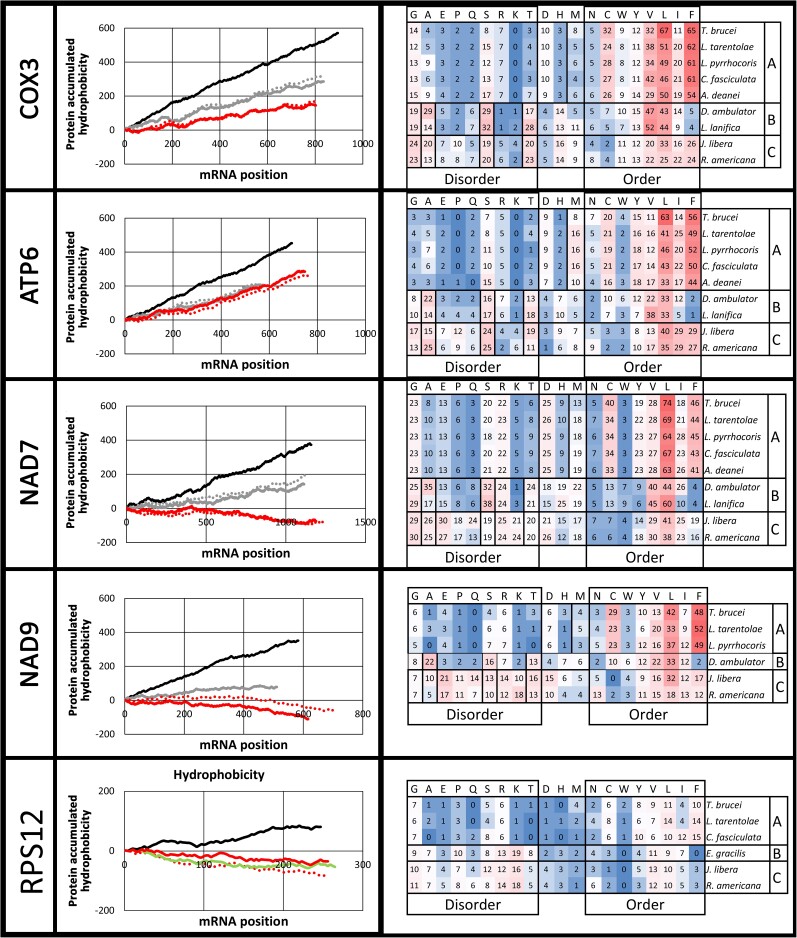
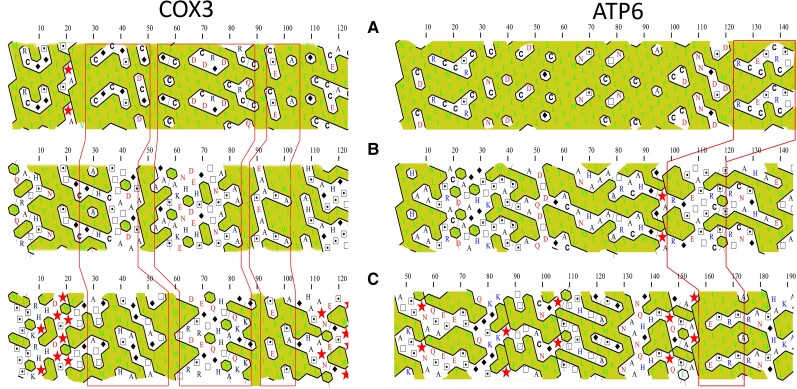
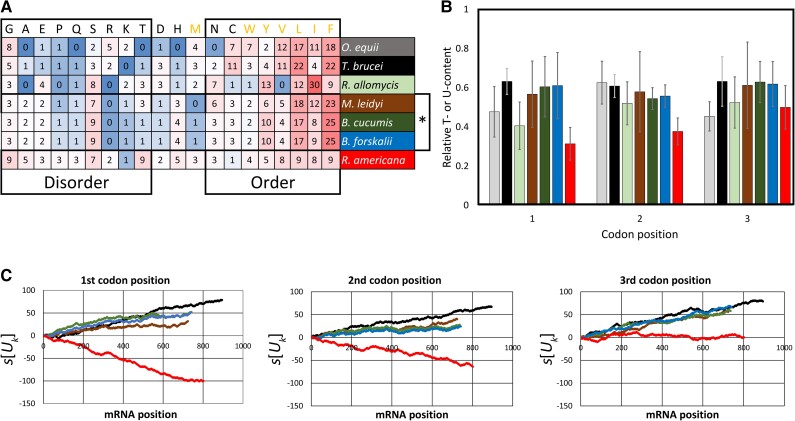
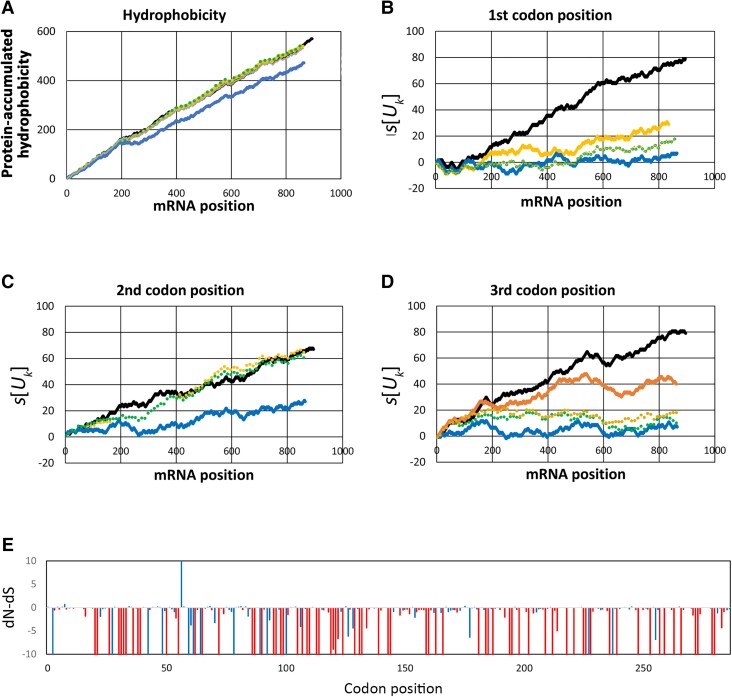
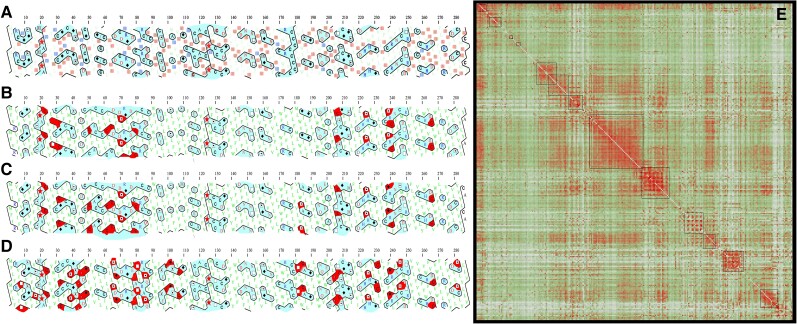
Kinetoplastids are a diverse group of flagellates which exhibit editing by insertion/deletion of Us in the mitochondrial mRNAs. Some mRNAs require editing to build most of their coding sequences, a process known as pan-editing. Evidence suggests that pan-editing is an ancestral feature in kinetoplastids. Here, we investigate how the transition from nonedited to pan-edited states occurred. The mitochondrial mRNAs and protein sequences from nine kinetoplastids and related groups (diplonemids, euglenids, and jakobids) were analyzed. RNA editing increased protein hydrophobicity to extreme values by introducing Us in the second codon position, despite the absence of editing preferences related to codon position. In addition, hydrophobicity was maintained by purifying selection in species that lost editing by retroposition of the fully edited mRNA. Only a few hydrophobic to hydrophilic amino acid changes were inferred for such species. In the protein secondary structure, these changes occurred spatially close to other hydrophilic residues. The analysis of coevolving sites showed that multiple changes are required together for hydrophobicity to be lost, which suggest the proteins are locked into extended hydrophobicity. Finally, an analysis of the NAD7 protein-protein interactions showed they can also influence hydrophobicity increase in the protein and where editing can occur in the mRNA. In conclusion, our results suggest that protein hydrophobicity has influenced editing site selection and how editing expanded in mRNAs. In effect, the hydrophobicity increase was entrenched by a neutral ratchet moved by a mutational pressure to introduce Us, thus helping to explain both RNA editing increase and, possibly, persistence.

Keywords: RNA editing; hydrophobic ratchet; kinetoplastids; pan-editing.


Figures

<sc>Fig.</sc> 1.
Fig. 1.
U content at different codon positions for five pan-edited genes in kinetoplastids and their homologs in diplonemids, euglenids, and jakobids. The U content at each codon position is calculated as the proportion of sites in that position that contain U nucleotides. Black bars indicate kinetoplastid species with pan-editing for the gene; white bars indicate kinetoplastid species with no or partial editing; gray bars indicate diplonemid species; green bars indicate euglenids and red bars indicate jakobid species. a, Herpetomonas muscarum; b, T. brucei; c, L. tarentolae; d, C. fasciculata; e, A. deanei; f, D. ambulator; g, Lacrimia lanifica; h, E. gracilis; i, J. libera; j, R. americana; k, Trypanosoma cruzi; l, L. pyrrhocoris; m, Bodo saltans; n, Trypanosoma vivax.
<sc>Fig.</sc> 2.
Fig. 2.
U walk at different codon positions for pan-edited mRNAs in T. brucei and mRNAs in diplonemids, euglenids, and jakobids. The s[Uk] value increases one unit every time that a U is at the k mRNA position in a certain codon position (first, second, or third), and it decreases the same value when there is another base. A positive slope in a region of the line indicates there are more Us than other bases, whereas a negative one indicates the opposite. Regions with parallel lines indicate similar U content between species. Black line, T. brucei; solid red line, J. libera; dotted red line, R. americana; solid gray line, D. ambulator; dotted gray line, Lacrimia lanifica; green line, E. gracilis.
<sc>Fig.</sc> 3.
Fig. 3.
Changes in hydrophobicity and frequency of order- and disorder-promoting amino acids. (Left) Cumulative Kyte–Doolittle index of hydrophobicity (Kyte and Doolittle 1982) along the protein according to the mRNA position for pan-edited genes in T. brucei (black line) and their nonedited homologs in diplonemids (gray lines) and jakobids (red lines). Solid gray line, D. ambulator; dotted gray line, Lacrimia lanifica; solid red line, J. libera; dotted red line, R. americana. (Right) Order-/disorder-promoting amino acids composition for the different proteins. Colors indicate the frequency of such amino acids on a scale of 0 (blue) to the median (white) to the maximum value (red). A, kinetoplastids; B, diplonemids; C, jakobids.
<sc>Fig.</sc> 4.
Fig. 4.
Reduced hydrophilic regions in T. brucei cytochrome c oxidase subunit 3 (COX3) and ATP synthase subunit 6 (ATP6) estimated by HCA. A, kinetoplastid (T. brucei); B, diplonemids (D. ambulator); C, jakobids (left, J. libera; right, R. americana). The primary amino acid sequence is two-dimensionally written on a duplicated alpha-helical net displaying adjacent amino acids that might be near each other if they were found in an alpha-helix. Only N-terminal fragments for COX3 and ATP6 are shown. Hydrophobic amino acids are shown in green. The hydrophobic clusters are delimited with black lines and colored (yellow). Special symbols are used for other amino acids: stars for prolines, squares, and dotted squares for threonines and serines and diamonds for glycines. Blue letters represent basic amino acids (R, K, and H); red letters indicate the acidic amino acids (D and E) and their uncharged counterparts (Q and N). Regions delimited by red lines indicate regions with potential homology (based on acidic or basic amino acid composition).
<sc>Fig.</sc> 5.
Fig. 5.
Eukaryotes with the highest frequency of order promoting and hydrophobic amino acids compared with T. brucei. (A) Amino acid composition of COX3 for the top-ranked species with the highest content of hydrophobic amino acids (yellow letters) compared with R. americana (jakobid). Asterisk indicates ctenophores. The analyzed species were Oxyuris equi (nematode), Rozella allomycis (fungi), Mnemiopsis leidyi (ctenophora), Beroe cucumis (ctenophora), and Beroe forskalii (ctenophora). (B) T or U content for different codon positions (same color references as in A). (C) U walks for COX3 in ctenophores show a similar pattern to T. brucei (black line) and different to R. americana (red).
<sc>Fig.</sc> 6.
Fig. 6.
Purifying selection conserved hydrophobicity and U content at the second codon position after losing mRNA editing in COX3. (A) Cumulative hydrophobicity index based on the Kyte–Doolittle index of hydrophobicity. Black, T. brucei; solid orange, L. tarentolae; dotted orange, Leptomonas pyrrhocoris; dotted green, C. fasciculata; solid blue, A. deanei. (B–D) U walk for different codon positions. (E) dN − dS value for each codon position. Values higher than 10 or lower than −10 were cut at such values. Red bars, P < 0.05 according to FEL method; blue bars, nonsignificant sites. Values below 0 and with P < 0.05 indicate sites under purifying selection.
<sc>Fig.</sc> 7.
Fig. 7.
Restricted hydrophobicity loss in COX3 after losing pan-editing. (A) HCA for T. brucei. Light blue regions represent hydrophilic clusters, whereas pink squares highlight amino acids under purifying selection (P < 0.05), and blue squares indicate amino acids that show substitutions by hydrophobic ones in other kinetoplastids that have lost editing in COX3. (B) HCA for L. tarentolae highlighting in red hydrophilic amino acid positions that are hydrophobic in T. brucei. (C) HCA for C. fasciculata. (D) HCA for A. deanei. (E) Heatmap showing COX3 correlation of evolutionary changes between different amino acids by using Coeviz2. The scale goes from green = 0 (low correlation) to red = 1 (high correlation). Red squares on the diagonal of the heatmap are expected for local coevolution of the amino acids.

Similar articles

Cited by

References

    1. Aphasizheva I, Maslov DA, Aphasizhev R. 2013. Kinetoplast DNA-encoded ribosomal protein S12: a possible functional link between mitochondrial RNA editing and translation in Trypanosoma brucei. RNA Biol. 10:1679–1688. - PMC - PubMed
    1. Baek M, DiMaio F, Anishchenko I, Dauparas J, Ovchinnikov S, Lee GR, Wang J, Cong Q, Kinch LN, Schaeffer RD, et al. . 2021. Accurate prediction of protein structures and interactions using a three-track neural network. Science (1979) 373:871–876. - PMC - PubMed
    1. Benne R, van den Burg J, Brakenhoff JP, Sloof P, van Boom JH, Tromp MC. 1986. Major transcript of the frameshifted coxII gene from trypanosome mitochondria contains four nucleotides that are not encoded in the DNA. Cell 46:819–826. - PubMed
    1. Berger JA, Mitra SK, Carli M, Neri A. 2004. Visualization and analysis of DNA sequences using DNA walks. J Franklin Inst. 341:37–53.
    1. Bitard-Feildel T, Lamiable A, Mornon JP, Callebaut I. 2018. Order in disorder as observed by the “hydrophobic cluster analysis” of protein sequences. Proteomics. 18:e1800054. - PMC - PubMed

Publication types