. 2023 Sep 14;14(9):683-697.
doi: 10.1093/procel/pwad009.

METTL14 is a chromatin regulator independent of its RNA N6-methyladenosine methyltransferase activity

Affiliations

METTL14 is a chromatin regulator independent of its RNA N6-methyladenosine methyltransferase activity

Xiaoyang Dou et al. Protein Cell. .

Abstract

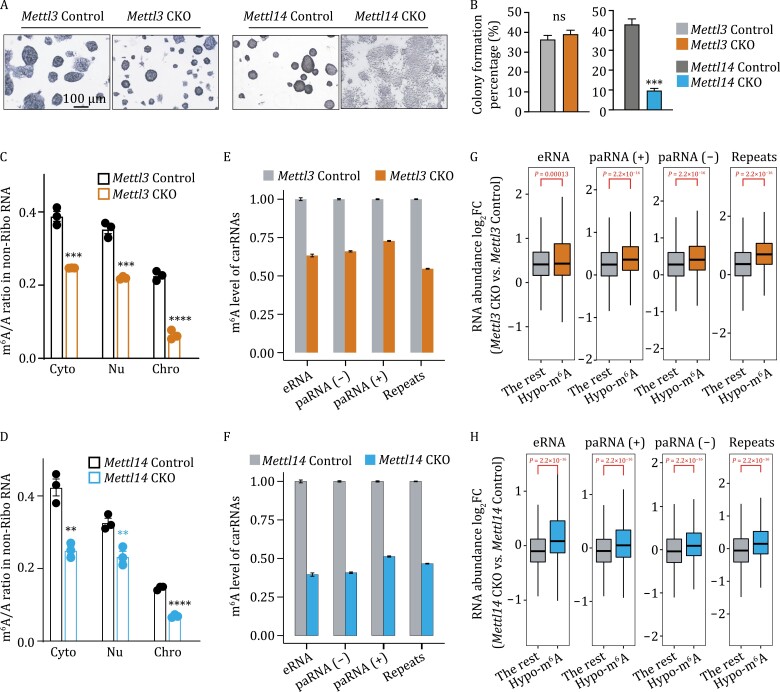
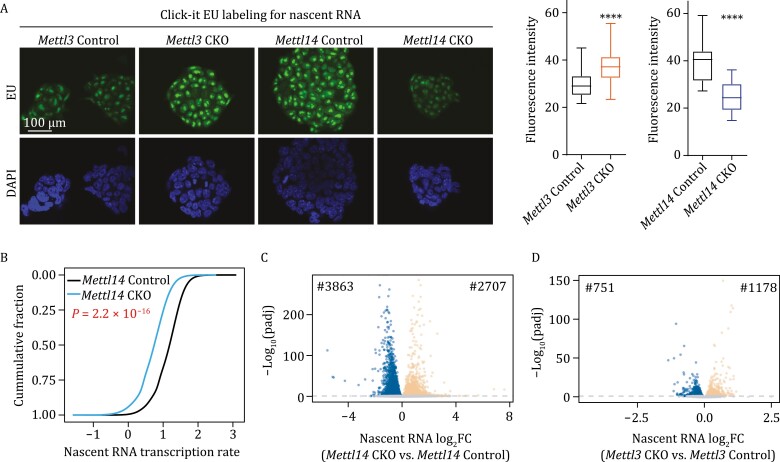
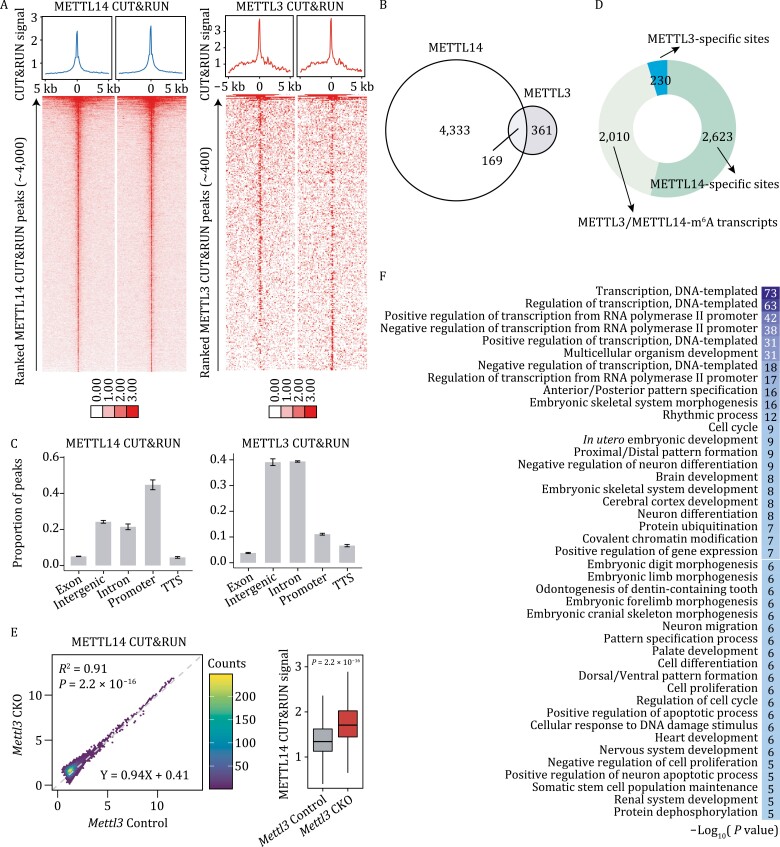
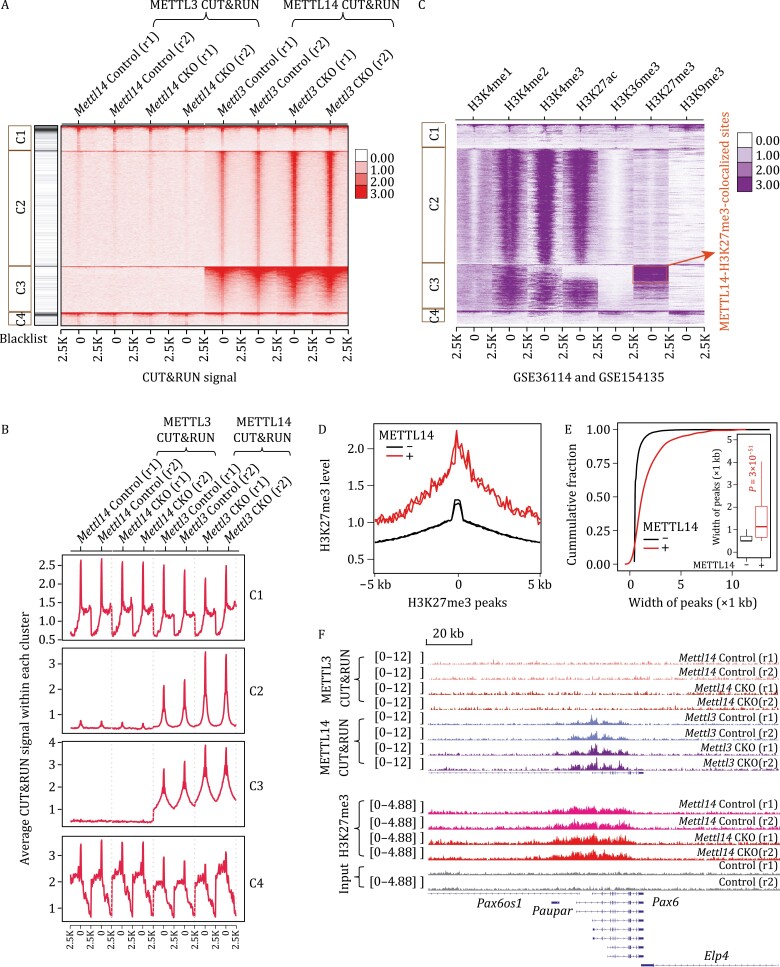
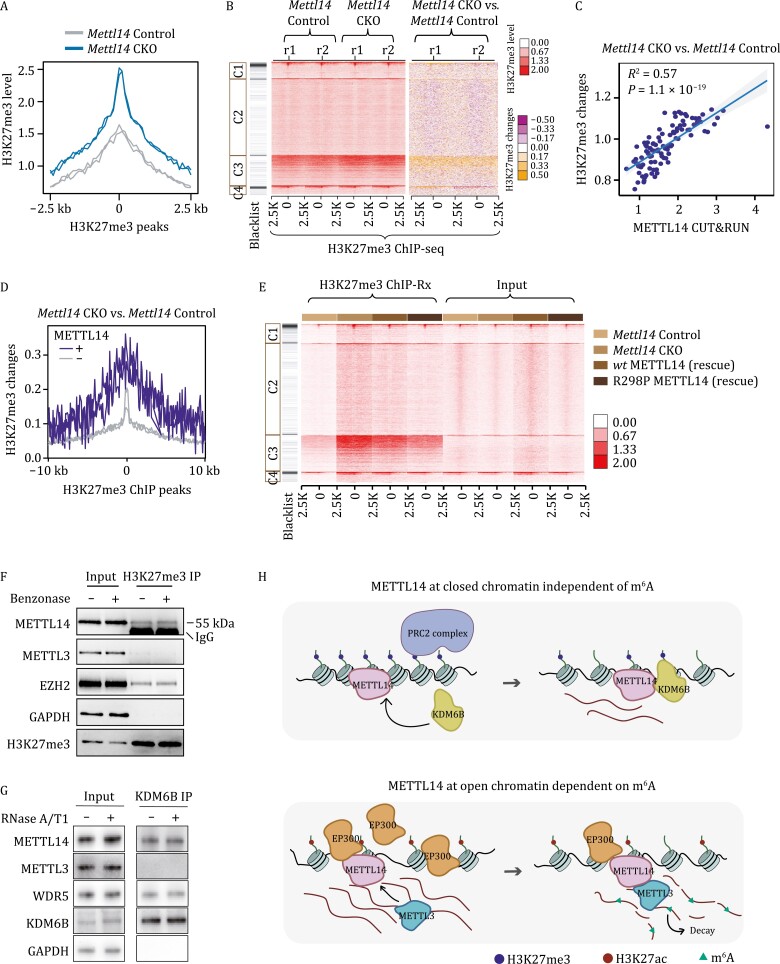
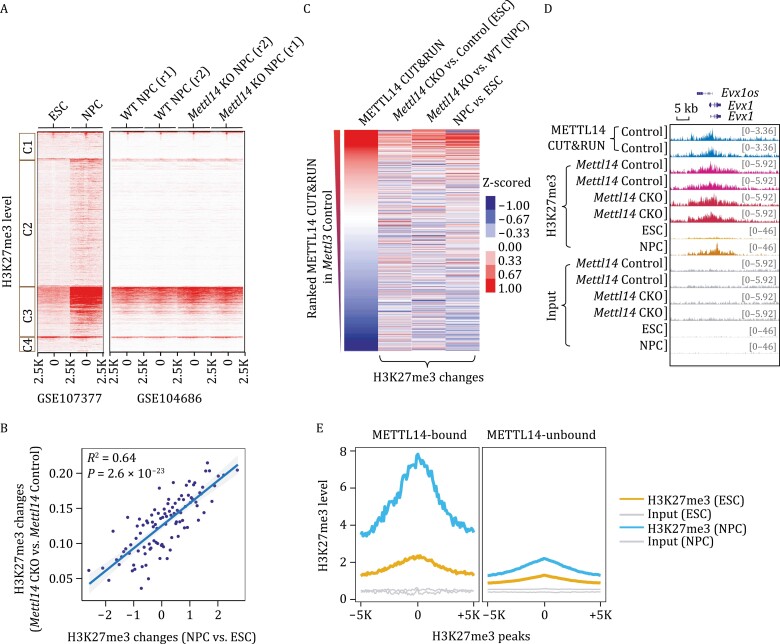
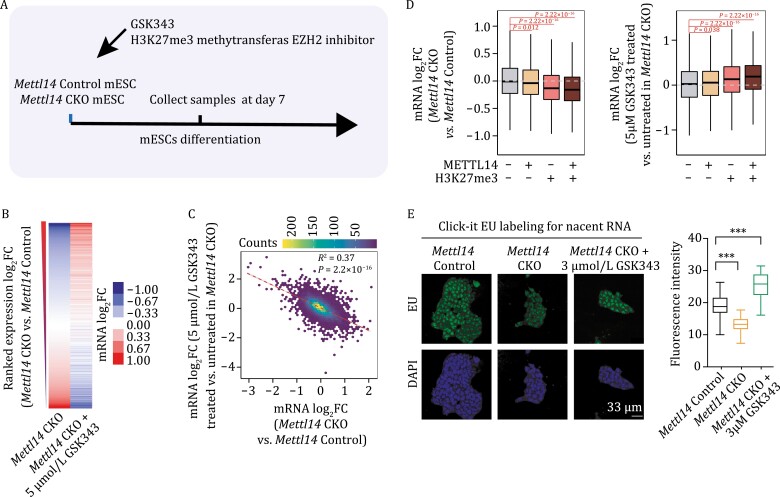
METTL3 and METTL14 are two components that form the core heterodimer of the main RNA m6A methyltransferase complex (MTC) that installs m6A. Surprisingly, depletion of METTL3 or METTL14 displayed distinct effects on stemness maintenance of mouse embryonic stem cell (mESC). While comparable global hypo-methylation in RNA m6A was observed in Mettl3 or Mettl14 knockout mESCs, respectively. Mettl14 knockout led to a globally decreased nascent RNA synthesis, whereas Mettl3 depletion resulted in transcription upregulation, suggesting that METTL14 might possess an m6A-independent role in gene regulation. We found that METTL14 colocalizes with the repressive H3K27me3 modification. Mechanistically, METTL14, but not METTL3, binds H3K27me3 and recruits KDM6B to induce H3K27me3 demethylation independent of METTL3. Depletion of METTL14 thus led to a global increase in H3K27me3 level along with a global gene suppression. The effects of METTL14 on regulation of H3K27me3 is essential for the transition from self-renewal to differentiation of mESCs. This work reveals a regulatory mechanism on heterochromatin by METTL14 in a manner distinct from METTL3 and independently of m6A, and critically impacts transcriptional regulation, stemness maintenance, and differentiation of mESCs.

Keywords: H3K27me3; METTL14; chromatin; m6A-independent; mESC differentiation.


Conflict of interest statement

C.H. is a scientific founder and a member of the scientific advisory board of Accent Therapeutics, Inc. D

Figures

Figure 1.
Figure 1.
METTL3 and METTL14 showed different effects on stemness maintenance of mESCs. (A) Alkaline phosphatase staining of Mettl3 Control and Mettl3 CKO, and Mettl14 Control and Mettl14 CKO mESCs. (B) Colony formation abilities of Mettl3 Control and Mettl3 CKO, Mettl14 Control and Mettl14 CKO quantified by AP staining. n = 4 biological replicates; error bars indicate means ± SEM. (C and D) LC–MS/MS quantification of the m6A/A ratio of the nonribosomal (non-Ribo) RNA in soluble cytoplasmic (Cyto), nucleoplasmic (Nu), and chromosome-associated (Chro) fractions extracted from Mettl3 Control and Mettl3 CKO (C), Mettl14 Control and Mettl14 CKO (D) mESCs, respectively. n = 3 biological replicates; error bars indicate means ± SEM. (E and F) m6A level changes on carRNAs were quantified through normalizing m6A sequencing results with spike-in in Mettl3 Control and Mettl3 CKO (E), Mettl14 Control and Mettl14 CKO (F) mESCs, respectively. n = 2 biological replicates; error bars indicate means ± SEM. (G and H) carRNAs were divided into hypo-methylated (Hypo-m6A) and non-hypo-methylated (The rest) groups in mESCs. Boxplot showing greater increases in RNA abundance fold-changes (log2FC) of Mettl3 CKO vs. Mettl3 Control (G) or Mettl14 CKO vs. Mettl14 Control (H) in the hypo-m6A group compared with the rest group in mESCs. P values were calculated by a nonparametric Wilcoxon-Mann–Whitney test.
Figure 2.
Figure 2.
METTL3 and METTL14 showed opposite effects on transcription regulation. (A) Nascent RNA synthesis in Mettl3 Control, Mettl3 CKO, Mettl14 Control, and Mettl14 CKO mESCs, detected by using a click-it RNA Alexa fluor 488 imaging kit. EU, 5-ethynyl uridine; DAPI, 4ʹ,6-diamidino-2-phenylindole. (B) Cumulative distributions of transcription rate in Mettl14 Control and Mettl14 CKO in mESCs. P values were calculated by a nonparametric Wilcoxon-Mann–Whitney test. (C and D) Volcano plots of genes that differentially expressed upon Mettl14 (C) or Mettl3 (D) knockout in mESCs (adjusted P [padj] < 0.05). Down- and up-regulated genes are highlighted with blue and orange, respectively.
Figure 3.
Figure 3.
METTL14 displayed distinct chromatin bindings compared with METTL3. (A) Heatmap showing METTL14 CUT&RUN signal around the METTL14 peak centers (±5 kb, left panel), and METTL3 CUT&RUN signal around the METTL3 peak centers (±5 kb, right panel) in wild-type mESCs. (B) Venn diagram of peaks overlap between METTL3 and METTL14 CUT&RUN peaks in wild-type mESCs. (C) Distribution of METTL3 and METTL14 CUT&RUN peaks in wild-type mESCs at distinct genomic regions including promoter, TTS, exonic, intronic, and intergenic regions annotated by HOMER in Mettl3 Control and Mettl3 CKO mESCs. n = 2 biological replicates; error bars indicate means ± SEM. (D) METTL14 and METTL3 sites in wild-type mESCs were categorized into three groups: (i) METTL14 binding sites that were neither colocalized with METTL3 nor located at m6A-marked transcripts (METTL14-specific sites); (ii) METTL3 bindings sites that were neither colocalized with METTL14 nor located at m6A-marked transcripts (METTL3-specific sites); (iii) METTL14 or METTL3 binding sites that were located at m6A-marked transcripts (METTL3/METTL14-m6A transcripts). Bar chart shows the number of sites in each group. The caRNA MeRIP-seq in this study were used to identify m6A-marked transcripts. (E) Scatter plot (left panel) and boxplot (right panel) showing METTL14 CUT&RUN signal in Mettl3 Control and Mettl3 CKO mESCs. P value in boxplot was calculated by a nonparametric Wilcoxon-Mann–Whitney test. (F) Gene Ontology (GO) enrichment analysis of METTL14 gene targets in mESCs.
Figure 4.
Figure 4.
METTL14 colocalizes with H3K27me3 marked facultative heterochromatin. (A) METTL3 and METTL14 CUT&RUN peaks are grouped into four clusters with K-means clustering method. The inputs are METTL3 or METTL14 CUT&RUN signals at their peak centers and the flanking 2.5 kb regions in Mettl3 Control and Mettl3 CKO, Mettl14 Control and Mettl14 CKO mESCs. The heatmap showing the clustering results of METTL3 and METTL14 CUT&RUN signal on their peak centers and the flanking 2.5 kb regions. (B) Average profiles of METTL3 and METTL14 CUT&RUN signal within each cluster in (A). (C) The heatmap showing various histone modification on the four clusters of METTL3 and METTL14 CUT&RUN peak centers and the flanking 2.5 kb regions identified in (A). (D) Average profile of H3K27me3 modification level around H3K27me3 peak center and the flanking 5 kb regions. H3K27me3 peaks were categorized into METTL14 bound (+) and unbound (−) groups. (E) Cumulative distribution and boxplots (inside) of H3K27me3 peaks width. H3K27me3 peaks were categorized into METTL14 bound (+) and unbound (−) groups. P values were calculated by a nonparametric Wilcoxon-Mann–Whitney test. (F) IGV plots showing METTL3 and METTL14 CUT&RUN signal, H3K27me3 modification level and its inputs around Pax6 gene loci in Mettl14 Control and Mettl14 CKO mESCs, respectively.
Figure 5.
Figure 5.
METTL14 directly regulates H3K27me3 deposition in mESCs. (A) Average profiles of H3K27me3 modification at H3K27me3 peak centers and the flanking 2.5 kb regions in Mettl14 Control and Mettl14 CKO mESCs, respectively. n = 2 biological replicates. (B) Heatmap showing H3K27me3 level (left panel) and H3K27me3 level changes (right panel) upon Mettl14 knockout in mESCs, respectively. (C) The correlation between METTL14 CUT&RUN signal and H3K27me3 changes upon Mettl14 knockout in mESCs, respectively. Sites ranked by METTL14 CUT&RUN signal were grouped and average into 100 data point. (D) Average profile of H3K27me3 changes upon Mettl14 knockout in mESCs at H3K27me3 peak centers and the flanking 10kb regions. H3K27me3 peaks were categorized into METTL14 bound (+) and unbound (−) groups. (E) Heatmap showing H3K27me3 levels at four identified clusters in Mettl14 Control, Mettl14 CKO, and Mettl14 CKO mESCs rescued with wild-type METTL14 or R298P mutated METTL14. ChIP-seq signal has been normalized to Drosophila Spike-in DNAs. (F) Western blots of the immunoprecipitated H3K27me3 and its interaction with METTL14 in mESCs with and without Benzonase treatment. (G) Western blots of the immunoprecipitated KDM6B and its interaction with METTL14 and METTL3 in mESCs with and without RNase treatment. (H) A schematic model showing how METTL14 functions distinctly on chromatin when located at repressive (upper panel) and active (lower panel) chromatin, respectively.
Figure 6.
Figure 6.
METTL14 regulates H3K27me3 changes during neuronal differentiation of mESCs. (A) Heatmap showing H3K27me3 levels on four clusters of METTL3 and METTL14 CUT&RUN peak centers and the flanking 2.5 kb regions in ESCs, NPCs, wildtype (WT), and Mettl14 KO NPCs, respectively. (B) The correlation of H3K27me3 changes between NPCs vs. ESCs and Mettl14 CKO vs. Mettl14 Control ESCs. Sites ranked by H3K27me3 changes upon differentiation (NPC vs. ESCs) were grouped and average into 100 data point. (C) Heatmap showing METTL14 CUT&RUN signal, and changes of H3K27me3 level comparing Mettl14 CKO vs. Mettl14 Control ESCs, Mettl14 KO vs. wildtype (WT) NPC, NPC vs. ESCs, respectively on METTL14 CUT&RUN peak centers and the flanking 2.5 kb regions. METTL14 peaks were ranked by its CUT&RUN signal intensity. (D) IGV plots of METTL14 CUT&RUN signal and H3K27me3 modification in Mettl14 Control and Mettl14 CKO mESCs, wild-type ESCs and NPCs around Evx1 gene loci. (E) Average profile of H3K27me3 in mESCs and NPCs at H3K27me3 peak centers and the flanking 5KB regions. H3K27me3 peaks were categorized into METTL14 bound (METTL14-bound) and unbound (METTL14-unbound) groups.
Figure 7.
Figure 7.
H3K27me3 methyltransferase inhibitor rescued gene expression changes upon Mettl14 depletion. (A) Schematic of experimental design. (B) Heatmap showing gene expression fold-changes (log2FC) comparing Mettl14 CKO vs. Mettl14 Control mEBs, Mettl14 CKO mEBs treated with GSK343 vs. untreated, respectively. Genes were ranked by gene expression log2FC comparing Mettl14 CKO vs. Mettl14 Control mEBs. (C) The correlation of mRNA expression log2FC between Mettl14 CKO vs. Mettl14 Control, and Mettl14 CKO mEBs treated with GSK343 vs. untreated. (D) Boxplots of mRNA expression log2FC comparing Mettl14 CKO vs. Mettl14 Control mEBs (left panel), and Mettl14 CKO mEBs treated with GSK343 vs. untreated (right panel). Genes were categorized into four groups according to whether they are targets of H3K27me3 or METTL14. P values were calculated by a nonparametric Wilcoxon-Mann–Whitney test. (E) Nascent RNA synthesis in Mettl14 Control, Mettl14 CKO and Mettl14 CKO treated with 3 μmol/L GSK343 mESCs, detected by using a click-it RNA Alexa fluor 488 imaging kit. EU, 5-ethynyl uridine; DAPI, 4ʹ,6-diamidino-2-phenylindole.

Similar articles

Cited by

References

    1. Amemiya, HM, Kundaje A, Boyle AP.. The ENCODE Blacklist: identification of problematic regions of the genome. Sci Rep 2019;9:9354. - PMC - PubMed
    1. Anders, S, Pyl T, Huber W.. HTSeq--a Python framework to work with high-throughput sequencing data. Bioinformatics 2015;31:166–169. - PMC - PubMed
    1. Andersson-Rolf A, Mustata RC, Merenda Aet al. . One-step generation of conditional and reversible gene knockouts. Nat Methods 2017;14:287–289. - PMC - PubMed
    1. Barbieri I, Tzelepis K, Pandolfini Let al. . Promoter-bound METTL3 maintains myeloid leukaemia by m6A-dependent translation control. Nature 2017;552:126–131. - PMC - PubMed
    1. Bolger, AM, Lohse M, Usadel B.. Trimmomatic: a flexible trimmer for Illumina sequence data. Bioinformatics 2014;30:2114–2120. - PMC - PubMed

Publication types