. 2023 May 9;56(5):1132-1147.e6.
doi: 10.1016/j.immuni.2023.03.010. Epub 2023 Apr 7.

CD8+ T cells promote HIV latency by remodeling CD4+ T cell metabolism to enhance their survival, quiescence, and stemness

Affiliations

CD8+ T cells promote HIV latency by remodeling CD4+ T cell metabolism to enhance their survival, quiescence, and stemness

Simona Mutascio et al. Immunity. .

Abstract

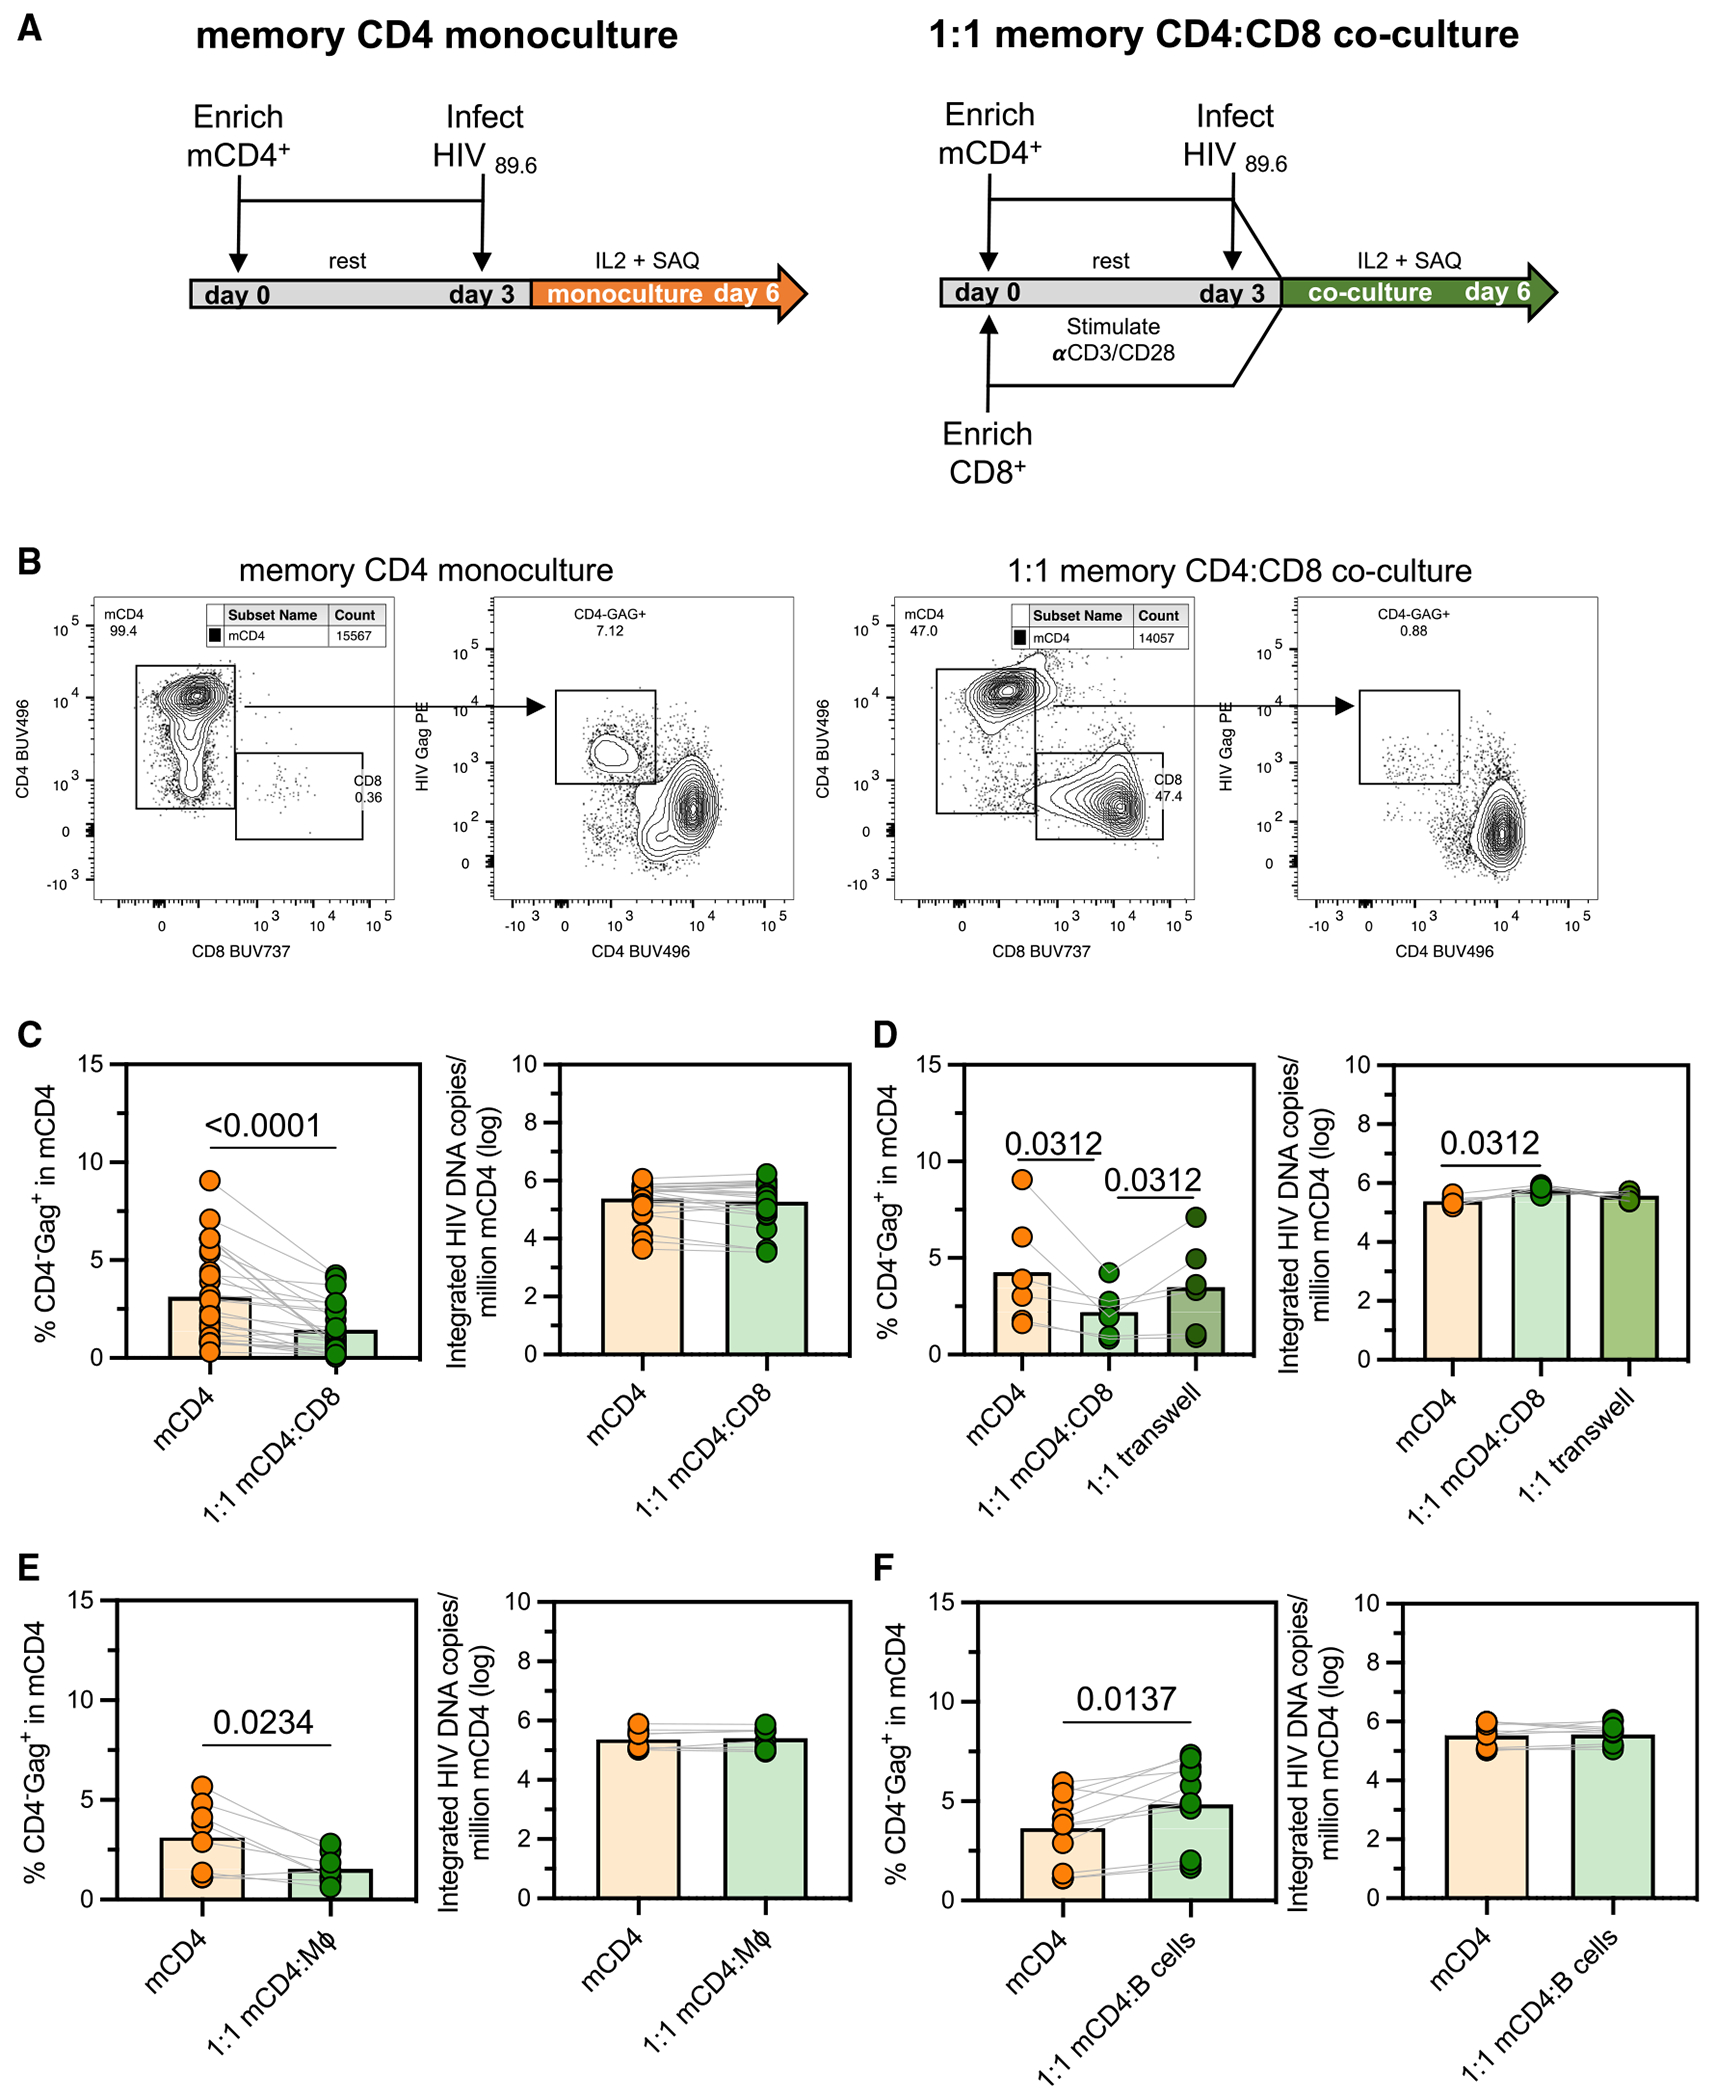
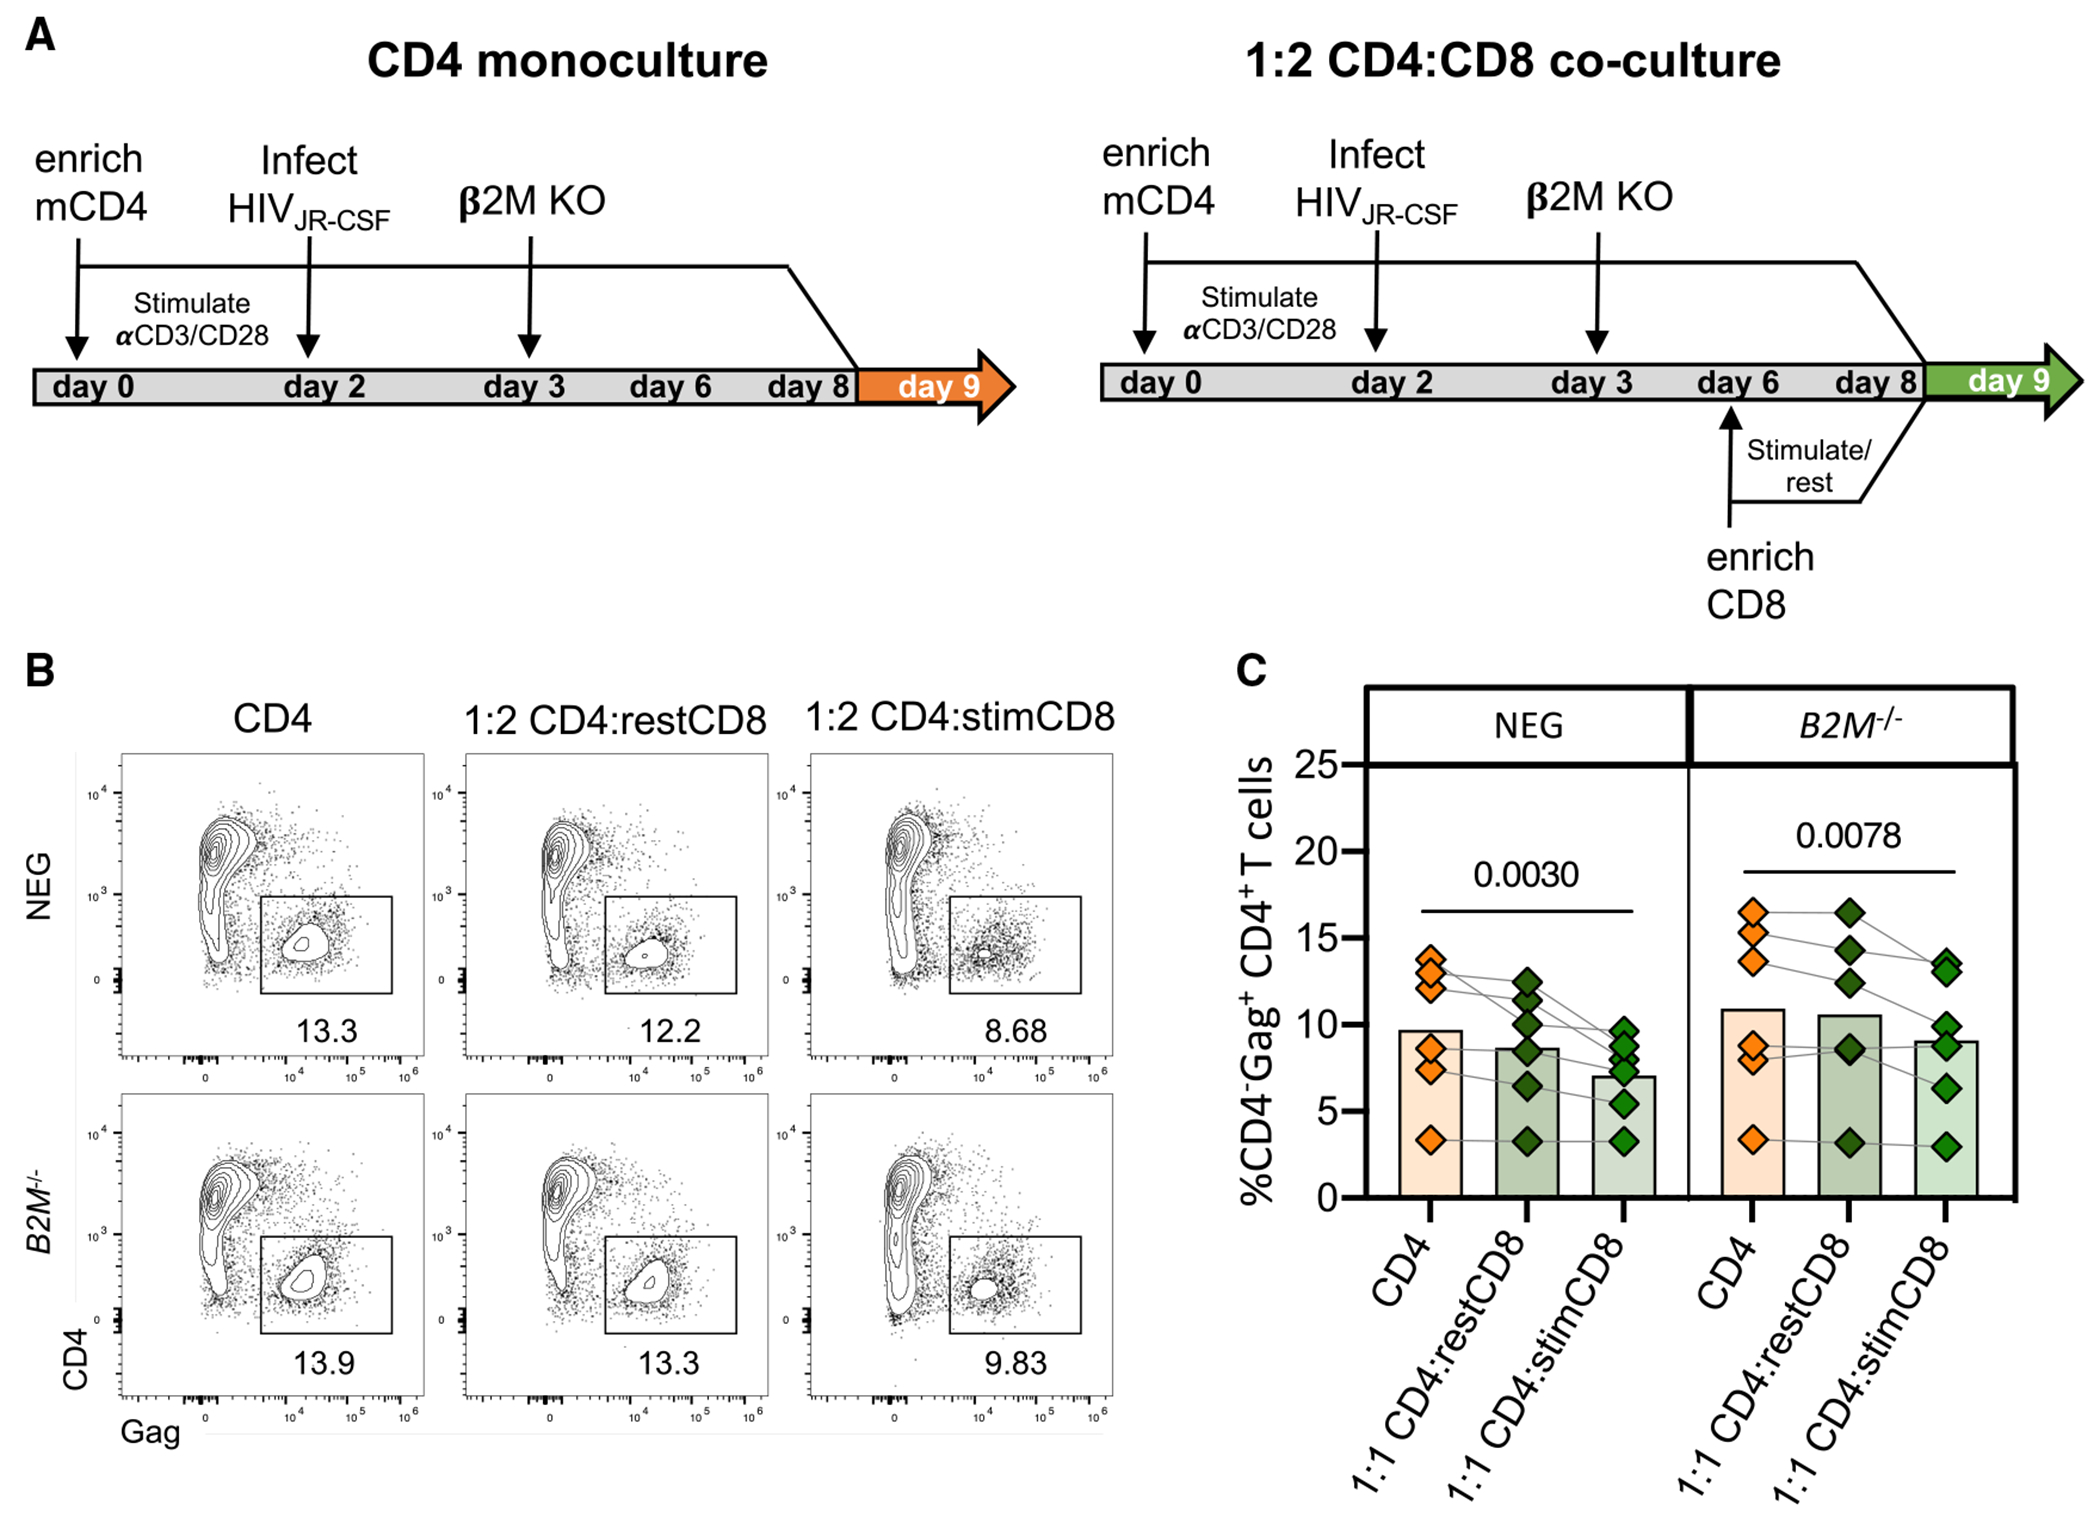
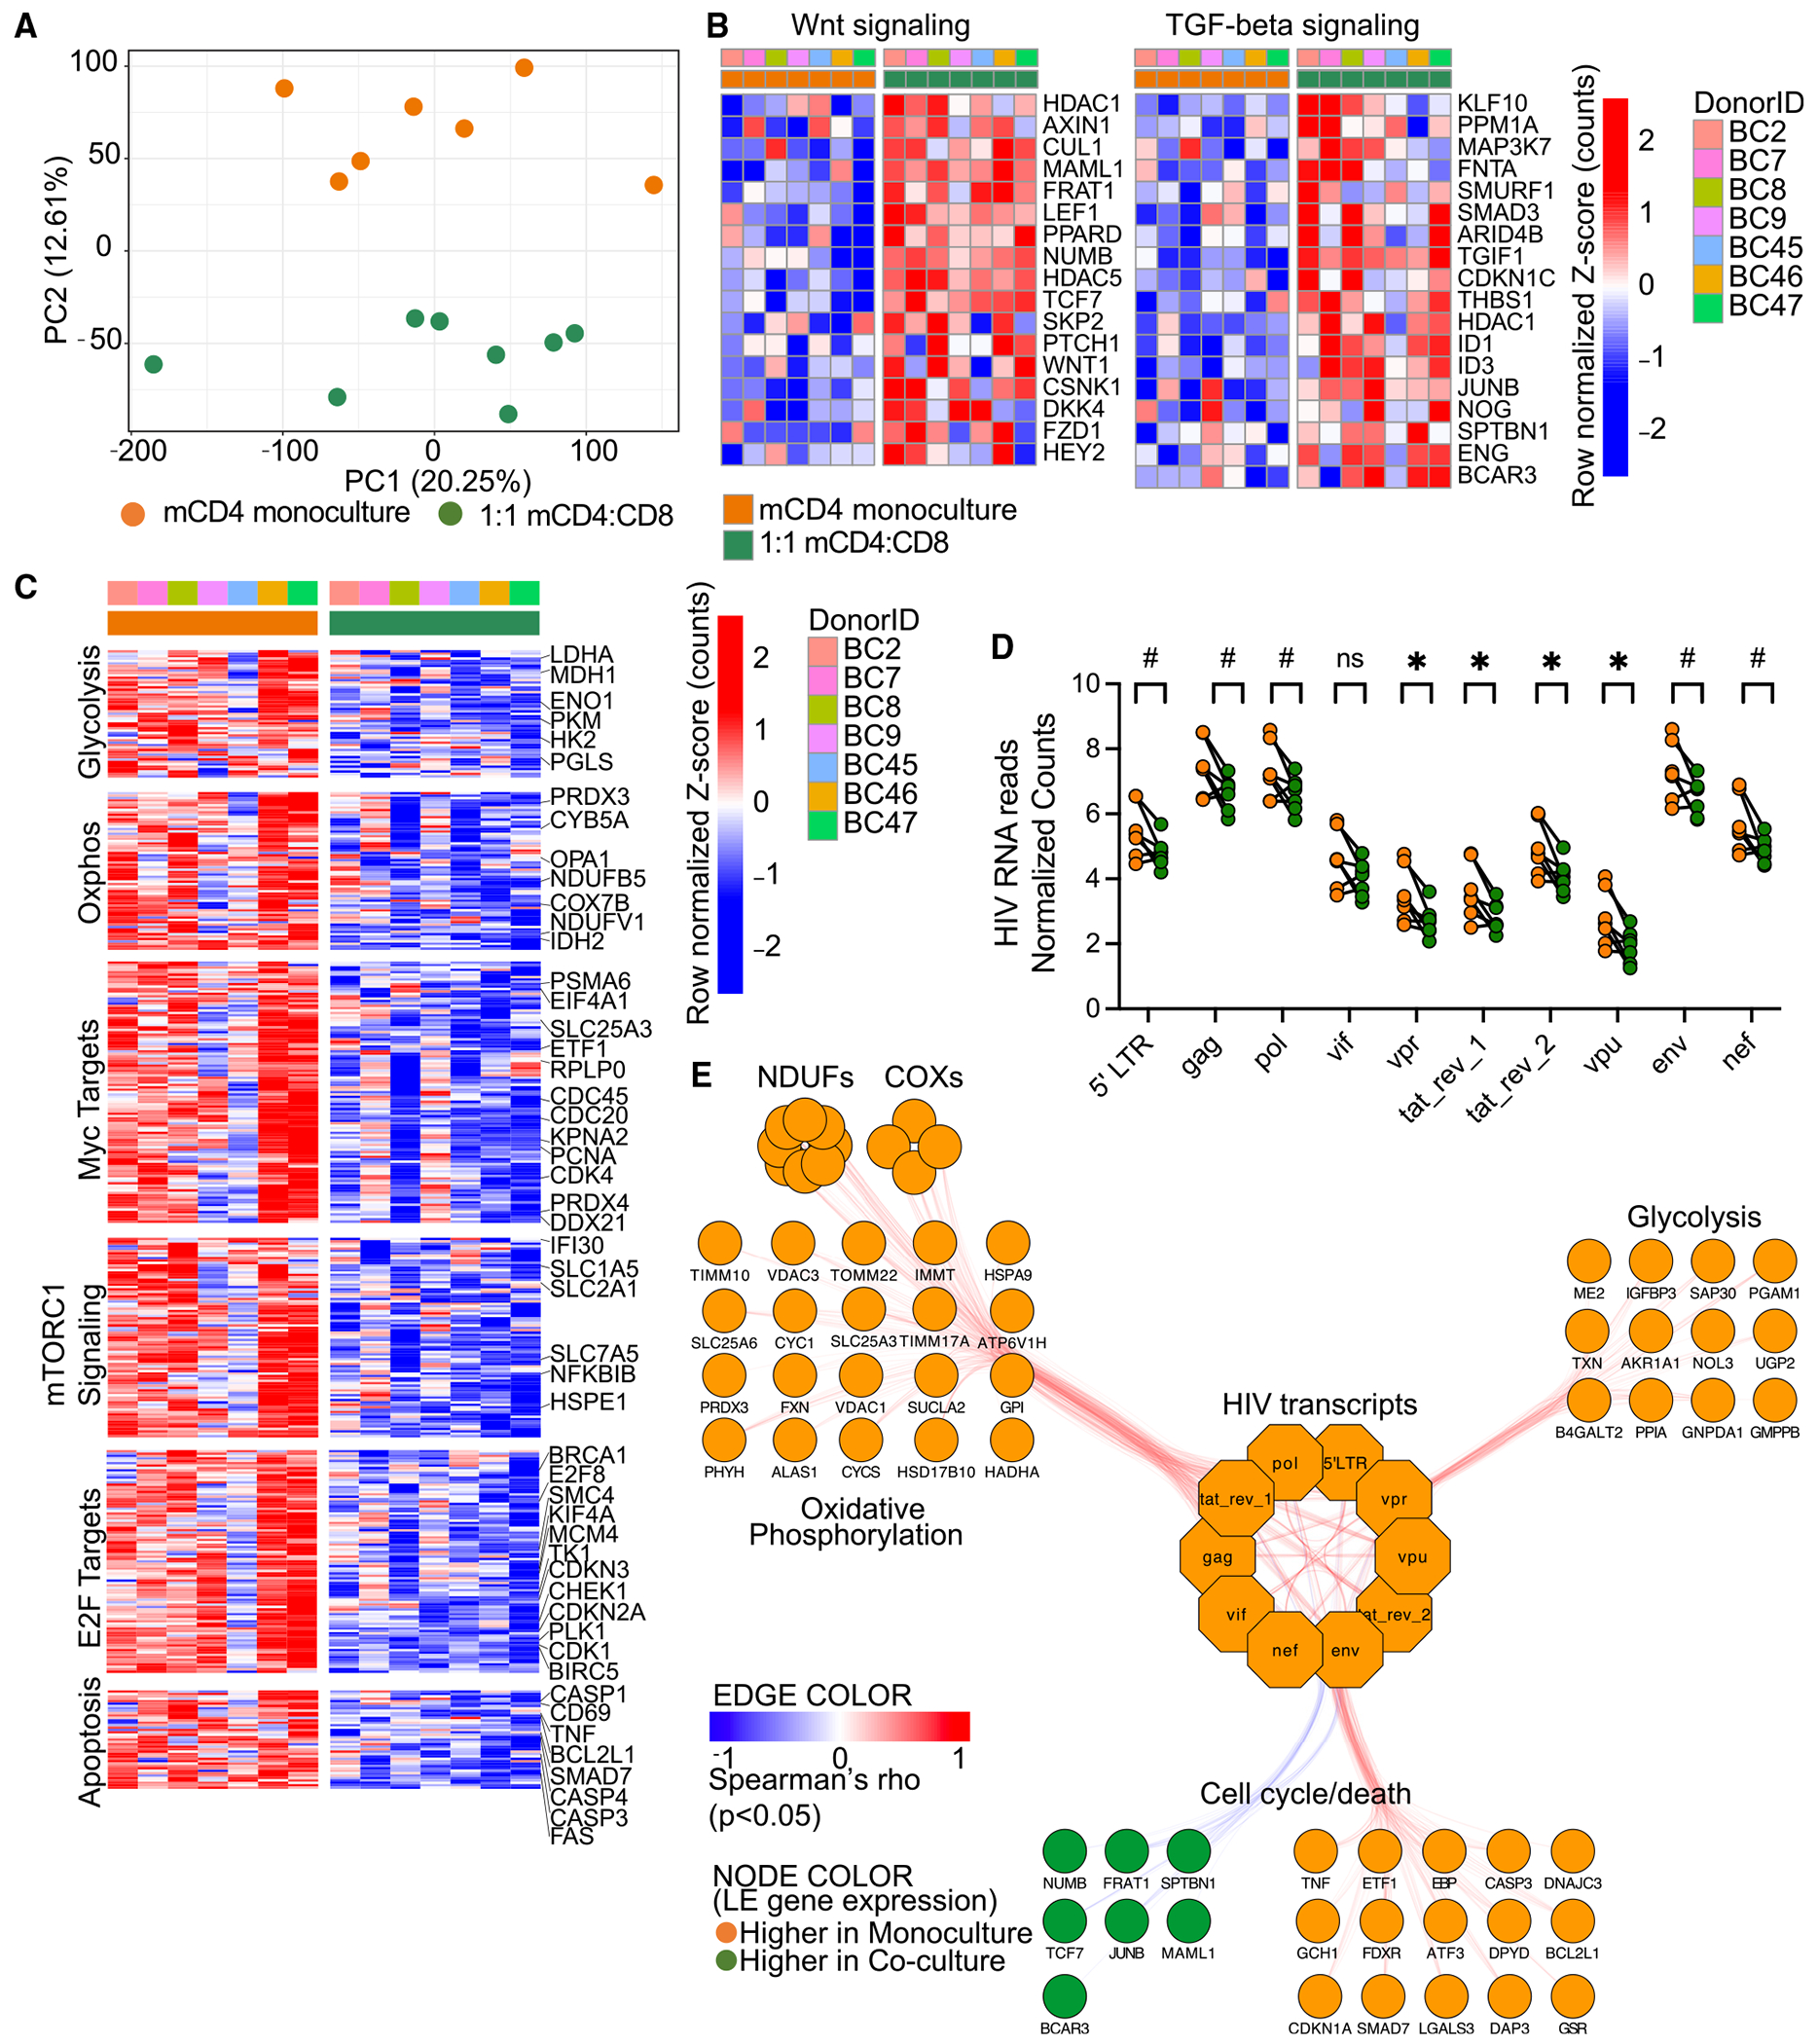
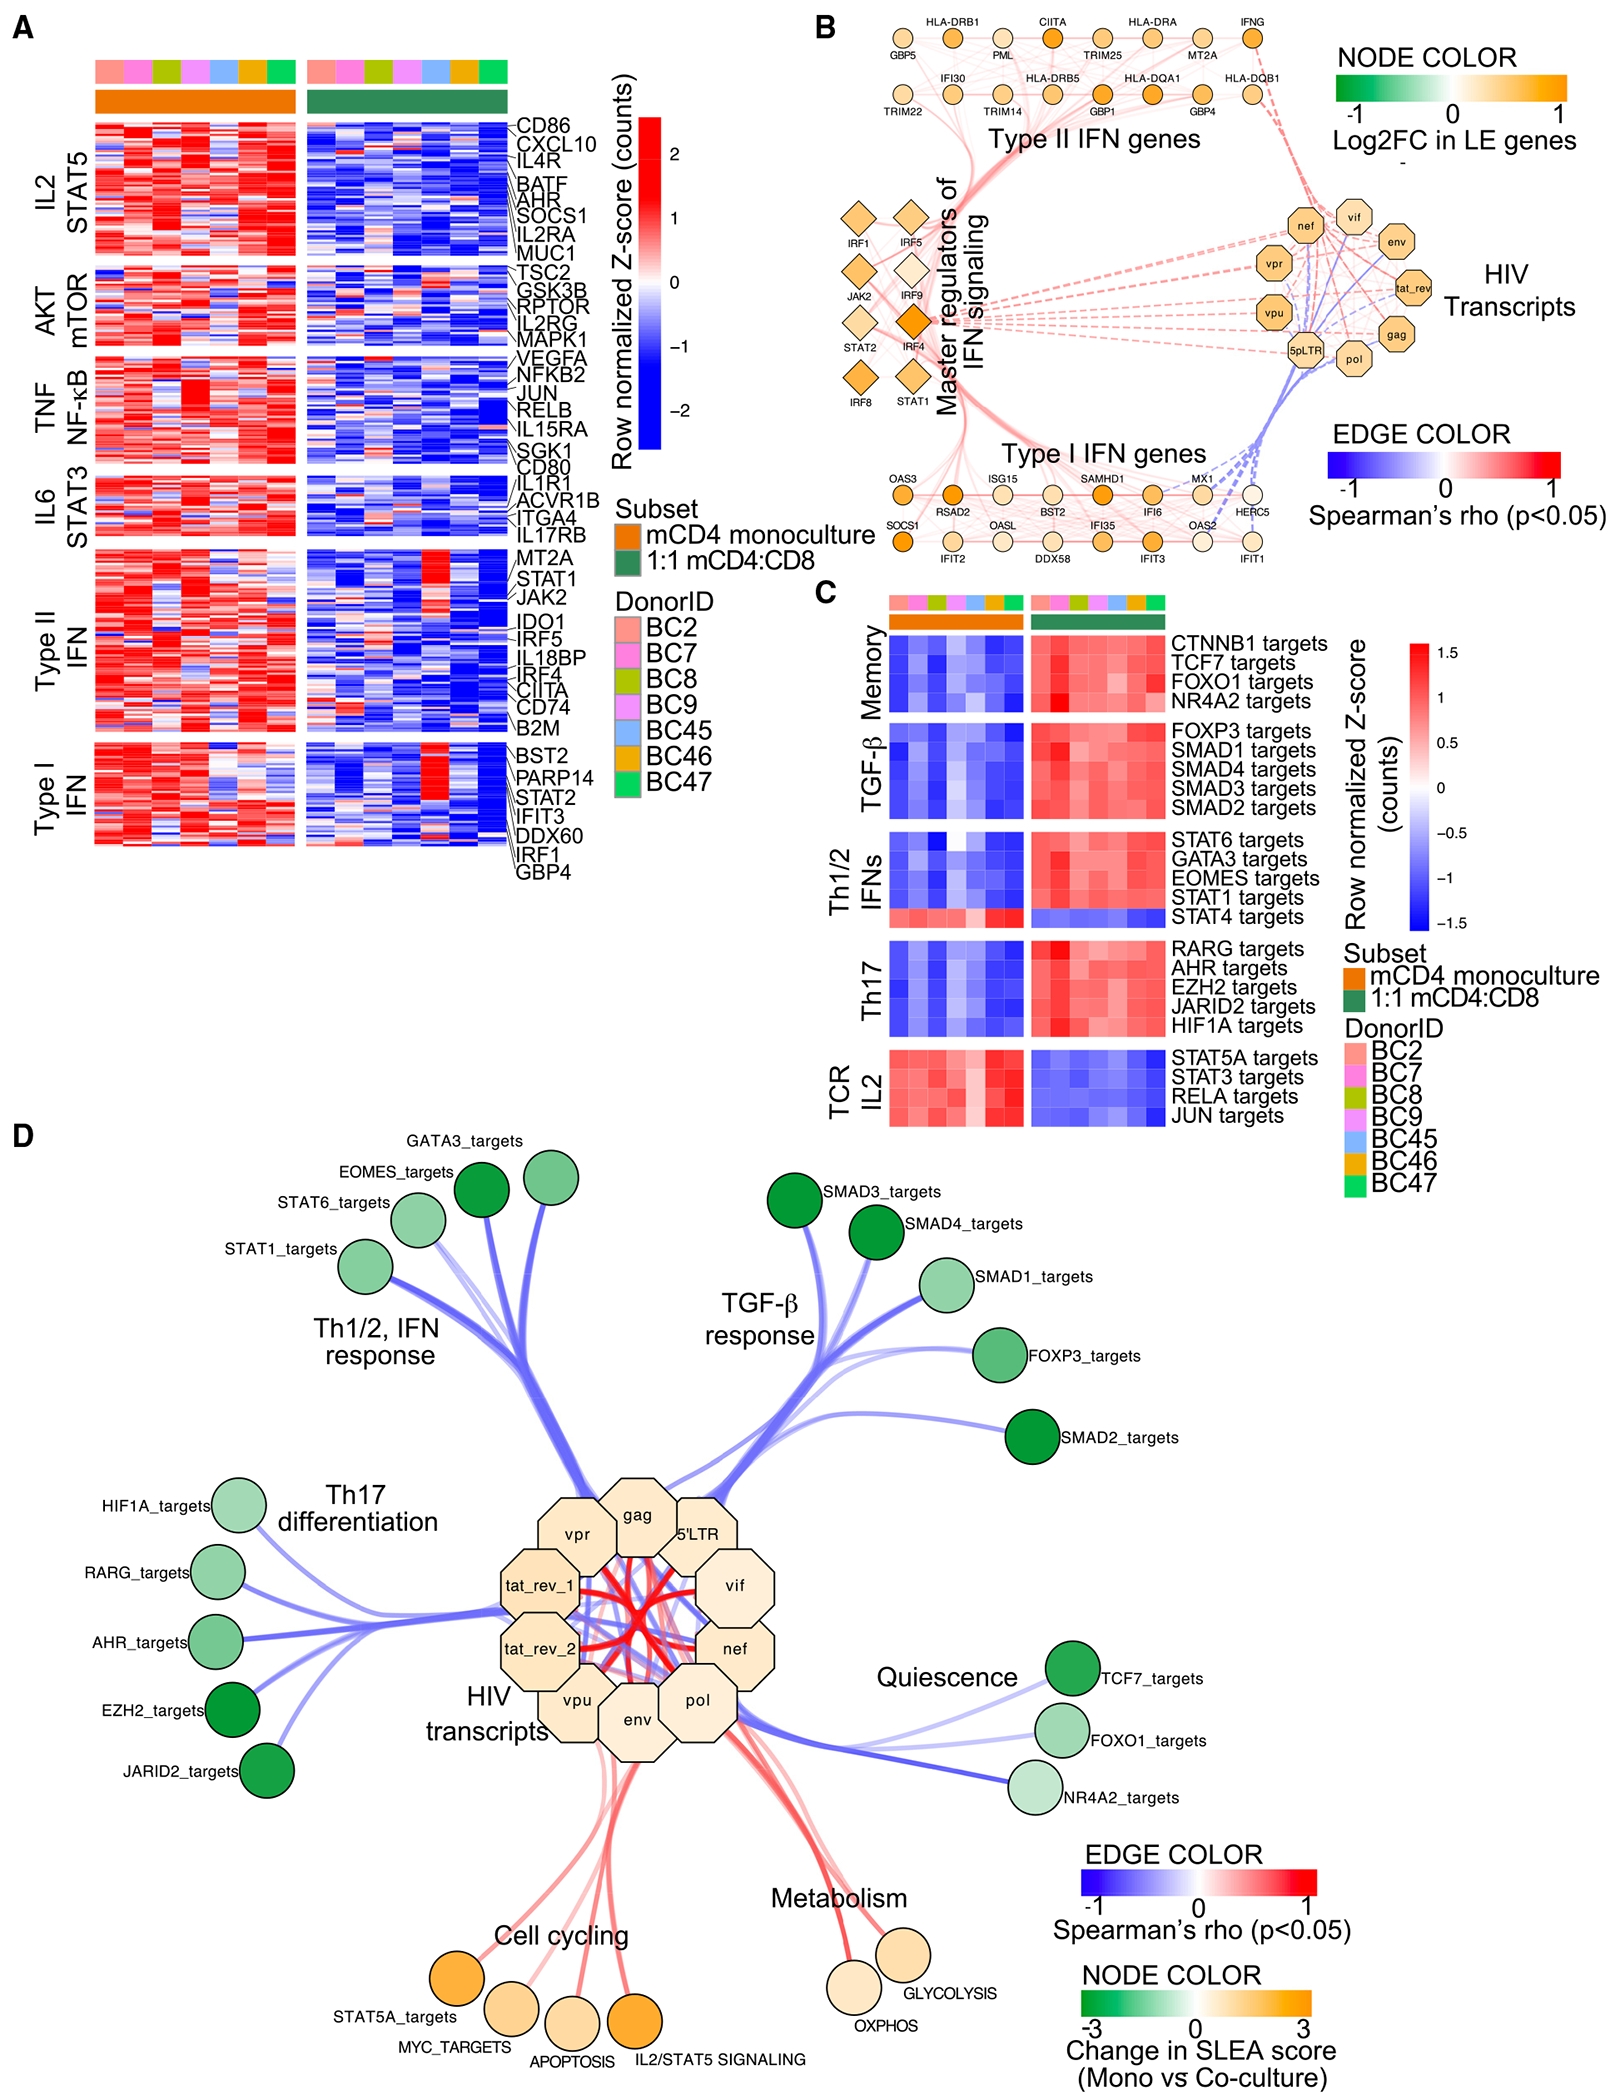
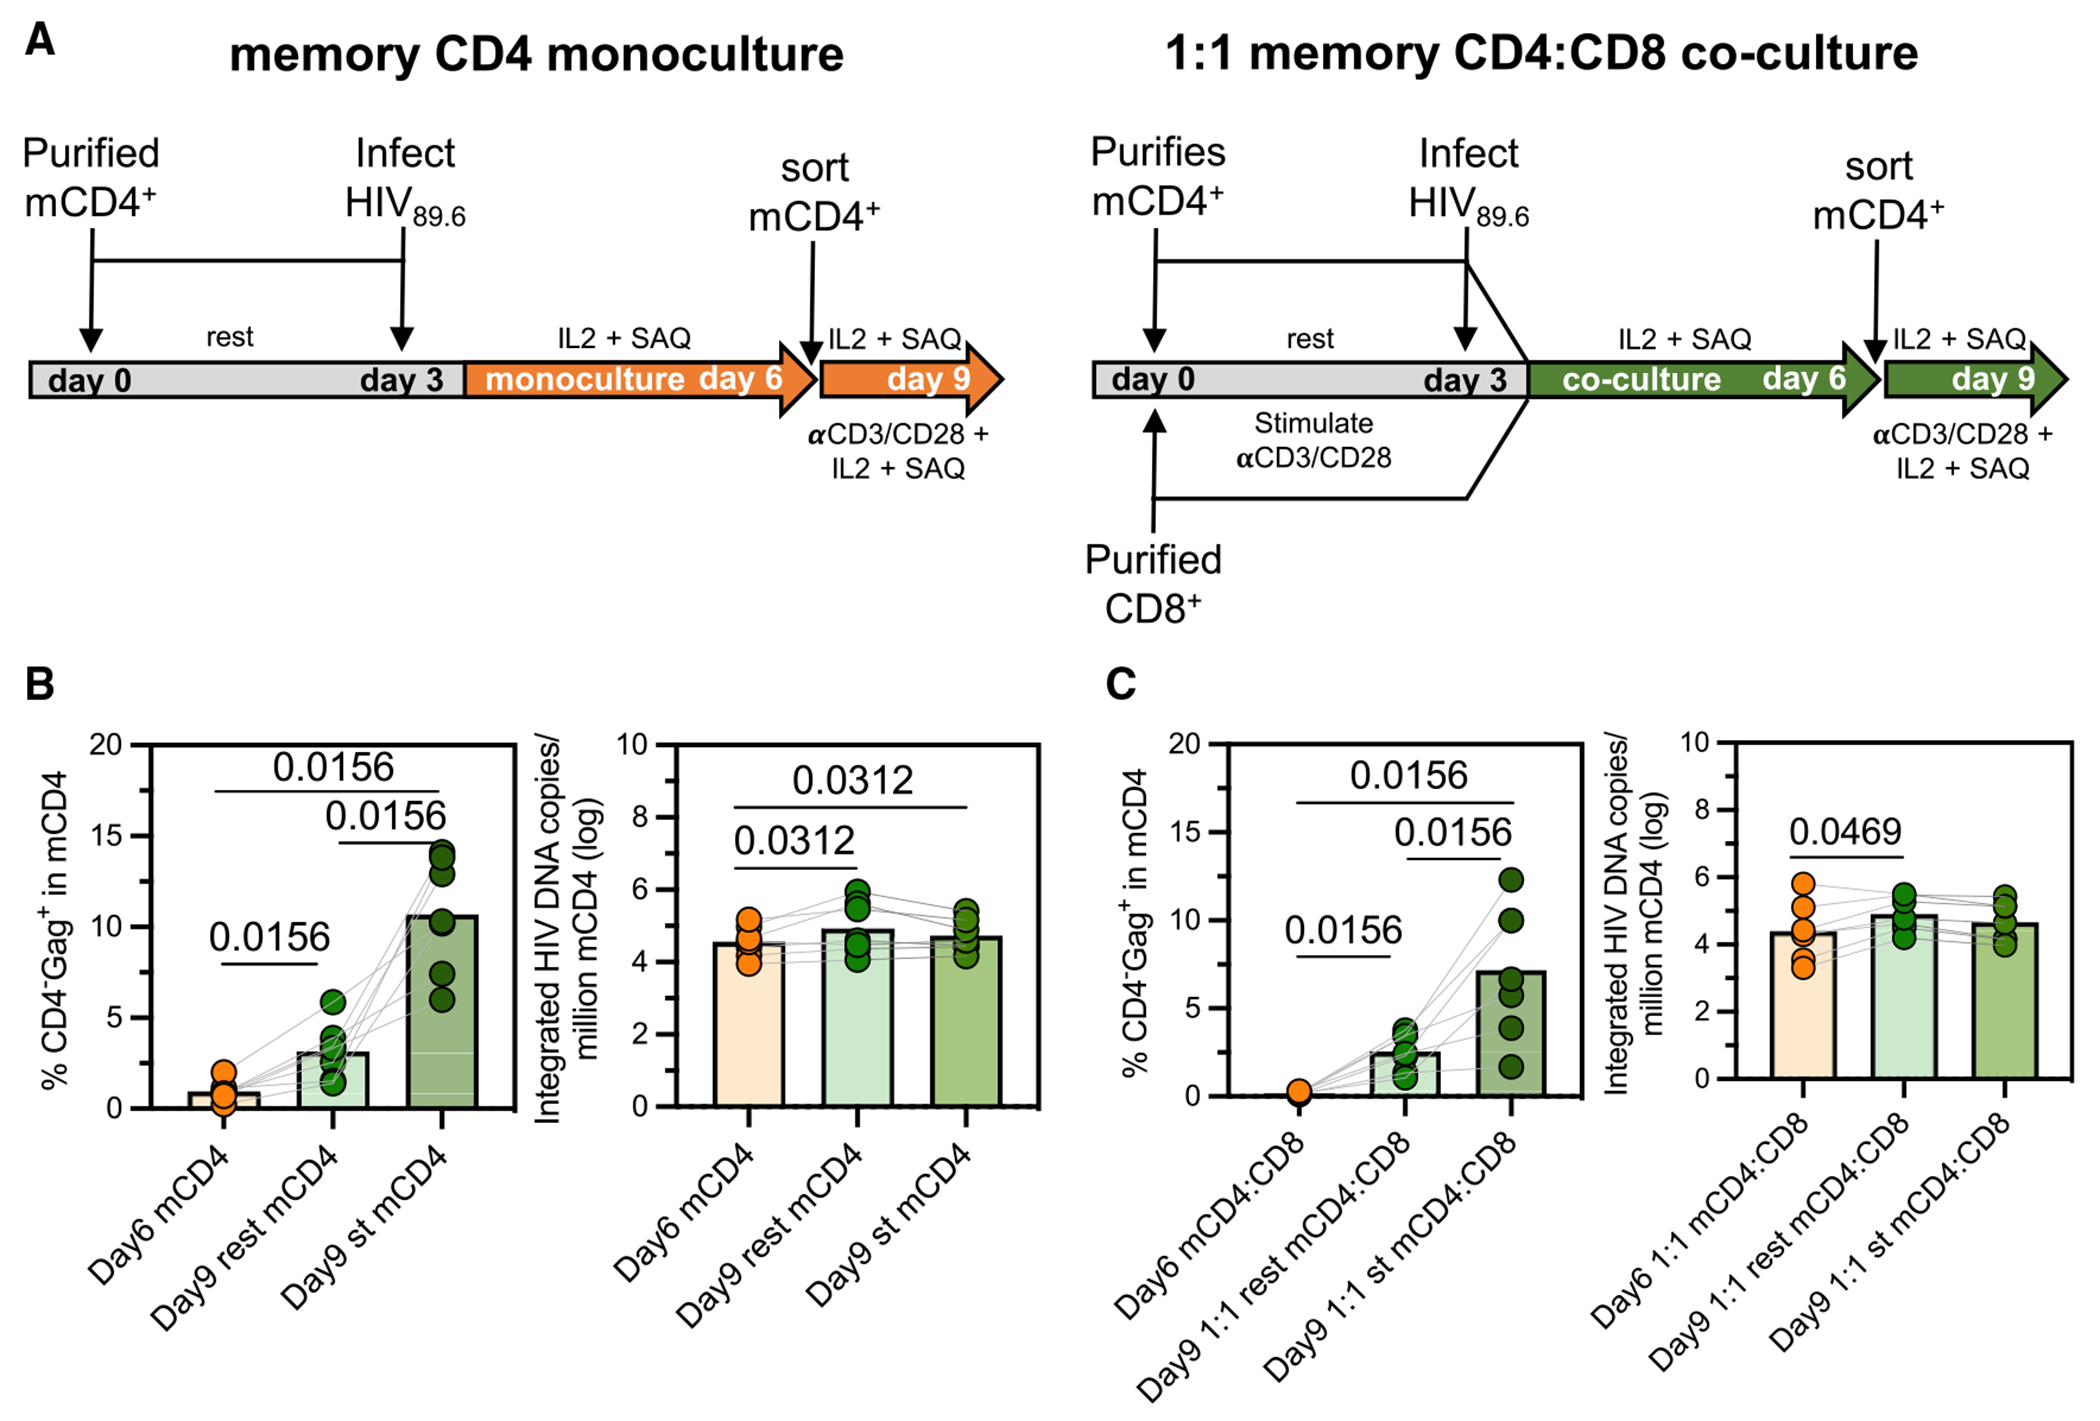
HIV infection persists during antiretroviral therapy (ART) due to a reservoir of latently infected cells that harbor replication-competent virus and evade immunity. Previous ex vivo studies suggested that CD8+ T cells from people with HIV may suppress HIV expression via non-cytolytic mechanisms, but the mechanisms responsible for this effect remain unclear. Here, we used a primary cell-based in vitro latency model and demonstrated that co-culture of autologous activated CD8+ T cells with HIV-infected memory CD4+ T cells promoted specific changes in metabolic and/or signaling pathways resulting in increased CD4+ T cell survival, quiescence, and stemness. Collectively, these pathways negatively regulated HIV expression and ultimately promoted the establishment of latency. As shown previously, we observed that macrophages, but not B cells, promoted latency in CD4+ T cells. The identification of CD8-specific mechanisms of pro-latency activity may favor the development of approaches to eliminate the viral reservoir in people with HIV.

Keywords: CD8 T cells; CD8 suppression; HIV; HIV cure; HIV latency; HIV reservoir; T cell biology.


Conflict of interest statement

Declaration of interests The authors declare no competing interests.

Figures

Figure 1.
Figure 1.. TCR-activated total CD8+ T cells decrease HIV expression in memory CD4+ T cells
(A) The in vitro model of memory CD4+ T cells monoculture and memory CD4:CD8 co-cultures is schematically represented. At day 0 memory CD4+ T cells (mCD4+) and CD8+ T cells were enriched from HIV PBMCs. Memory CD4+ T cells were rested and infected at day 3 with HIV89.6 and resuspended in T cell culture media with 50 IU/mL IL-2 and 2.8 IU/mL saquinavir. For co-cultures, in parallel, CD8+ T cells were stimulated with αCD3/CD28 Dynabeads at ratio 1:1 for 3 days. Right before the co-culture the Dynabeads were removed, and the activated CD8+ T cells were isolated. Cells were then cultured for 3 additional days as monocultures (orange arrow) or 1:1 CD4:CD8 co-cultures (green arrow). At day 6 the cells were recovered and analyzed for flow cytometry or qPCR. (B) Representative flow plot from one assay of a paired CD4 monoculture and CD4:CD8 co-culture is shown. In the left panel of each pair, CD4 (y axis) and CD8 T (x axis) cells are labeled in the rectangle gates and the frequency of each population from CD3+Live cells is indicated. Inset box shows the event count within the memory CD4 subgate. In the right panel of each pair, the population of HIV-Gag+ (y axis) and CD4 (x axis) cells are labeled in the rectangles and the frequency of the CD4Gag+ cells from within the CD4 parent gate (black arrow) is indicated. (C) In the left panel, the frequency of CD4Gag+ cells from within memory CD4 parent gates of mono- (orange bar) and co-cultures (green bar) are shown. Circles represent unique donors from n = 27 independent assays, gray lines connect donor paired mono- and co-cultures. In the right panel, the HIV-infected cell frequency is represented as copies of integrated HIV DNA normalized by million memory CD4 input and assessed by quantitative PCR. Data transformed in log10 are presented. Circles represent unique donors from n = 27 assays, gray lines connect donor paired mono- and co-cultures. p values from Wilcoxon paired test are indicated, p > 0.05 where not reported. (D) In the left panel, the frequency of CD4GAG+ is shown as in (C) with memory CD4+ T cells and autologous activated CD8+ T cells separated by a membrane in a Transwell (1:1 Transwell) compared with monocultures and CD4:CD8 co-cultures from the same donor set (n = 6). On the right, the HIV-infected cell frequency is represented as copies of integrated HIV DNA normalized by million memory CD4+ T cells input and assessed by quantitative PCR. Data transformed in log10 are presented. Circles represent unique donors from n = 6 assays, gray lines connect donor paired mono-, co-, and trans-cultures, p values from Wilcoxon paired test are indicated, p > 0.05 where not reported. (E) In vitro HIV-infected memory CD4+ T cells were co-cultured with autologous activated CD14+ macrophages (Mφ). In the left panel the frequency of CD4Gag+ cells in each condition are shown. In the right panel, copies of integrated HIV provirus per million CD4+ T cells are reported. Circles represent unique donors from n = 11 assays, gray lines connect donor paired mono- and co-cultures. p values from Wilcoxon paired test are indicated, p > 0.05 where not reported. (F) In vitro HIV-infected memory CD4 were co-cultured with autologous activated CD19+ B cells. On the left, the frequency of CD4Gag+ cells in each condition are shown. On the right, copies of integrated HIV provirus per million cells are reported. Circles represent unique donors from n = 8 assays, gray lines connect donor paired mono- and co-cultures. mCD4: memory CD4+ T cells. p values from Wilcoxon paired test are indicated, p > 0.05 where not reported. See also Figure S1.
Figure 2.
Figure 2.. B2M depletion does not abrogate the suppressive effect of CD8+ T cells on the viral expression
(A) Schematic for our primary CD8+ T cell assay co-culture with HIVJR-CSF-infected CD4+ T cells. (B) Representative example of reduction in Gag-expression in CD4+ T cells after co-culture with unstimulated or αCD3/28 stimulated CD8s (% Gag); top panel NEG CRISPR, bottom panel β2M CRISPR. (C) The reduction of the HIV productive infection is reported as the frequency of CD4GAG+ cells in CD4+ T cells monocultured (orange) or co-cultured at the 1:2 ratio with CD8+ T cells unstimulated (darker green) or TCR activated (lighter green). On the right, the CD4+ T cells were B2M−/−, on the left it is reported the CRISPR negative control. mCD4: memory CD4+ T cells. (n = 6, Friedman test with multiple comparisons across respective conditions.) Data are represented as ±SEM. See also Figure S2.
Figure 3.
Figure 3.. Gag expression and memory CD4 subset distribution after co-culture with autologous TCR-activated CD8+ T cells
(A) Based on the CD27 and CCR7 expression, central, transitional and effector memory subsets were identified in memory CD4 monoculture and co-cultured with TCR-activated CD8+ T cells (n = 21). (B) The frequency of CD4Gag+ in the memory subsets is shown. Circles represent unique donors from n = 21 assays, gray lines connect donor paired mono- and co-cultures. (C and D) The activation markers PD-1 (n = 13, left panel) and CD69 (n = 14, right panel) were analyzed on day 3 before the infection (pre-I d3, black bars) and on day 6 memory CD4 in mono- and co-culture (yellow and green bars, respectively). (E and F) Simple linear regression analysis was performed to express the relationship of Gag and CD69 expression in memory CD4 prior to infection (E) and on day 6 in memory CD4:CD8+ T cells (F). mCD4: memory CD4+ T cells. p values from Wilcoxon paired test are indicated, p > 0.05 where not reported. Data are represented as ± SEM. See also Figure S3.
Figure 4.
Figure 4.. HIV-infected CD4+ T cells co-cultured with autologous CD8+ T cells show higher expression of quiescence associated gene sets and lower expression of cell cycling and metabolism gene sets
(A) Principal component analyses (PCAs) of whole genome gene expression (RNA sequencing) of sorted HIV-infected CD4+ T cells that were either cultured alone (n = 7; orange circles) or co-cultured with autologous HIV-naive CD8+ T cells (n = 7; green circles) at a 1:1 ratio for 3 days. (B and C) Heatmaps showing Z score row-normalized gene expression of leading-edge genes from Wnt signaling and TGF-β signaling gene sets (B) or glycolysis, oxidative phosphorylation, Myc targets, mTOR targets, E2F targets and apoptosis gene sets (C) in sorted HIV-infected CD4+ T cells that were either cultured alone (n = 7; orange subset columns) or with autologous HIV-naive CD8+ T cells (n = 7; green subset columns) for 3 days. The gene sets were obtained from MSigDB’s Hallmark module. For (B) and (C), gene set enrichment analysis (GSEA) was run on a pre-ranked list of differentially expressed genes (DEGs) (ranking determined by −sign(fold change) * log(p value)) and was used to assess to determine significant differences (p value < 0.05; FDR < 0.05) and the represented genes were defined by leading-edge analyses. (D) Transcript levels of all HIV subunits in sorted HIV-infected CD4+ T cells that were either cultured alone (n = 7; orange circles) or with autologous HIV-naive CD8+ T cells (n = 7; green circles) for 3 days was assessed in whole transcriptome data (normalized RNA-seq data). Significance between the two groups was assessed using the Wilcoxon-rank paired test; #p value < 0.1, *p value < 0.05. (E) Correlation network showing significant correlates of all HIV subunit transcripts with expression of leading-edge genes from pathways that differentiate HIV-infected CD4+ T cells were either cultured alone (n = 7; orange circles) or with autologous HIV-naive CD8+ T cells (n = 7; green circles) for 3 days. Orange circular nodes represent leading-edge genes of metabolic or cell cycling pathways that are enriched in monocultures, while green circular nodes represent leading genes from pathways that are enriched in co-cultures. Octagons represent HIV subunit nodes. All significant associations (Spearman’s correlation test; p value < 0.05) are represented as edges where blue is negative correlation, while red is positive correlation between HIV subunit transcripts and leading-edge genes. mCD4: memory CD4+ T cells.
Figure 5.
Figure 5.. HIV-infected CD4+ T cells that are co-cultured with autologous HIV-naive CD8+ T cells express reduced antiviral cascades, cytokine signaling, and effector T cell responses and have increased expression of transcription factor targets that drive cell quiescence
(A) Heatmaps showing Z score row-normalized gene expression of leading-edge genes from IL-2/STAT5, PI3K-AKT-mTOR, NF-κB and interferon signaling gene sets that differentiate sorted HIV-infected CD4+ T cells that were either cultured alone (n = 7; orange subset columns) or with autologous HIV-naive CD8+ T cells (n = 7; green subset columns) for 3 days. The gene sets were obtained from MSigDB’s Hallmark and c2 (Reactome) module. Gene set enrichment analysis (GSEA) was run on a pre-ranked list of differentially expressed genes (DEGs) (ranking determined by −sign(fold-change) * log(p value)) and was used to assess to determine significant differences (p value < 0.05; FDR < 0.05) and the represented genes were defined by leading-edge analyses. (B) Correlation network (transcriptome data from sorted HIV-infected CD4+ T cell samples from both mono- and co-culture groups) between type I/II interferon-associated genes (MSigDB’s c2:Reactome module) that are altered between the two groups (leading-edge genes obtained post-gene set enrichment analyses; p value < 0.05) and all HIV subunit transcripts. Node color represents log2 fold-change between monocultured and co-cultured CD4+ T cells (where orange—vs. green—represents higher expression in monoculture). Edge color (red is positive and blue is negative) represents correlation values (Spearman’s rho) between each node. All correlations used to define edge colors were significant (Spearman’s test; p value < 0.05). Note that “dashed” edges were used to visually emphasize IFN signaling associated genes that directly associated with expression of HIV transcripts. (C) Heatmaps showing Z score row-normalized gene expression of sample level enrichment analysis (SLEA) scores generated using leading-edge genes from transcription factor target genesets (ChEA, chromatin immunoprecipitation enrichment analysis database) that significantly differentiate sorted HIV-infected CD4+ T cells that were either cultured alone (n = 7; orange subset columns) or with autologous HIV-naive CD8+ T cells (n = 7; green subset columns) for 3 days. Gene set enrichment analysis (GSEA) was run on a pre-ranked list of differentially expressed genes (DEGs) (ranking determined by −sign(fold-change) * log(p value)) and was used to determine significant differences (p value < 0.05; FDR < 0.05) and the represented genes were defined by leading-edge analyses. (D) Correlation network showing significant correlations between HIV subunit transcripts and SLEA scores of gene sets associated with cell cycling, metabolism, quiescence and TGF-beta signaling. Circular nodes represent SLEA scores that differentiate HIV-infected CD4+ T cells were either cultured alone (n = 7; orange circles) or with autologous HIV-naive CD8+ T cells (n = 7; green circles) for 3 days. Octagons define HIV subunit nodes. All significant associations (Spearman’s correlation test; p value < 0.05) are represented as edges where blue is negative correlation, while red is positive correlation between HIV subunit transcripts and gene sets. mCD4: memory CD4+ T cells.
Figure 6.
Figure 6.. HIV expression is reactivated after removal of CD8+ T cells from memory CD4:CD8 co-culture
(A) Schematic of the in vitro assay to study the reversibility of the suppression activity exerted by CD8+ T cells. The assay proceeded as reported in Figure 1 until day 3. At the day 3, memory CD4 and CD8 were stained with cell trace violet and cell trace red respectively, before the infection. After the infection, memory CD4 and TCR-activated CD8+ T cells were co-cultured. On day 6, memory CD4 and CD8 mono- and co-culture were isolated by FACS and cultured back in resting conditions (in the presence of IL-2 and saquinavir) and TCR-activating conditions (in the presence of αCD3/CD28, IL-2, and saquinavir) for an additional 3 days. (B and C) The frequency of CD4Gag+ expression was analyzed in memory CD4 monoculture (B, left panel) and memory CD4:CD8+ T cells (C, left panel) from day 6 and following three additional days of cell culture (day 9) in resting (light green bar) and TCR-activating (green bar) conditions (n = 7). In the right panels, the HIV-infected cell frequency, represented as copies of integrated HIV DNA, was measured in memory CD4 monoculture (B) and memory CD4:CD8+ T cells (C) at the day 6 and at the day 9, after 3 days of resting and TCR-activating cell culture (n = 7). mCD4: memory CD4+ T cells. p values from Wilcoxon paired test are indicated, p > 0.05 where not reported. Data are represented as ±SEM.

Similar articles

Cited by

References

    1. Strategies for Management of Antiretroviral Therapy (SMART) Study Group, El-Sadr WM, Lundgren J, Neaton JD, Gordin F, Abrams D, Arduino RC, Babiker A, Burman W, Clumeck N, et al. (2006). CD4+ count-guided interruption of antiretroviral treatment. N. Engl. J. Med 355, 2283–2296. 10.1056/NEJMoa062360. - DOI - PubMed
    1. Siliciano JD, Kajdas J, Finzi D, Quinn TC, Chadwick K, Margolick JB, Kovacs C, Gange SJ, and Siliciano RF (2003). Long-term follow-up studies confirm the stability of the latent reservoir for HIV-1 in resting CD4+ T cells. Nat. Med 9, 727–728. 10.1038/nm880. - DOI - PubMed
    1. Finzi D, Hermankova M, Pierson T, Carruth LM, Buck C, Chaisson RE, Quinn TC, Chadwick K, Margolick J, Brookmeyer R, et al. (1997). Identification of a reservoir for HIV-1 in patients on highly active antiretroviral therapy. Science 278, 1295–1300. - PubMed
    1. Wong JK, Hezareh M, Günthard HF, Havlir DV, Ignacio CC, Spina CA, and Richman DD (1997). Recovery of replication-competent HIV despite prolonged suppression of plasma viremia. Science 273, 1291–1295. - PubMed
    1. Donahue DA, and Wainberg MA (2013). Cellular and molecular mechanisms involved in the establishment of HIV-1 latency. Retrovirology 10, 11. 10.1186/1742-4690-10-11. - DOI - PMC - PubMed

Publication types