. 2023 Apr 20;30(4):362-382.e8.
doi: 10.1016/j.chembiol.2023.03.006. Epub 2023 Apr 7.

Phosphorylation barcodes direct biased chemokine signaling at CXCR3

Affiliations

Phosphorylation barcodes direct biased chemokine signaling at CXCR3

Dylan S Eiger et al. Cell Chem Biol. .

Abstract

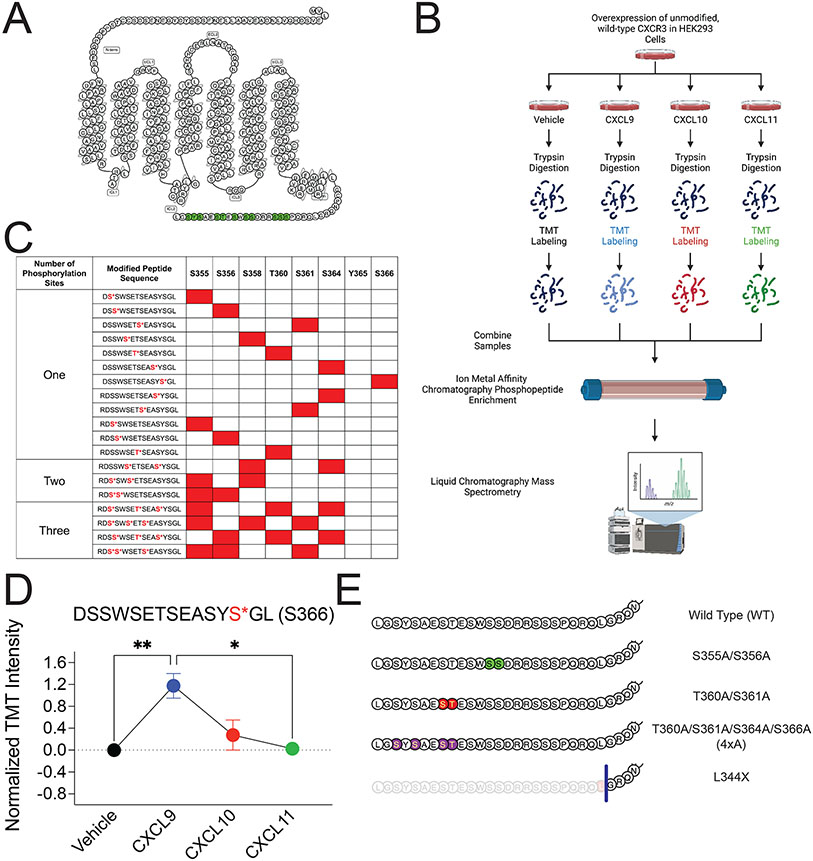
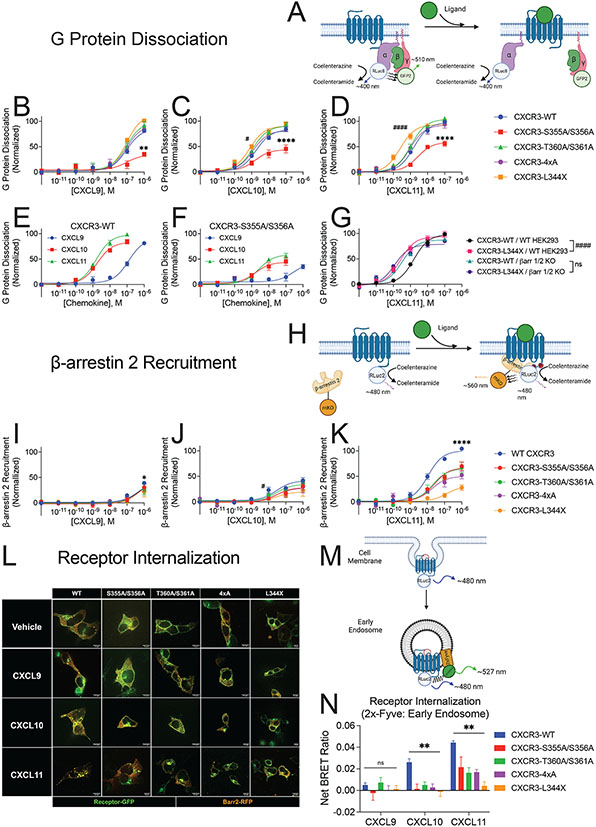
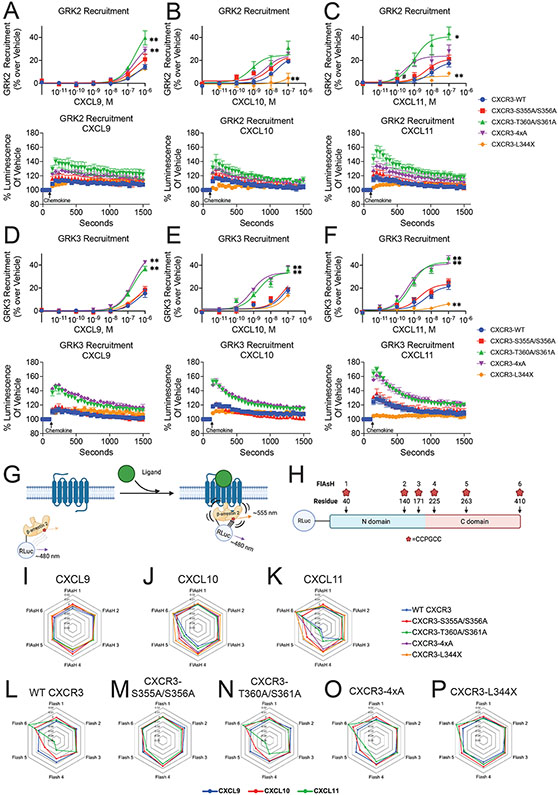
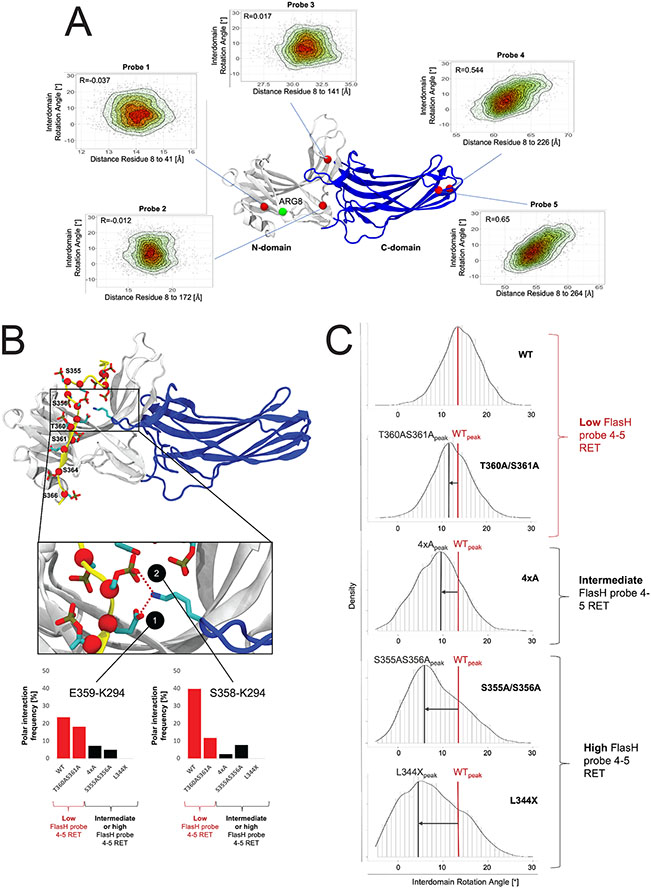
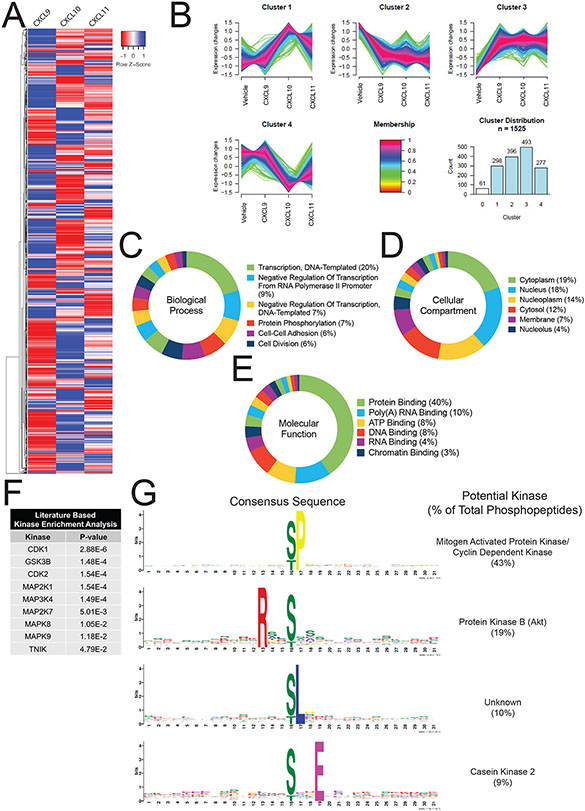
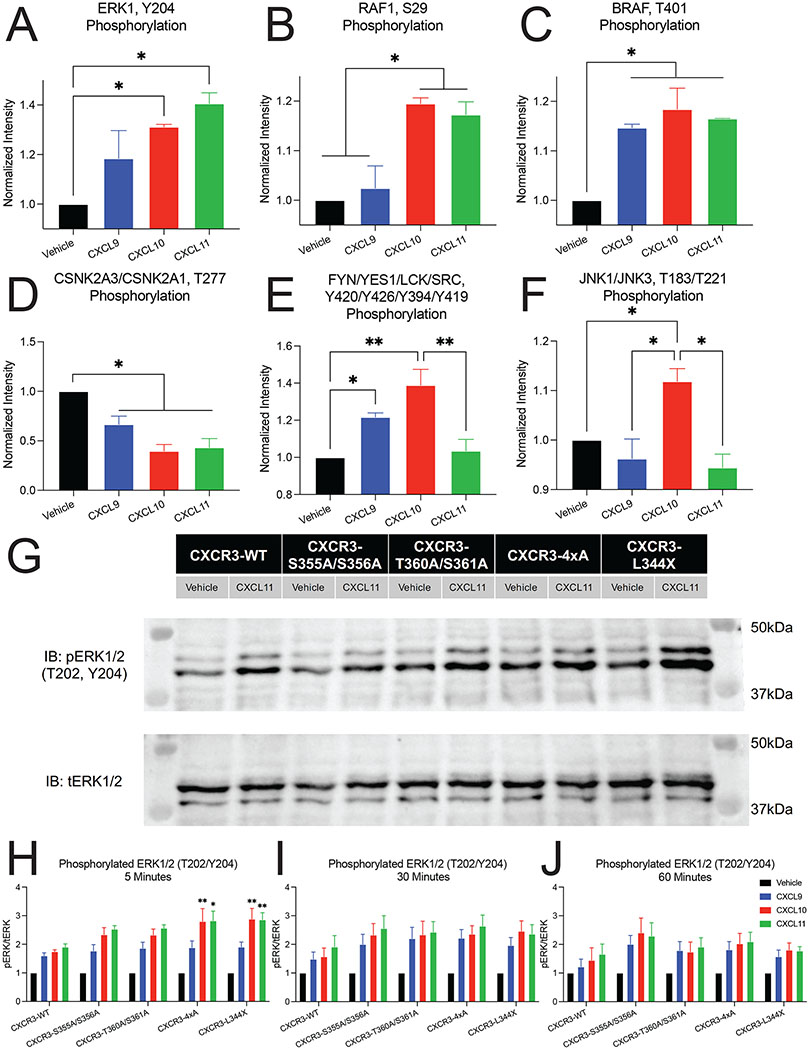
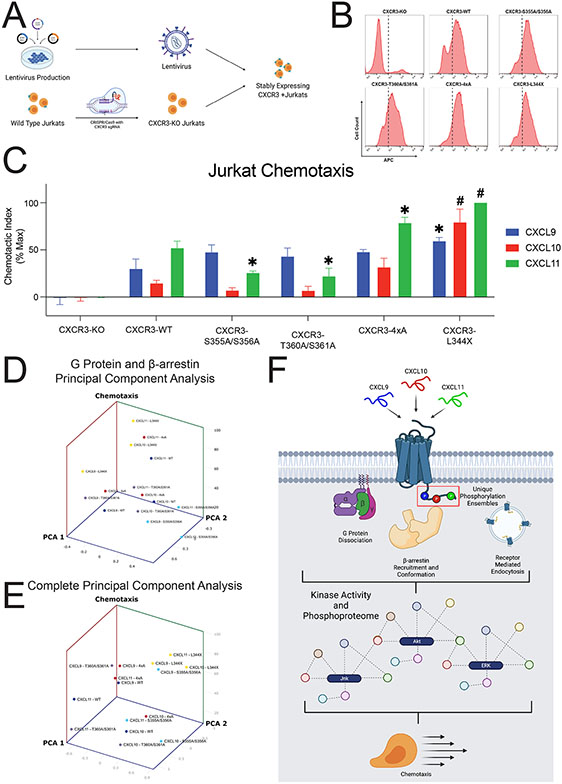
G protein-coupled receptor (GPCR)-biased agonism, selective activation of certain signaling pathways relative to others, is thought to be directed by differential GPCR phosphorylation "barcodes." At chemokine receptors, endogenous chemokines can act as "biased agonists", which may contribute to the limited success when pharmacologically targeting these receptors. Here, mass spectrometry-based global phosphoproteomics revealed that CXCR3 chemokines generate different phosphorylation barcodes associated with differential transducer activation. Chemokine stimulation resulted in distinct changes throughout the kinome in global phosphoproteomics studies. Mutation of CXCR3 phosphosites altered β-arrestin 2 conformation in cellular assays and was consistent with conformational changes observed in molecular dynamics simulations. T cells expressing phosphorylation-deficient CXCR3 mutants resulted in agonist- and receptor-specific chemotactic profiles. Our results demonstrate that CXCR3 chemokines are non-redundant and act as biased agonists through differential encoding of phosphorylation barcodes, leading to distinct physiological processes.

Keywords: CXCR3; G protein-coupled receptor; MAP kinase; biased agonism; chemokine; chemotaxis; mass spectrometry; molecular dynamics; phosphoproteomics; β-arrestin.


Conflict of interest statement

Declaration of interests The authors declare no competing interests.

Figures

Figure 1:
Figure 1:. Detection of CXCR3 C-terminal phosphopeptides using mass spectrometry
(A) Snake diagram of CXCR3 highlighting green putative C-terminal phosphorylation sites. (B) Schematic of experimental design of receptor phosphoproteomic experiment. (C) Singly, doubly, and triply phosphorylated CXCR3 C-terminal peptides identified through mass spectrometry. Identified phosphopeptides are noted in red. (D) Abundance of singly phosphorylated DSSWSETSEASYpSGL peptide measured in HEK293 cells following stimulation with vehicle control or CXCL9, CXCL10, or CXCL11 at 100 nM for 5 minutes. Mean ± SEM, n=2 technical replicates of 6 pooled biological replicates. (E) Diagram of designed CXCR3 phosphorylation-deficient receptor mutants of interest. *P<.05, by one-way ANOVA, Tukey’s post hoc analysis. See S1 for additional mass spectrometry data and signaling and expression data of CXCR3 phosphorylation deficient mutants.
Figure 2:
Figure 2:. G protein dissociation, β-arrestin 2 recruitment, and receptor internalization of CXCR3 and receptor mutants
(A) Schematic of BRET2-based TRUPATH assay to detect G protein dissociation following agonist treatment. (B, C, and D) G protein dissociation of receptors treated with listed chemokine in HEK293 cells. (E and F) G protein dissociation of CXCR3-WT and CXCR3-S355A/S356A in HEK293 cells. (G) G protein dissociation of CXCR3-WT and CXCR3-L344X in wild-type HEK293 cells (WT HEK293) and β-arrestin-1/2 knock out cells (βarr 1/2 KO). (H) Schematic of BRET assay to detect β-arrestin 2 recruitment to the receptor. (I, J, and K) β-arrestin 2 recruitment of receptors treated with listed chemokine in HEK293 cells. (L) Representative confocal microscopy images of HEK293 cells transfected with receptor-GFP and β-arrestin 2-RFP following the indicated treatment for 45 minutes. Images are representative of three biological replicates. (M) Schematic of BRET assay to detect receptor internalization to endosomes. (N) BRET data of receptor internalization following stimulation with the listed chemokine. Data are the average of Net BRET values from 20-30 minutes following ligand stimulation. For (A-G) TRUPATH assays, data shown are the mean ± SEM of BRET values 5 to 10 minutes following ligand stimulation, n=3. * denotes statistically significant differences between Emax of specified receptor and CXCR3-WT. # denotes statistically significant differences between EC50 of specified receptor and CXCR3-WT. For β-arrestin 2 recruitment, data shown are the mean ± SEM of BRET values 2 to 5 minutes following ligand stimulation, n=3. *denotes statistically significant differences between EMax of CXCR3-WT and all other receptors at CXCL11, and of CXCR3-WT and CXCR3-4xA at CXCL9. # denotes statistically significant differences between EC50 of CXCR3-WT and CXCR3-S355A/S356A at CXCL10. For internalization BRET assays (N), data are the mean ± SEM of BRET values 20-30 minutes following 100 nM ligand stimulation, n=4. *P<.05 by two-way ANOVA, Dunnett’s post hoc testing between CXCR3-WT and all other receptor mutants. See S2 and S3 for further data assessing G protein dissociation, β-arrestin 2 recruitment, and receptor internalization.
Figure 3:
Figure 3:. GRK Recruitment and β-arrestin 2 conformational dynamics
Agonist dose-dependent data and kinetic data of saturating chemokine treatment of (A-C) GRK2 and (D-F) GRK3 recruitment to receptor as measured by luminescence from split nanoluciferase complementation of receptor and kinase. Data are grouped by treatment condition. Mean ± SEM of luminescence 2 to 5 minutes following ligand stimulation, n=3-4. Kinetic data are of the maximum dose of chemokine studied. (G) Schematic of FlAsH assay to detect β-arrestin 2 conformational dynamics following receptor stimulation using intramolecular BRET. (H) Location of N-terminal RLuc and CCPGCC FlAsH-EDT2 binding motifs on β-arrestin 2. (I-K) Radar plots of FlAsH 1-6 grouped by treatment. (L-P) Radar plots of FlAsH 1-6 grouped by receptor. Mean, n=5. For FlAsH BRET (I-P), data is the average of five consecutive reads taken approximately 10 minutes after adding chemokine (100 nM). See S4-S5 for additional GRK recruitment data and S6 for raw FlAsH data.
Figure 4:
Figure 4:. Impact of the phosphorylation pattern on β-arrestin 2 conformational dynamics
(A) Heat scatter plots of the interdomain rotation angle of β-arrestin 2 (a measure of activation) and probe distances (probe 1 to 5) to the RLuc domain. The interdomain rotation angles and corresponding probe distances have been computed for simulation frames sampling β-arrestin 2 inactivation. A structural model of the construct used in the FlAsH BRET conformational assay (N-domain in grey and the C-domain in blue) highlights the positions of probes 1-5 (red spheres) and the N-terminal end (residue 8 in our model) used as an approximation for the RLuc attachment at the N-terminal end of β-arrestin 2 (green spheres), as the Rluc domain is absent in the simulated system. (B) Binding mode of the CXCR3 WT C-tail to β-arrestin 2. Negatively charged residues (Asp, Glu or phosphorylated Ser and Thr) on the C-tail are depicted in licorice and their Cα atoms are highlighted with red spheres. Positions mutated within this study are labeled. The inset provides a detailed depiction of the lariat loop region of β-arrestin 2 (blue) and interactions with negatively charged residues of the C-tail. Bar charts demonstrate the stability of polar interactions between K294 of the lariat loop and S358 and E359 of the C-tail during MD simulations. In the bar plots, systems with a low FlasH probe 4-5 resonance energy transfer (RET) are colored in red (WT and T360AS361A). System with an intermediate or high FlasH probe 4-5 RET are colored in black (4xA, S355A/S356A, L344X). (C) Distribution plots of the interdomain rotation angles of β-arrestin 2 in complex with C-tail mutants. The distribution of the interdomain rotation angles have been computed over the accumulated simulation frames for β-arrestin 2 in complex with C-tail of the WT versus mutants. The peaks of the plots indicate the most explored conformations for the WT system (WTpeak) versus mutant systems (e.g. L344Xpeak). Systems are grouped based on probe 4-5 RET. Intermediate and high probe 4-5 RET goes along with a shift of the distribution peak to lower rotation angles compared to the WT system (low probe 4-5 RET).
Figure 5:
Figure 5:. Characterization of the global phosphoproteome in HEK293 cells treated with endogenous CXCR3 agonist
(A) HEK293 cells expressing CXCR3-WT were stimulated with vehicle control or chemokine (100 nM) for 5 minutes. Heat map of statistically significant phosphopeptides normalized to vehicle control are shown. N=2 technical replicates of six pooled biological replicates. (B) Cluster analysis of significant phosphopeptides using GproX. Cluster 0 is not shown for clarity due to low membership count. (C-E) Gene Ontology analysis of significant phosphopeptides as grouped by biological process, cellular compartment, or molecular function, respectively. Top Gene Ontology Terms and percentiles of number of individual phosphopeptides present in term are shown. (F) Manually curated, literature-based kinase enrichment analyses to predict kinase activity based on significant phosphopeptides using Kinase Enrichment Analysis 2. (G) Consensus sequences of significant phosphopeptides in the dataset as generated using MoMo from MeMe suite and identified kinases with listed consensus motif based on manual literature review. See S7 for additional global phosphoproteomic data.
Figure 6:
Figure 6:. Differential regulation of kinases by biased ligands and phosphodeficient receptors
Biased phosphorylation of various kinases identified from the global phosphoproteomics data including (A) ERK1, (B) RAF1, (C) BRAF, (D) Casein kinase 2 (CSNK2A3/CSNK2A1), (E) Src family of protein tyrosine kinases (FYN/YES1/LCK/SRC), and (F) JNKs (JNK1/JNK3). Data is normalized to vehicle treatment and n=2 technical replicates of six pooled biological replicates. Mean ± SEM. *P<.05 by one-way ANOVA, Tukey’s post hoc testing. (G) Representative western blot of phosphorylated ERK1/2 (pERK 1/2) and total ERK1/2 (tERK 1/2) following stimulation with vehicle control or 100 nM of CXCL11 for 5 minutes. (H-J) Quantification of western blots of pERK1/2 levels at 5, 30, and 60 minutes after chemokine treatment (100 nM). Mean ± SEM, n=4. *P<.05 by two-way ANOVA, Dunnet’s post hoc testing denotes comparisons between a specific ligand/receptor combination to the same ligand at CXCR3-WT. See S8 for quantification of western blots grouped by receptor.
Figure 7:
Figure 7:. Jurkat chemotaxis and model of the phosphorylation barcode
(A) Schematic of lentiviral production carrying cDNA for CXCR3-WT or one of the four receptor mutants, generation of CXCR3-KO Jurkats using CRISPR/Cas9, and creation of stably expressing CXCR3 Jurkats. (B) Surface expression of CXCR3-KO Jurkats or five various Jurkat cell lines transduced with lentivirus carrying the listed receptor cDNA as measured with flow cytometry. Dotted line denotes a fluorescence intensity of 102. For transduced cells, cells with a fluorescence intensity greater than 102 were sorted for chemotaxis experiments. (C) Jurkat chemotaxis for each receptor/ligand combination. Jurkat cells were serum starved for four hours and then allowed to migrate towards the indicated chemokine (10nM) for five hours. Mean ± SEM, n=4. *P<.05 by two-way ANOVA, Tukey’s post hoc testing denotes comparisons between a specific ligand/receptor combination to the same ligand at CXCR3-WT. (D) Principal Component Analysis of G Protein activation and β-arrestin 2 recruitment versus chemotaxis. (E) Principal Component Analysis of G Protein activation, β-arrestin 2 recruitment, GRK2 and GRK3 recruitment, and FlAsH versus chemotaxis. See S9 for chemotaxis data grouped by receptor and univariate analyses. (F) Working model for biased ligand generation of unique barcode ensembles which differentially regulate G protein signaling, β-arrestin recruitment and conformation, receptor endocytosis, kinase activity, the global phosphoproteome, and cellular functions such as chemotaxis.

Update of

References

    1. Hauser AS, Attwood MM, Rask-Andersen M, Schioth HB, and Gloriam DE (2017). Trends in GPCR drug discovery: new agents, targets and indications. Nat Rev Drug Discov 16, 829–842. 10.1038/nrd.2017.178. - DOI - PMC - PubMed
    1. Smith JS, and Rajagopal S (2016). The beta-Arrestins: Multifunctional Regulators of G Protein-coupled Receptors. J Biol Chem 291, 8969–8977. 10.1074/jbc.R115.713313. - DOI - PMC - PubMed
    1. Pupo AS, Duarte DA, Lima V, Teixeira LB, Parreiras ESLT, and Costa-Neto CM (2016). Recent updates on GPCR biased agonism. Pharmacol Res 112, 49–57. 10.1016/j.phrs.2016.01.031. - DOI - PubMed
    1. Nobles KN, Xiao K, Ahn S, Shukla AK, Lam CM, Rajagopal S, Strachan RT, Huang TY, Bressler EA, Hara MR, et al. (2011). Distinct phosphorylation sites on the beta(2)-adrenergic receptor establish a barcode that encodes differential functions of beta-arrestin. Sci Signal 4, ra51. 10.1126/scisignal.2001707. - DOI - PMC - PubMed
    1. Butcher AJ, Prihandoko R, Kong KC, McWilliams P, Edwards JM, Bottrill A, Mistry S, and Tobin AB (2011). Differential G-protein-coupled receptor phosphorylation provides evidence for a signaling bar code. J Biol Chem 286, 11506–11518. 10.1074/jbc.M110.154526. - DOI - PMC - PubMed

Publication types

LinkOut - more resources