. 2023 Apr 18;4(4):101017.
doi: 10.1016/j.xcrm.2023.101017. Epub 2023 Mar 27.

Robust SARS-CoV-2 T cell responses with common TCRαβ motifs toward COVID-19 vaccines in patients with hematological malignancy impacting B cells

Affiliations

Robust SARS-CoV-2 T cell responses with common TCRαβ motifs toward COVID-19 vaccines in patients with hematological malignancy impacting B cells

Thi H O Nguyen et al. Cell Rep Med. .

Abstract

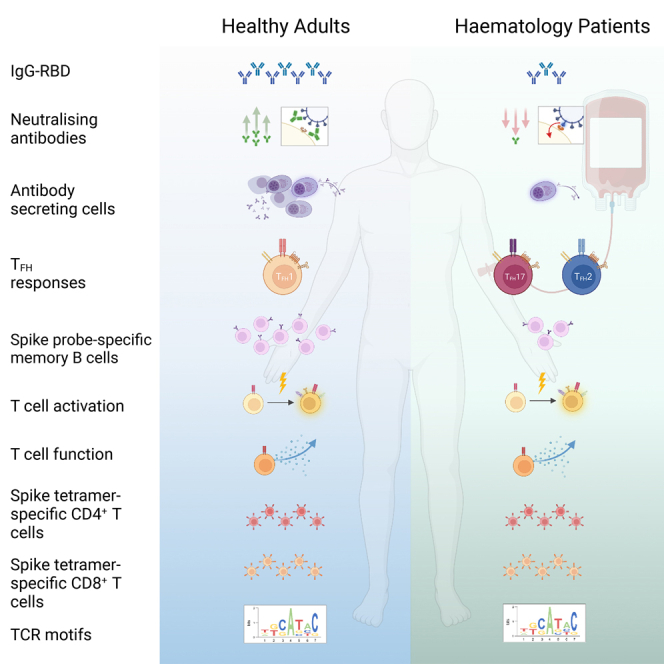
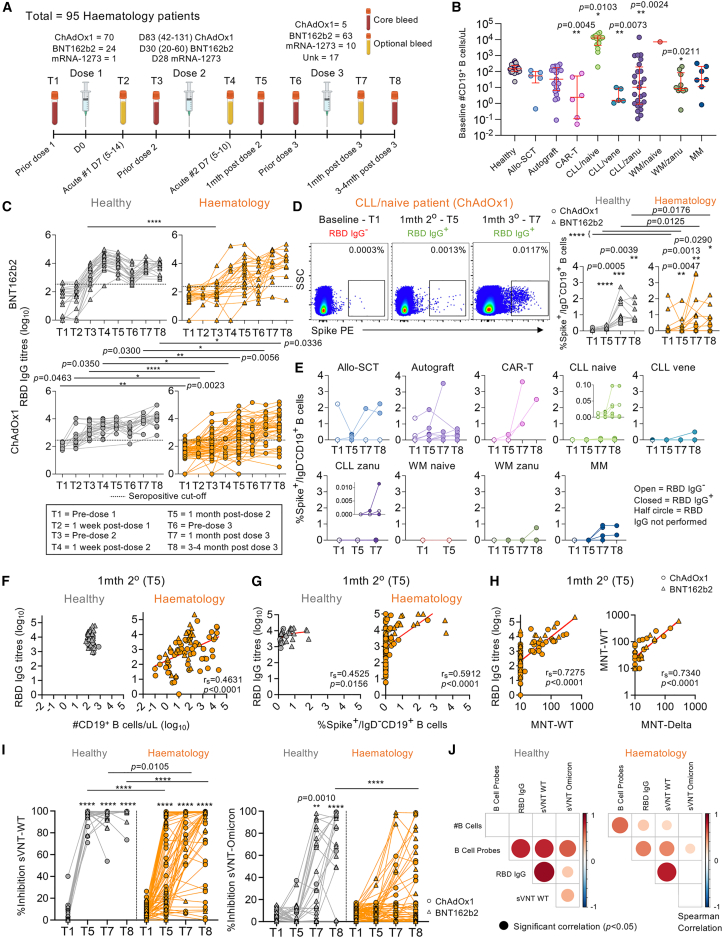
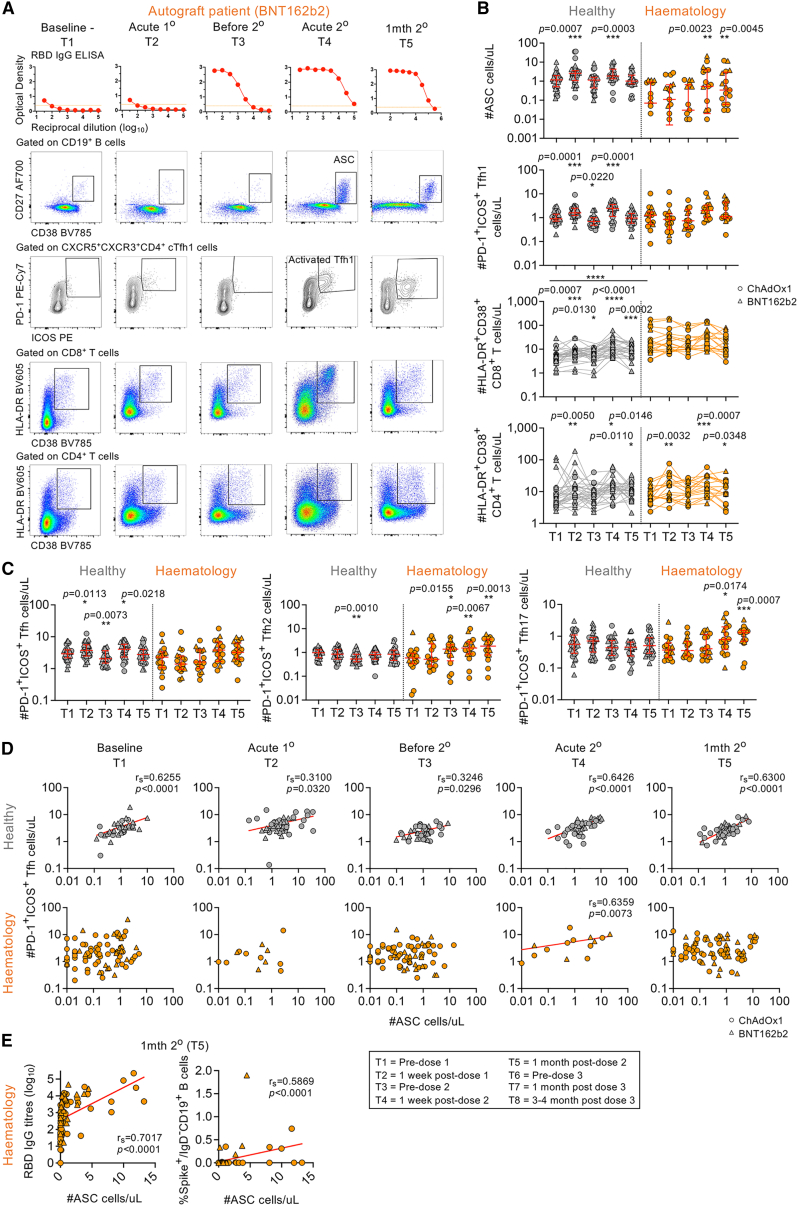
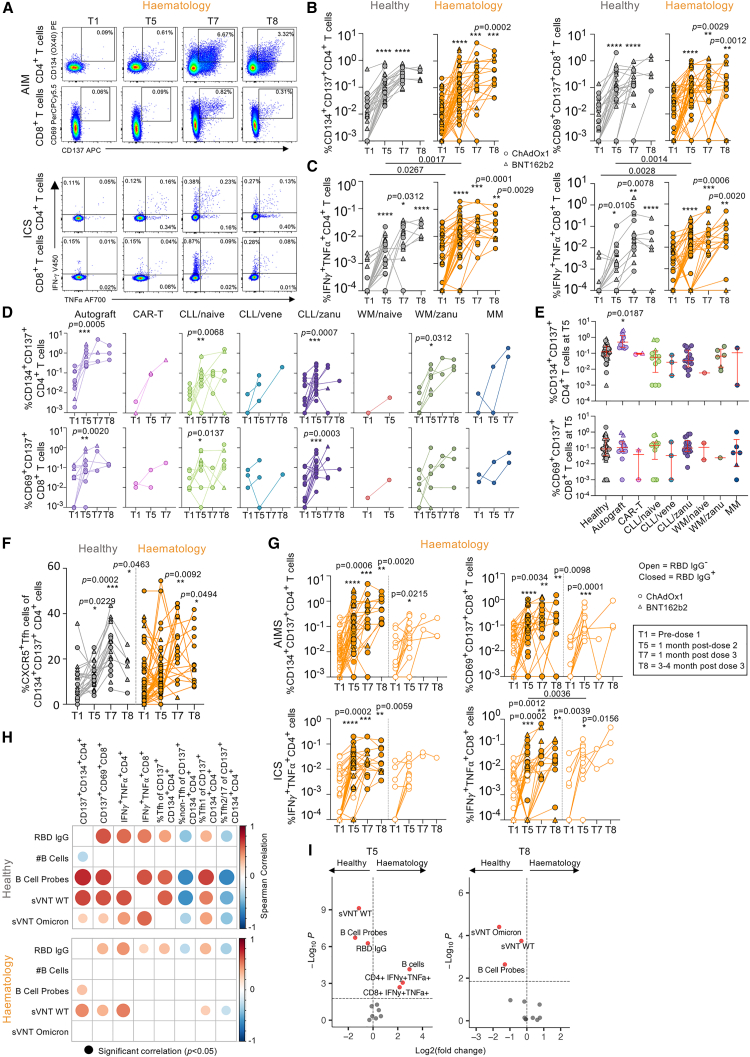
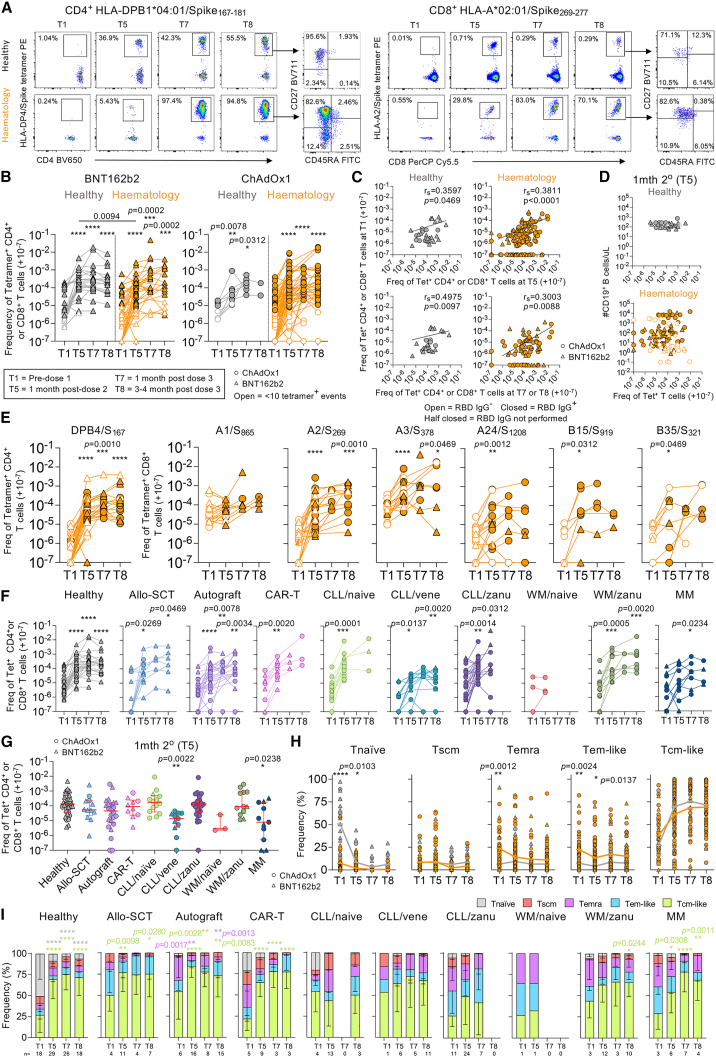
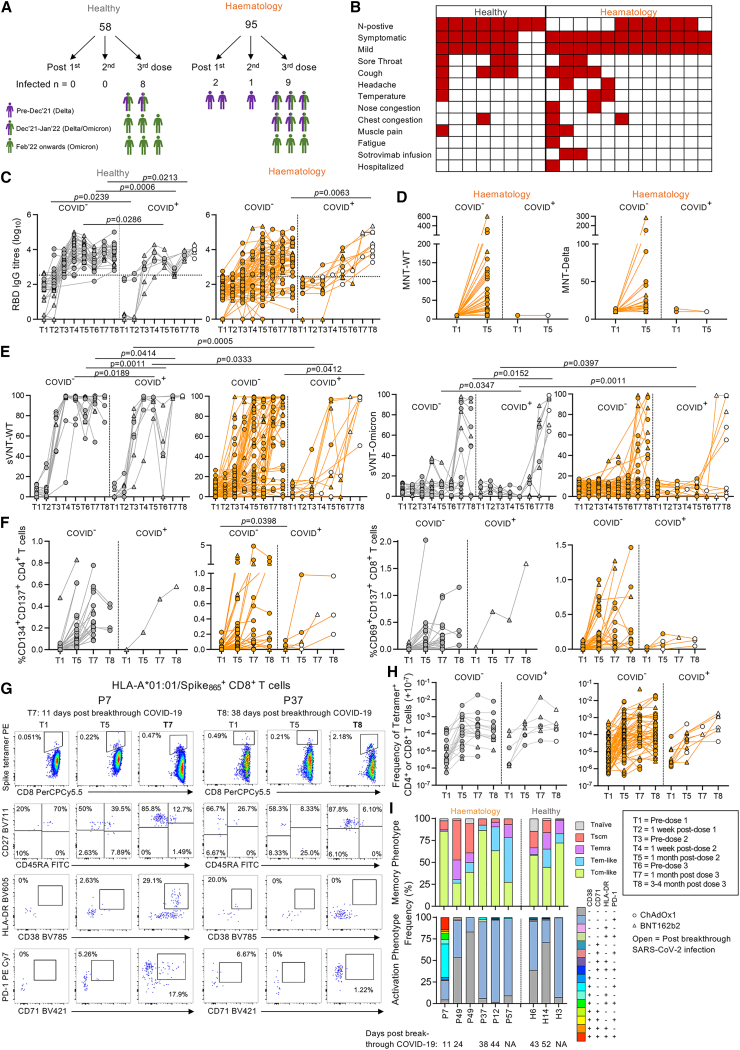
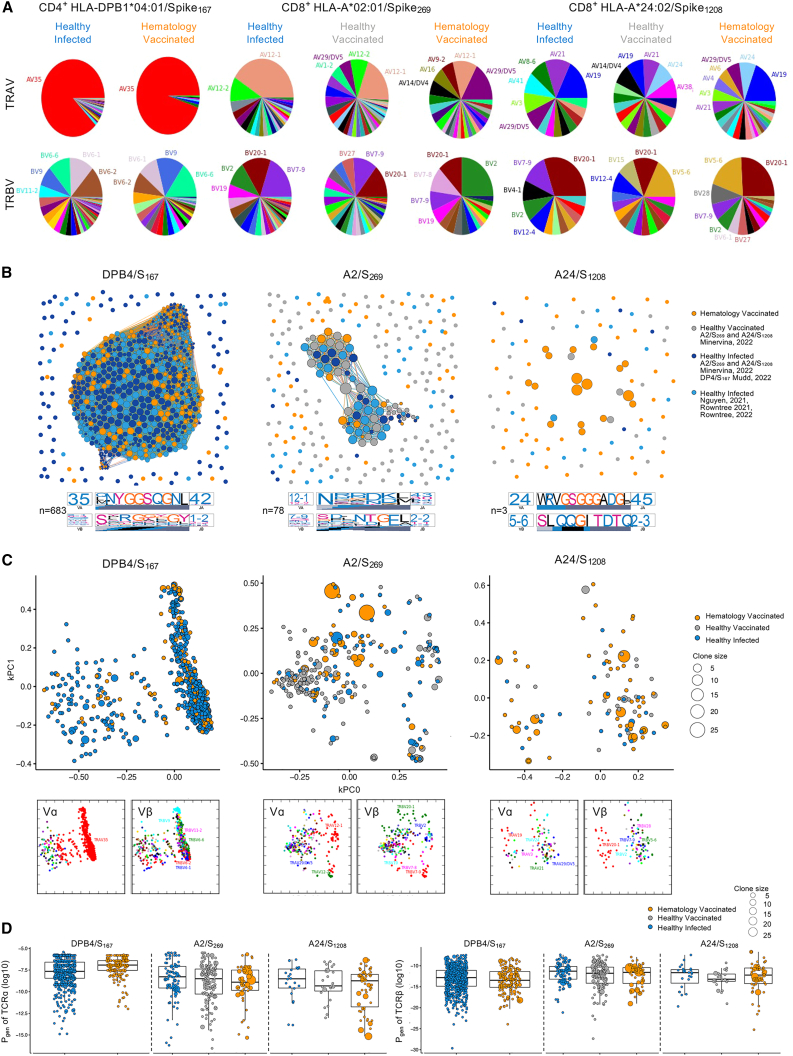
Immunocompromised hematology patients are vulnerable to severe COVID-19 and respond poorly to vaccination. Relative deficits in immunity are, however, unclear, especially after 3 vaccine doses. We evaluated immune responses in hematology patients across three COVID-19 vaccination doses. Seropositivity was low after a first dose of BNT162b2 and ChAdOx1 (∼26%), increased to 59%-75% after a second dose, and increased to 85% after a third dose. While prototypical antibody-secreting cells (ASCs) and T follicular helper (Tfh) cell responses were elicited in healthy participants, hematology patients showed prolonged ASCs and skewed Tfh2/17 responses. Importantly, vaccine-induced expansions of spike-specific and peptide-HLA tetramer-specific CD4+/CD8+ T cells, together with their T cell receptor (TCR) repertoires, were robust in hematology patients, irrespective of B cell numbers, and comparable to healthy participants. Vaccinated patients with breakthrough infections developed higher antibody responses, while T cell responses were comparable to healthy groups. COVID-19 vaccination induces robust T cell immunity in hematology patients of varying diseases and treatments irrespective of B cell numbers and antibody response.

Keywords: B cells; CD4(+) T cells; CD8(+) T cells; COVID-19 vaccines; SARS-CoV-2; T follicular helper cells; antibody-secreting cells; hematology; memory T cells; tetramer-specific.


Conflict of interest statement

Declaration of interests The Icahn School of Medicine at Mount Sinai has filed patent applications relating to SARS-CoV-2 serological assays and NDV-based SARS-CoV-2 vaccines, which list F.K. as co-inventor. Mount Sinai has spun out a company, Kantaro, to market serological tests for SARS-CoV-2. F.K. has consulted for Merck and Pfizer (before 2020) and is currently consulting for Pfizer, Seqirus, and Avimex. The Krammer laboratory is also collaborating with Pfizer on animal models of SARS-CoV-2. H.A.M. and B.Y.C. are currently consulting for Ena Respiratory. B.W.T. has received research funding from MSD, Seqirus, and Sanofi and is on the advisory board for Moderna, CSL-Behring, and Takeda.

Figures

None
Graphical abstract
Figure 1
Figure 1
RBD-specific IgG antibodies, neutralizing antibodies, and memory spike-specific B cell responses following COVID-19 vaccination (A) Study design and sampling timepoints. (B) B cell numbers per μL with median and interquartile range (IQR) shown (hematology n = 94; healthy n = 39). Statistical significance determined by Dunn’s multiple comparisons set on healthy versus all other disease groups. (C) Endpoint IgG titers of ancestral RBD antibodies (hematology n = 94, 24 BNT162b2, 70 ChAdOx1; healthy n = 53, 27 BNT162b2, 26 ChAdOx1). Seropositive cutoff defined by baseline mean + 2 SD per group. (D and E) Spike-probe staining of spike-specific memory B cells in (D) healthy (n = 16) and hematology groups (n = 64) and (E) per malignancy and treatment groups. (F and G) Spearman’s correlation (rs) of RBD IgG titers with (F) B cell numbers (hematology n = 82; healthy n = 45) and (G) spike-specific memory B cells (hematology n = 64; healthy n = 16). (H) rs of RBD IgG titers with ancestral MNT and ancestral versus Delta MNT (hematology n = 82). (I) Percentage sVNT inhibition assay against wild-type (WT) ancestral and Omicron strains (haematology n = 63; healthy n = 29). (J) rs matrix of B cell and antibody parameters at T1/T5/T7/T8. Statistical significance determined by Wilcoxon test for time point comparisons against T1 or by Mann-Whitney for comparisons between healthy and patient time points. ∗∗∗∗p < 0.0001. Experiments were performed once for each sample. Refer to Figure S2A.
Figure 2
Figure 2
Whole-blood analyses of acute ASC, Tfh cell, and activated CD8+ and CD4+ T cell responses (A) RBD IgG ELISA titration curves and fluorescence-activated cell sorting (FACS) plots of ASCs and activated Tfh1/CD8+/CD4+ T cells. Orange dotted lines indicate endpoint titer cutoffs. (B) Numbers of ASCs and activated Tfh1 cells and CD8+ and CD4+ T cells per μL (hematology n = 17; healthy n = 39). (C) Numbers of Tfh, Tfh2, and Tfh17 subsets per μL. (D) rs of ASCs and activated Tfh1 cells per time point T1–T5 (T1/T3/T5 hematology n = 94; T2/T4 hematology n = 17). Statistical significance determined by Wilcoxon test for time point comparisons against T1 (floating values) or by Mann-Whitney for comparisons between healthy and patient time points (connecting line). ∗∗∗∗p < 0.0001. Experiments were performed once for each sample. Refer to Figures S2B and S3. Zero data points not shown but included in statistics.
Figure 3
Figure 3
Comparable spike-specific CD4+ and CD8+ T cell responses between hematology patients and healthy individuals (A) AIM and ICS FACS plots. (B and C) AIM (B) and ICS (C) frequencies of CD4+ and CD8+ T cells in healthy (n = 35, 23 BNT162b2, 12 ChAdOx1) and hematology groups (n = 56, 8 BNT162b2, 48 ChAdOx1). (D and E) AIM frequency (D) per malignancy and treatment group and (E) at T5 where median and IQR are shown. Statistical significance determined by Dunn’s multiple comparisons set on healthy versus all other disease groups. (F) CXCR5+CD4+ Tfh response of total CD134+CD137+ CD4+ T cells. (G) AIM and ICS frequency between IgG RBD+ and RBD patients. (H) rs matrix of antibody/B cell and T cell responses. (I) Volcano plots at T5 and T8 comparing healthy individuals and hematology patients. Statistical significance determined by Wilcoxon test for time point comparisons against T1 (floating values) or by Mann-Whitney for comparisons between healthy and patient time points (connecting line). ∗∗∗∗p < 0.0001. Experiments were performed once for each sample. Refer to Figures S2C, S2D, and S4–S6.
Figure 4
Figure 4
COVID-19 vaccination induces expansion of SARS-CoV-2-specific tetramer+ T cell responses (A) FACS plots of TAME-enriched CD4+ and CD8+ tetramer populations. (B) Tetramer CD4+ and CD8+ T cell frequencies of healthy (n = 16, ChAdOx1 = 4, BNT162b2 = 12) and hematology groups (n = 54, ChAdOx1 = 35, BNT162b2 = 19) per vaccine type. Any samples with <10 tetramer+ events are shown as open symbols. 1–3 tetramer responses shown per donor. (C) rs of T1 tetramer frequencies versus T5 or T7/T8. (D) rs of tetramer frequencies versus B cell numbers at T5. (E–G) Tetramer frequencies per (E) epitope, (F) malignancy and immunosuppressive treatment, or (G) at T5 where median and IQR are shown. (H) Phenotype frequencies of tetramer+ cells from healthy (gray line) and hematology patients (orange line). (I) Tetramer+ phenotype per malignancy and immunosuppressive treatment. The frequency of tetramer+ cells are right shifted by 10−7 (i.e., no detected tetramer+ events displayed as 10−7). Only samples with 10 or more tetramer+ events are included for (H) and (I). Statistical significance determined by Wilcoxon test for time point comparisons against T1 (floating values); Mann-Whitney for comparisons between healthy and patient timepoints (connecting line); (G) Dunn’s multiple comparisons set on healthy versus all other disease groups; and (H) Sidak’s multiple comparison test and (I) Dunnett’s multiple comparison test for time point comparisons against T1. ∗∗∗∗p < 0.0001. Experiments were performed once for each sample. Refer to Figures S2E and S7.
Figure 5
Figure 5
Vaccine responses between non-COVID-19 and breakthrough COVID-19 (A) COVID-19 following SARS-CoV-2 vaccination. (B) Clinical symptoms and monoclonal antibody treatment for SARS-CoV-2 breakthrough infections. (C) Endpoint IgG titers of ancestral RBD antibodies (44 COVID and 8 COVID+ healthy individuals; 83 COVID and 12 COVID+ patients). Seropositive cutoff defined by baseline mean + 2 SD per group. (D) MNT titers at T5 against WT ancestral and Delta strains (74 COVID and 2 COVID+ patients). (E) Percentage of inhibition by sVNT assay against WT ancestral and Omicron strains (44 COVID and 8 COVID+ healthy individuals; 83 COVID and 12 COVID+ patients). (F) AIM between COVID and COVID+ groups (33 COVID and 1 COVID+ healthy individuals; 51 COVID and 5 COVID+ patients). (G) TAME-enriched FACS plots depicting tetramer and memory and activation phenotypes. (H) Tetramer frequencies between COVID and COVID+ groups (12 COVID and 3 COVID+ healthy individuals; 49 COVID and 5 COVID+ patients). 1–2 tetramer responses per donor. (I) CD8+tetramer+ phenotypes from individuals with breakthrough COVID-19. The frequency of tetramer+ cells has been right shifted by 10−7 (i.e., no detected tetramer+ events displayed as 10−7). Statistical significance determined by Mann-Whitney for comparisons between COVID and COVID+ time points (connecting line). ∗∗∗∗p < 0.0001. Experiments were performed once for each sample. Refer to Figures S8 and S9.
Figure 6
Figure 6
TCR sequence similarity network identifies sharing of dominant motifs between the groups (A) Pie charts of TRAV and TRBV usage for TCRαβ clonotypes specific to DPB4/S167 (n = 18 patients), A2/S269 (n = 18 patients), and A24/S1208 (n = 13 patients). Clonally expanded TCRs were reduced to a single data point for this analysis. (B) TCRαβ sequence similarity networks. Each vertex is a different clonotype, and edges connect clonotypes with highly similar amino acid TCRαβ sequences (TCR distance [TCRdist] ≤ 120). Size of the vertex is proportional to number of neighbors. TCRdist sequence logos for TCRα and TCRβ chains are shown for central largest cluster for each panel. Each TCR motif depicts the V (left side) and J (right side) gene frequencies, the CDR3 amino acid sequence (middle), and the inferred rearrangement structure (bottom bars colored by source region; V-region, light gray; insertions, blue; diversity [D]-region, black; and J-region dark gray). (C) TCR landscapes displayed using kernel principal-component analysis (PCA) projections. Vα/Vβ usage shown below. (D) Pgen for TCRα and TCRβ. Boxplots represent the median (middle bar), 75% quantile (upper hinge), and 25% quantile (lower hinge), with whiskers extending 1.5 times the IQR. Experiments were performed once for each sample. Refer to Figures S10 and S11.

References

    1. Sharma A., Bhatt N.S., St Martin A., Abid M.B., Bloomquist J., Chemaly R.F., Dandoy C., Gauthier J., Gowda L., Perales M.A., et al. Clinical characteristics and outcomes of COVID-19 in haematopoietic stem-cell transplantation recipients: an observational cohort study. Lancet. Haematol. 2021;8:e185–e193. doi: 10.1016/S2352-3026(20)30429-4. - DOI - PMC - PubMed
    1. Wood W.A., Neuberg D.S., Thompson J.C., Tallman M.S., Sekeres M.A., Sehn L.H., Anderson K.C., Goldberg A.D., Pennell N.A., Niemeyer C.M., et al. Outcomes of patients with hematologic malignancies and COVID-19: a report from the ASH research collaborative data hub. Blood Adv. 2020;4:5966–5975. doi: 10.1182/bloodadvances.2020003170. - DOI - PMC - PubMed
    1. Hirsch H.H., Martino R., Ward K.N., Boeckh M., Einsele H., Ljungman P. Fourth European Conference on Infections in Leukaemia (ECIL-4): guidelines for diagnosis and treatment of human respiratory syncytial virus, parainfluenza virus, metapneumovirus, rhinovirus, and coronavirus. Clin. Infect. Dis. 2013;56:258–266. doi: 10.1093/cid/cis844. - DOI - PMC - PubMed
    1. Mato A.R., Roeker L.E., Lamanna N., Allan J.N., Leslie L., Pagel J.M., Patel K., Osterborg A., Wojenski D., Kamdar M., et al. Outcomes of COVID-19 in patients with CLL: a multicenter international experience. Blood. 2020;136:1134–1143. doi: 10.1182/blood.2020006965. - DOI - PMC - PubMed
    1. Chari A., Samur M.K., Martinez-Lopez J., Cook G., Biran N., Yong K., Hungria V., Engelhardt M., Gay F., García Feria A., et al. Clinical features associated with COVID-19 outcome in multiple myeloma: first results from the International Myeloma Society data set. Blood. 2020;136:3033–3040. doi: 10.1182/blood.2020008150. - DOI - PMC - PubMed

Publication types

Substances

LinkOut - more resources