. 2023 Aug;152(2):486-499.e7.
doi: 10.1016/j.jaci.2023.03.029. Epub 2023 Apr 7.

Development of mouse models with restricted HLA-B∗57:01 presentation for the study of flucloxacillin-driven T-cell activation and tolerance in liver injury

Affiliations

Development of mouse models with restricted HLA-B∗57:01 presentation for the study of flucloxacillin-driven T-cell activation and tolerance in liver injury

Suryatheja Ananthula et al. J Allergy Clin Immunol. 2023 Aug.

Abstract

Background: Flucloxacillin (FLX)-induced liver injury is immune-mediated and highly associated to HLA-B∗57:01 expression. Host factors leading to drug-induced liver injury are not yet well understood.

Objective: Characterize in vivo immune mechanisms determining the development of CD8+ T cells reactive to FLX in animals expressing the risk human leukocyte antigen (HLA) allotype.

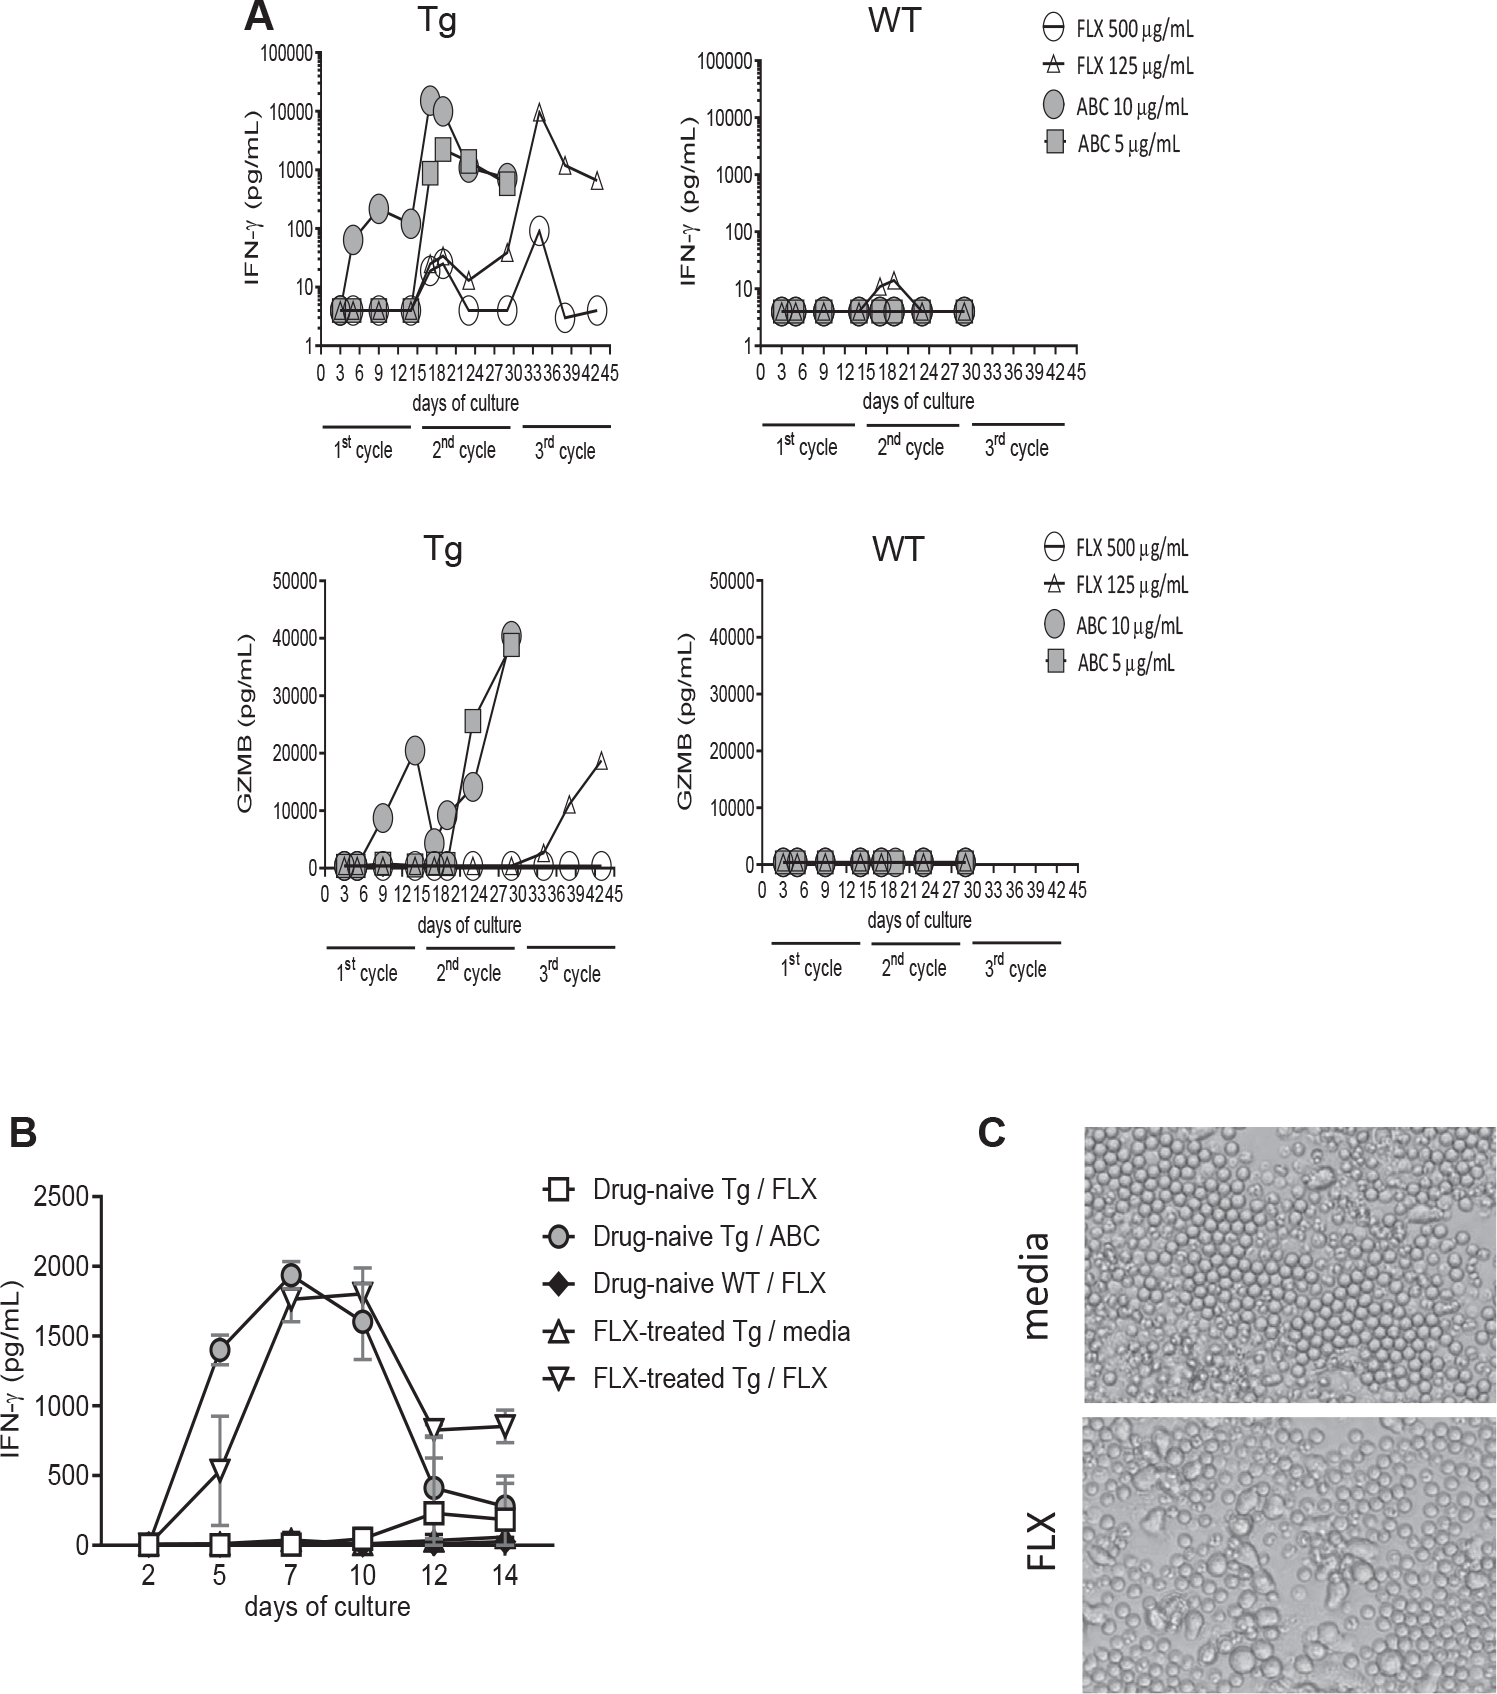
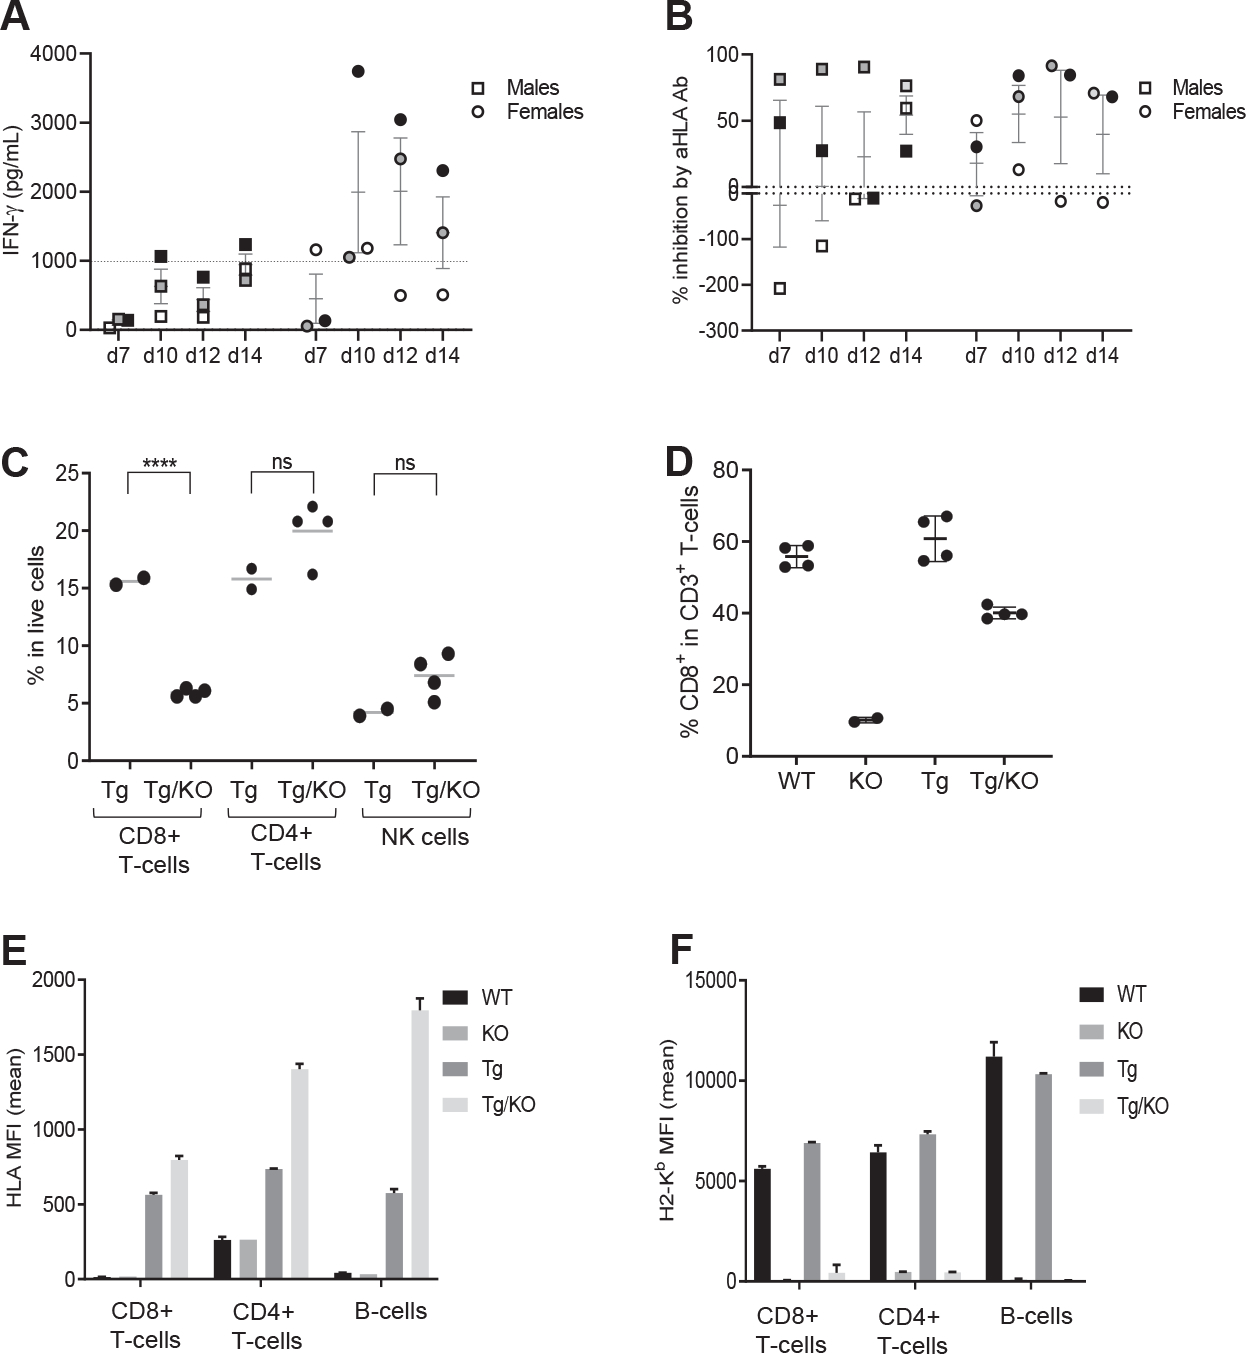
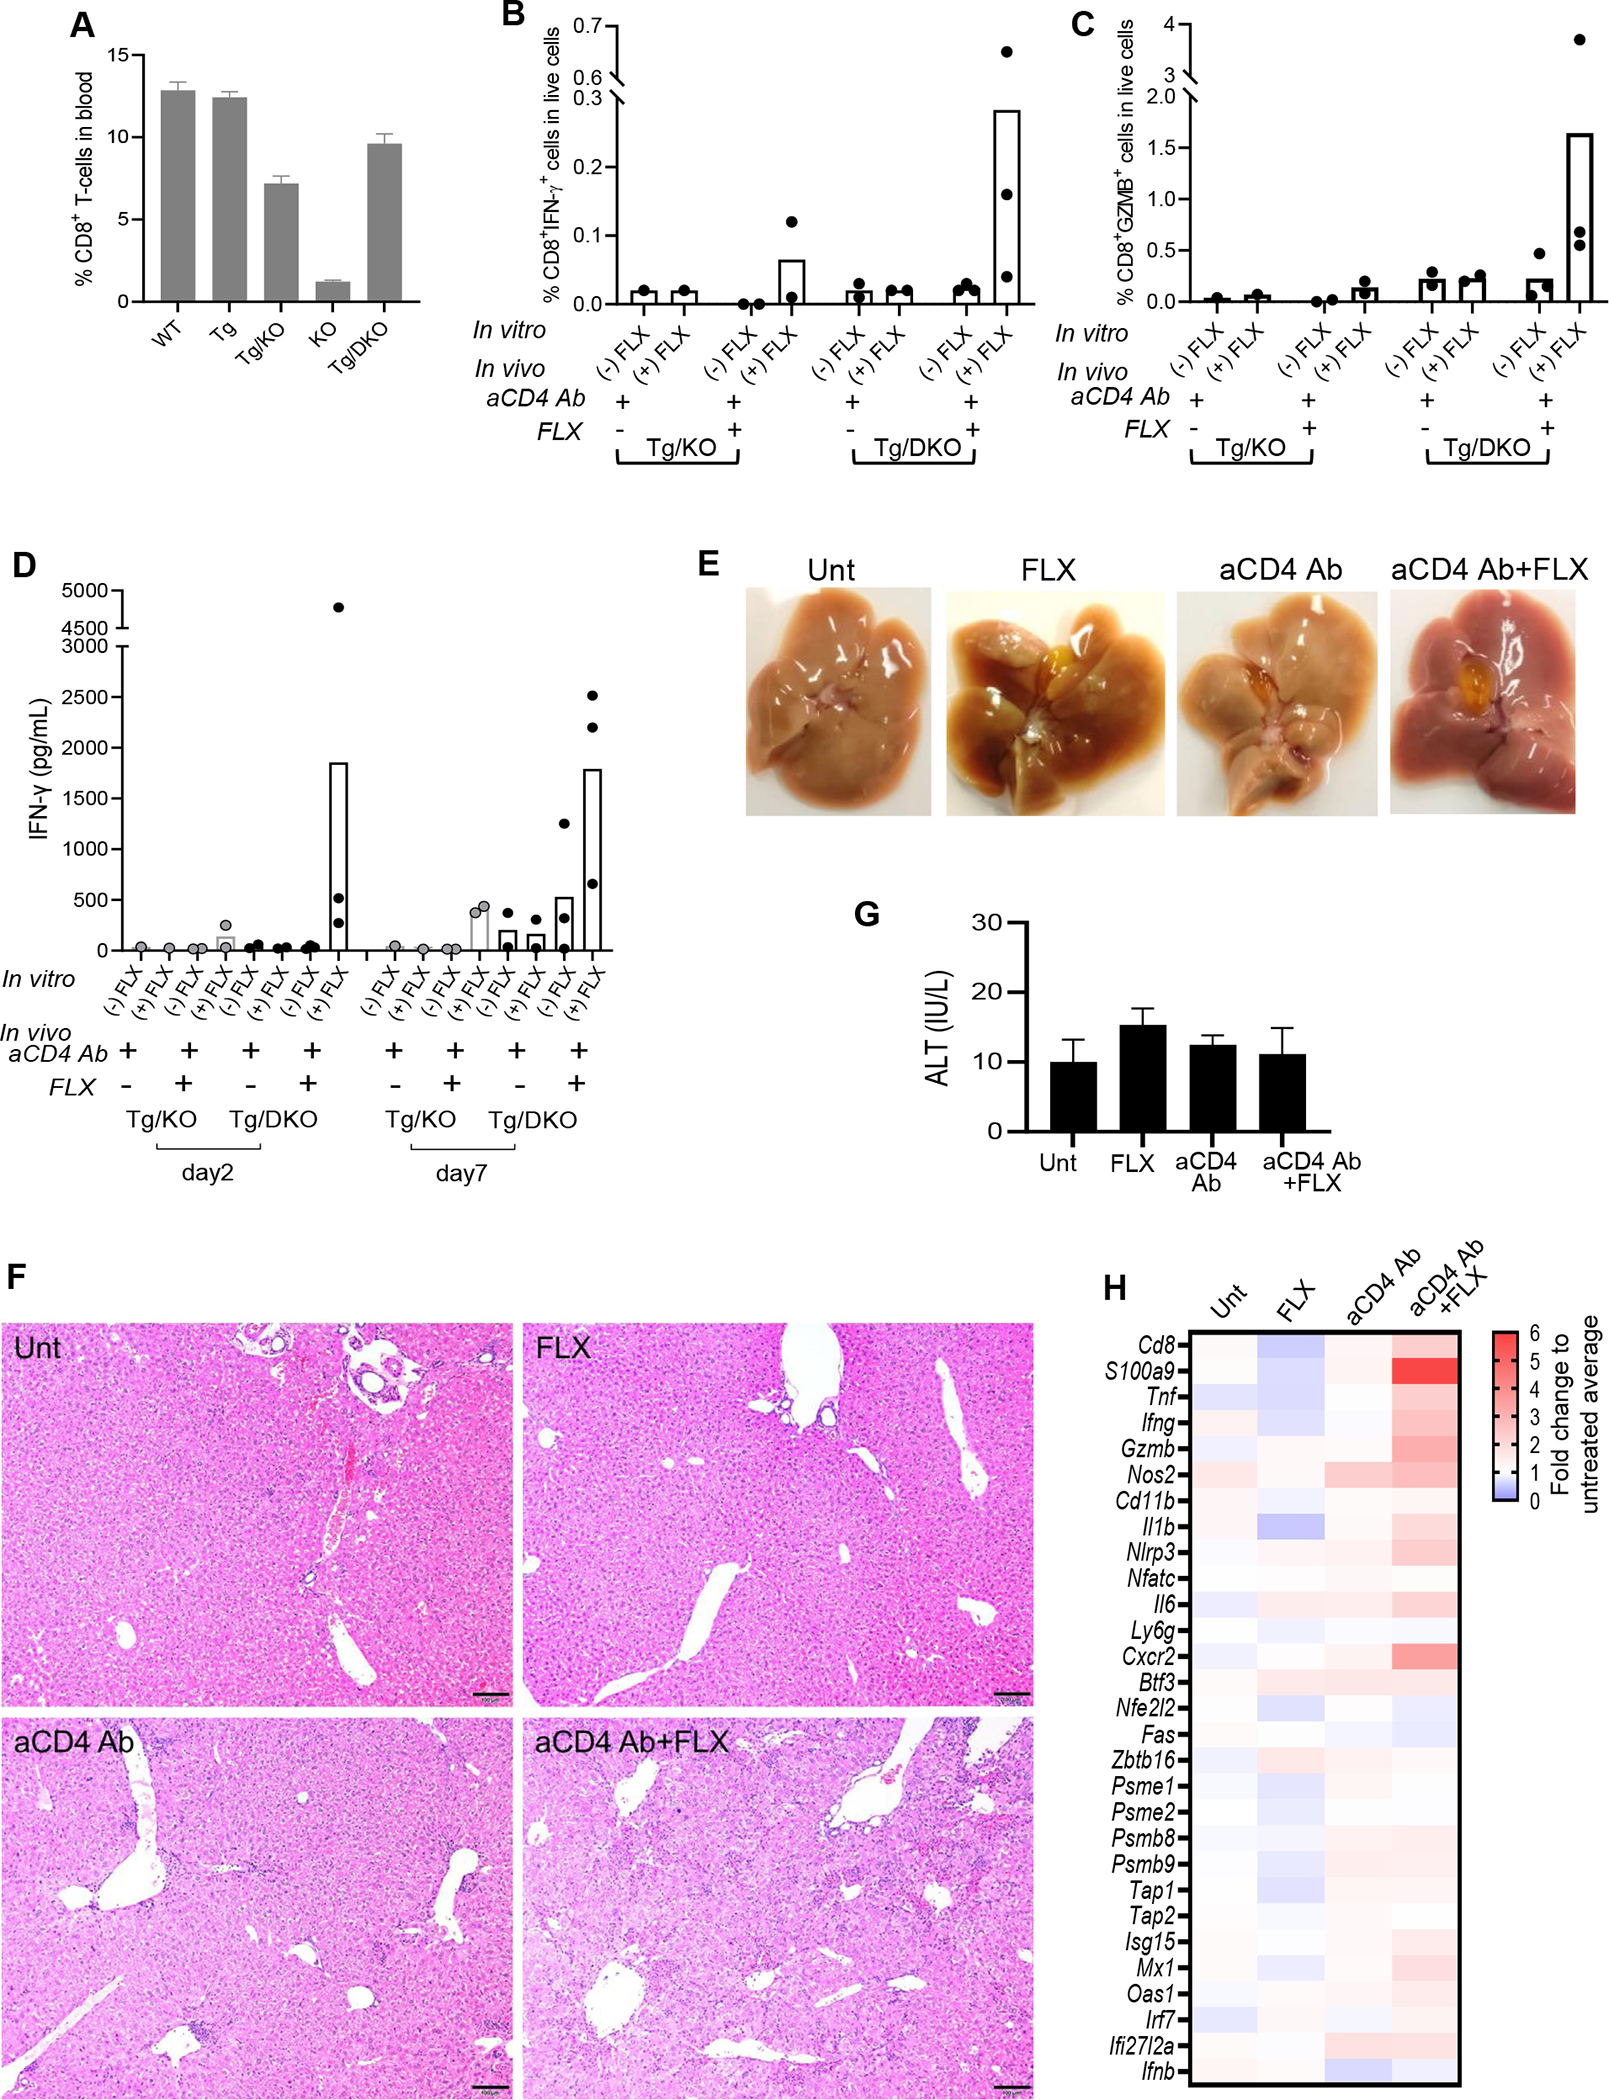
Methods: HLA-B∗57:01 transgenic mice (Tg) or Tg strains with H2-KbDb knockout (Tg/KO) or H2-KbDb/PD-1 double knockout (Tg/DKO) were treated with drug and/or anti-CD4 antibody. Drug-induced liver injury was evaluated on the basis of liver enzyme and histologic changes at day 10 of treatment. FLX-reactive CD8+ T cells were characterized in vitro by release of effector molecules on drug restimulation, gene expression, and flow cytometry analysis, and functionality tested for hepatic cytotoxicity.

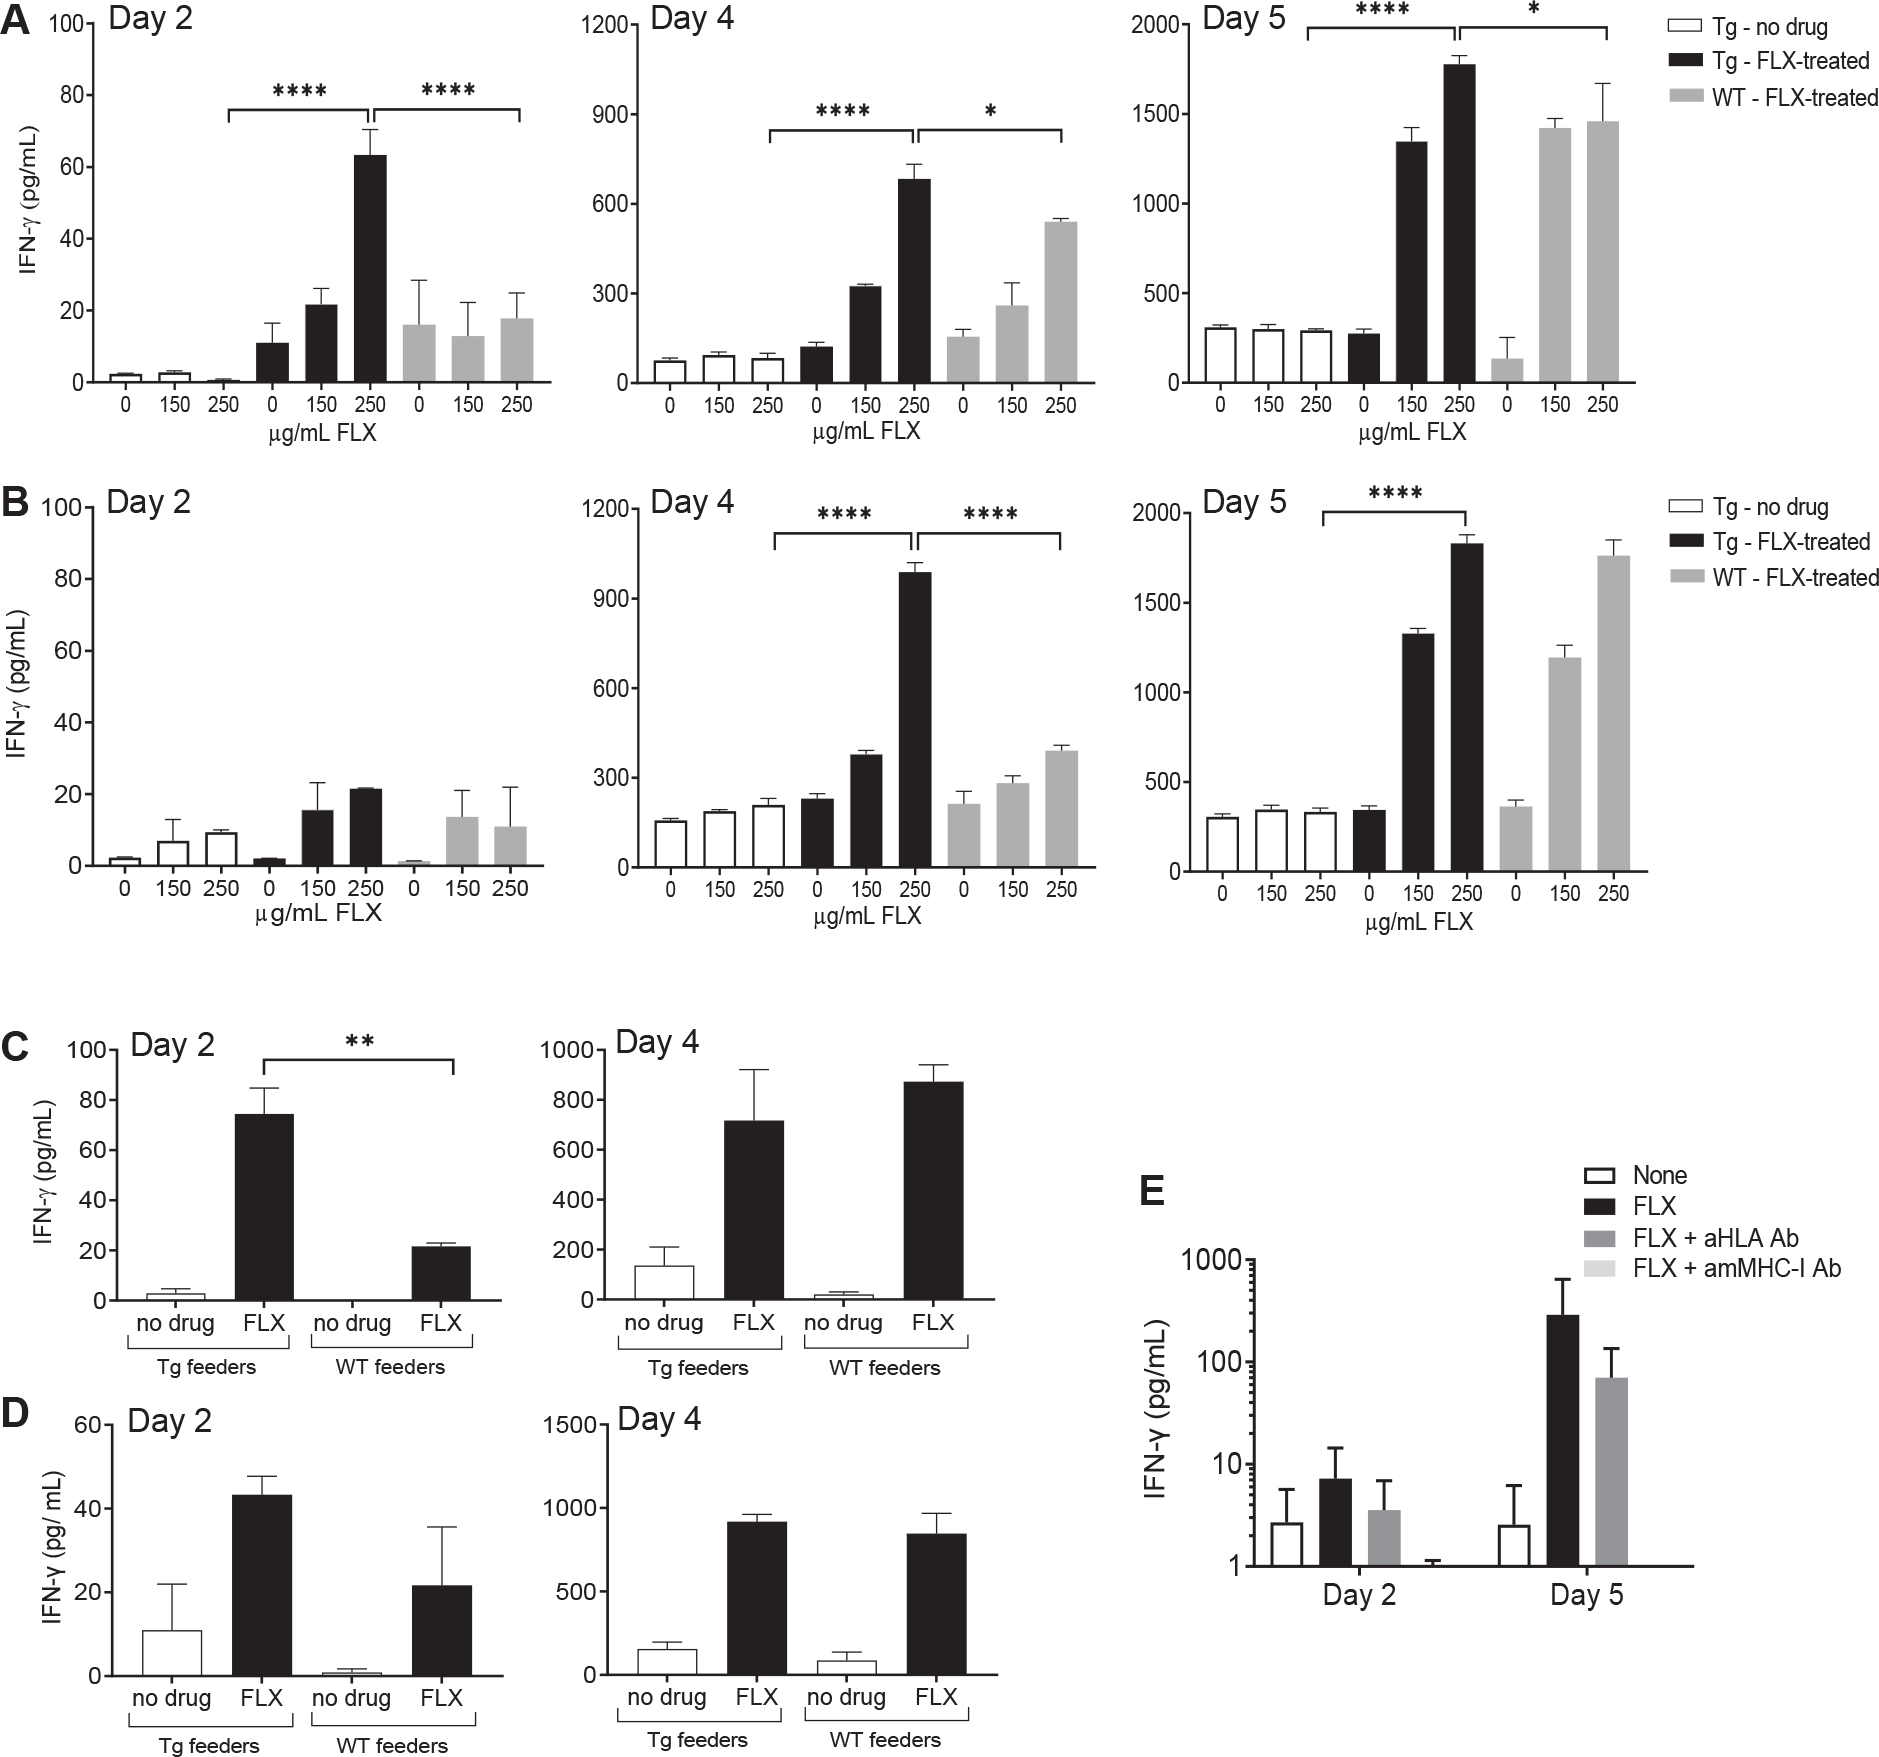
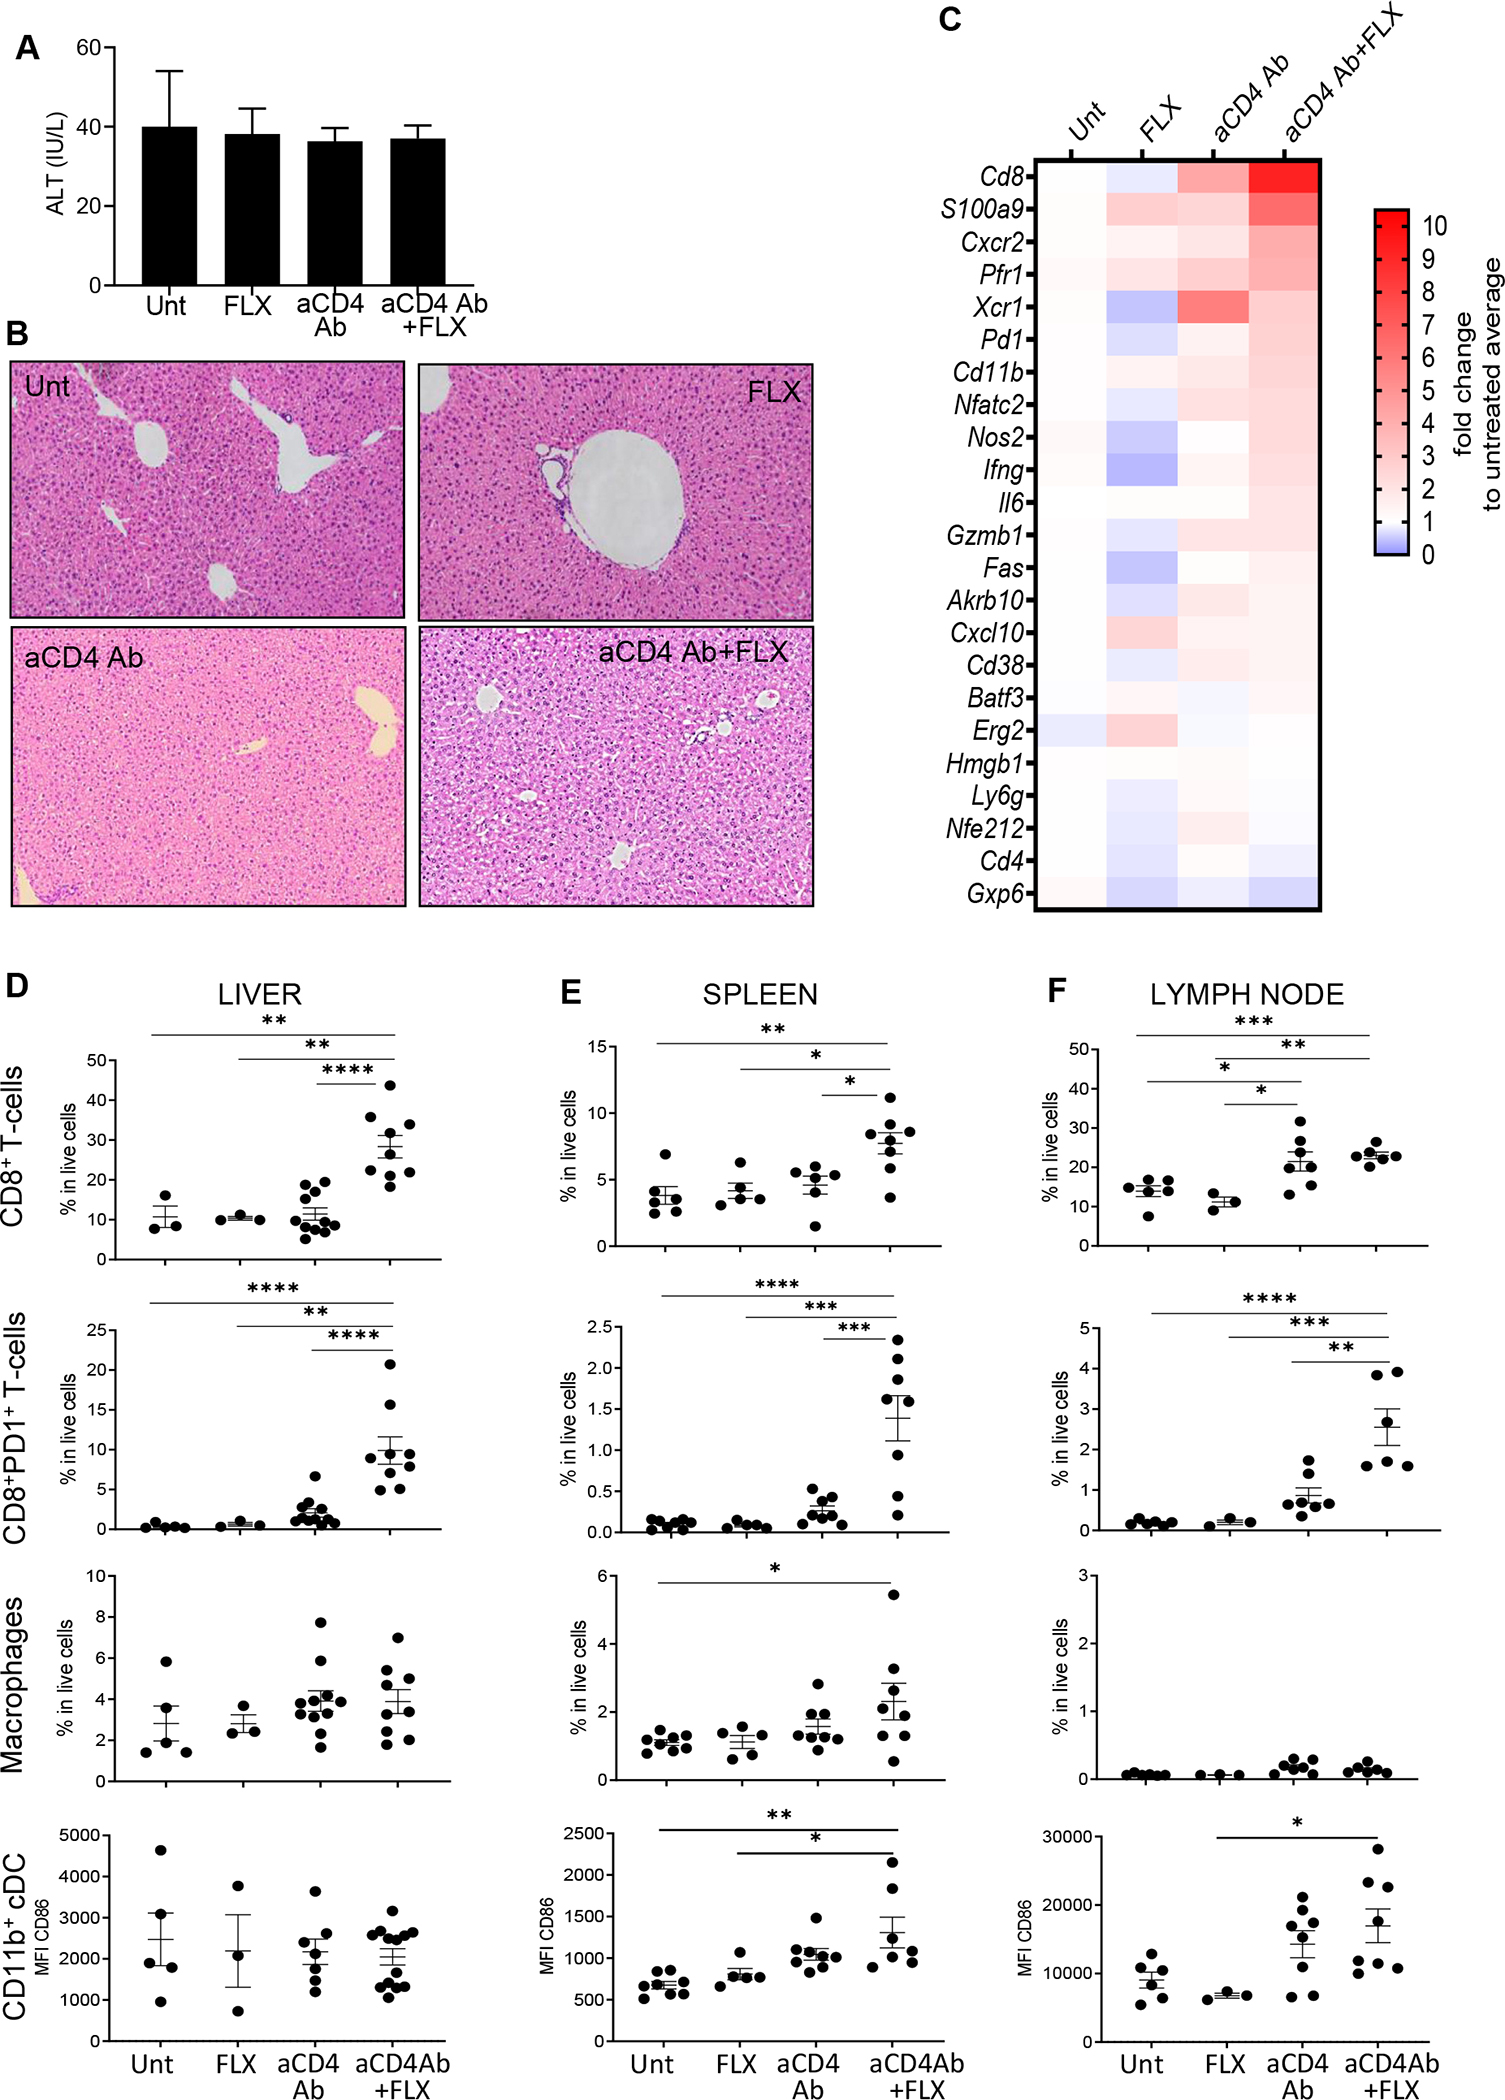
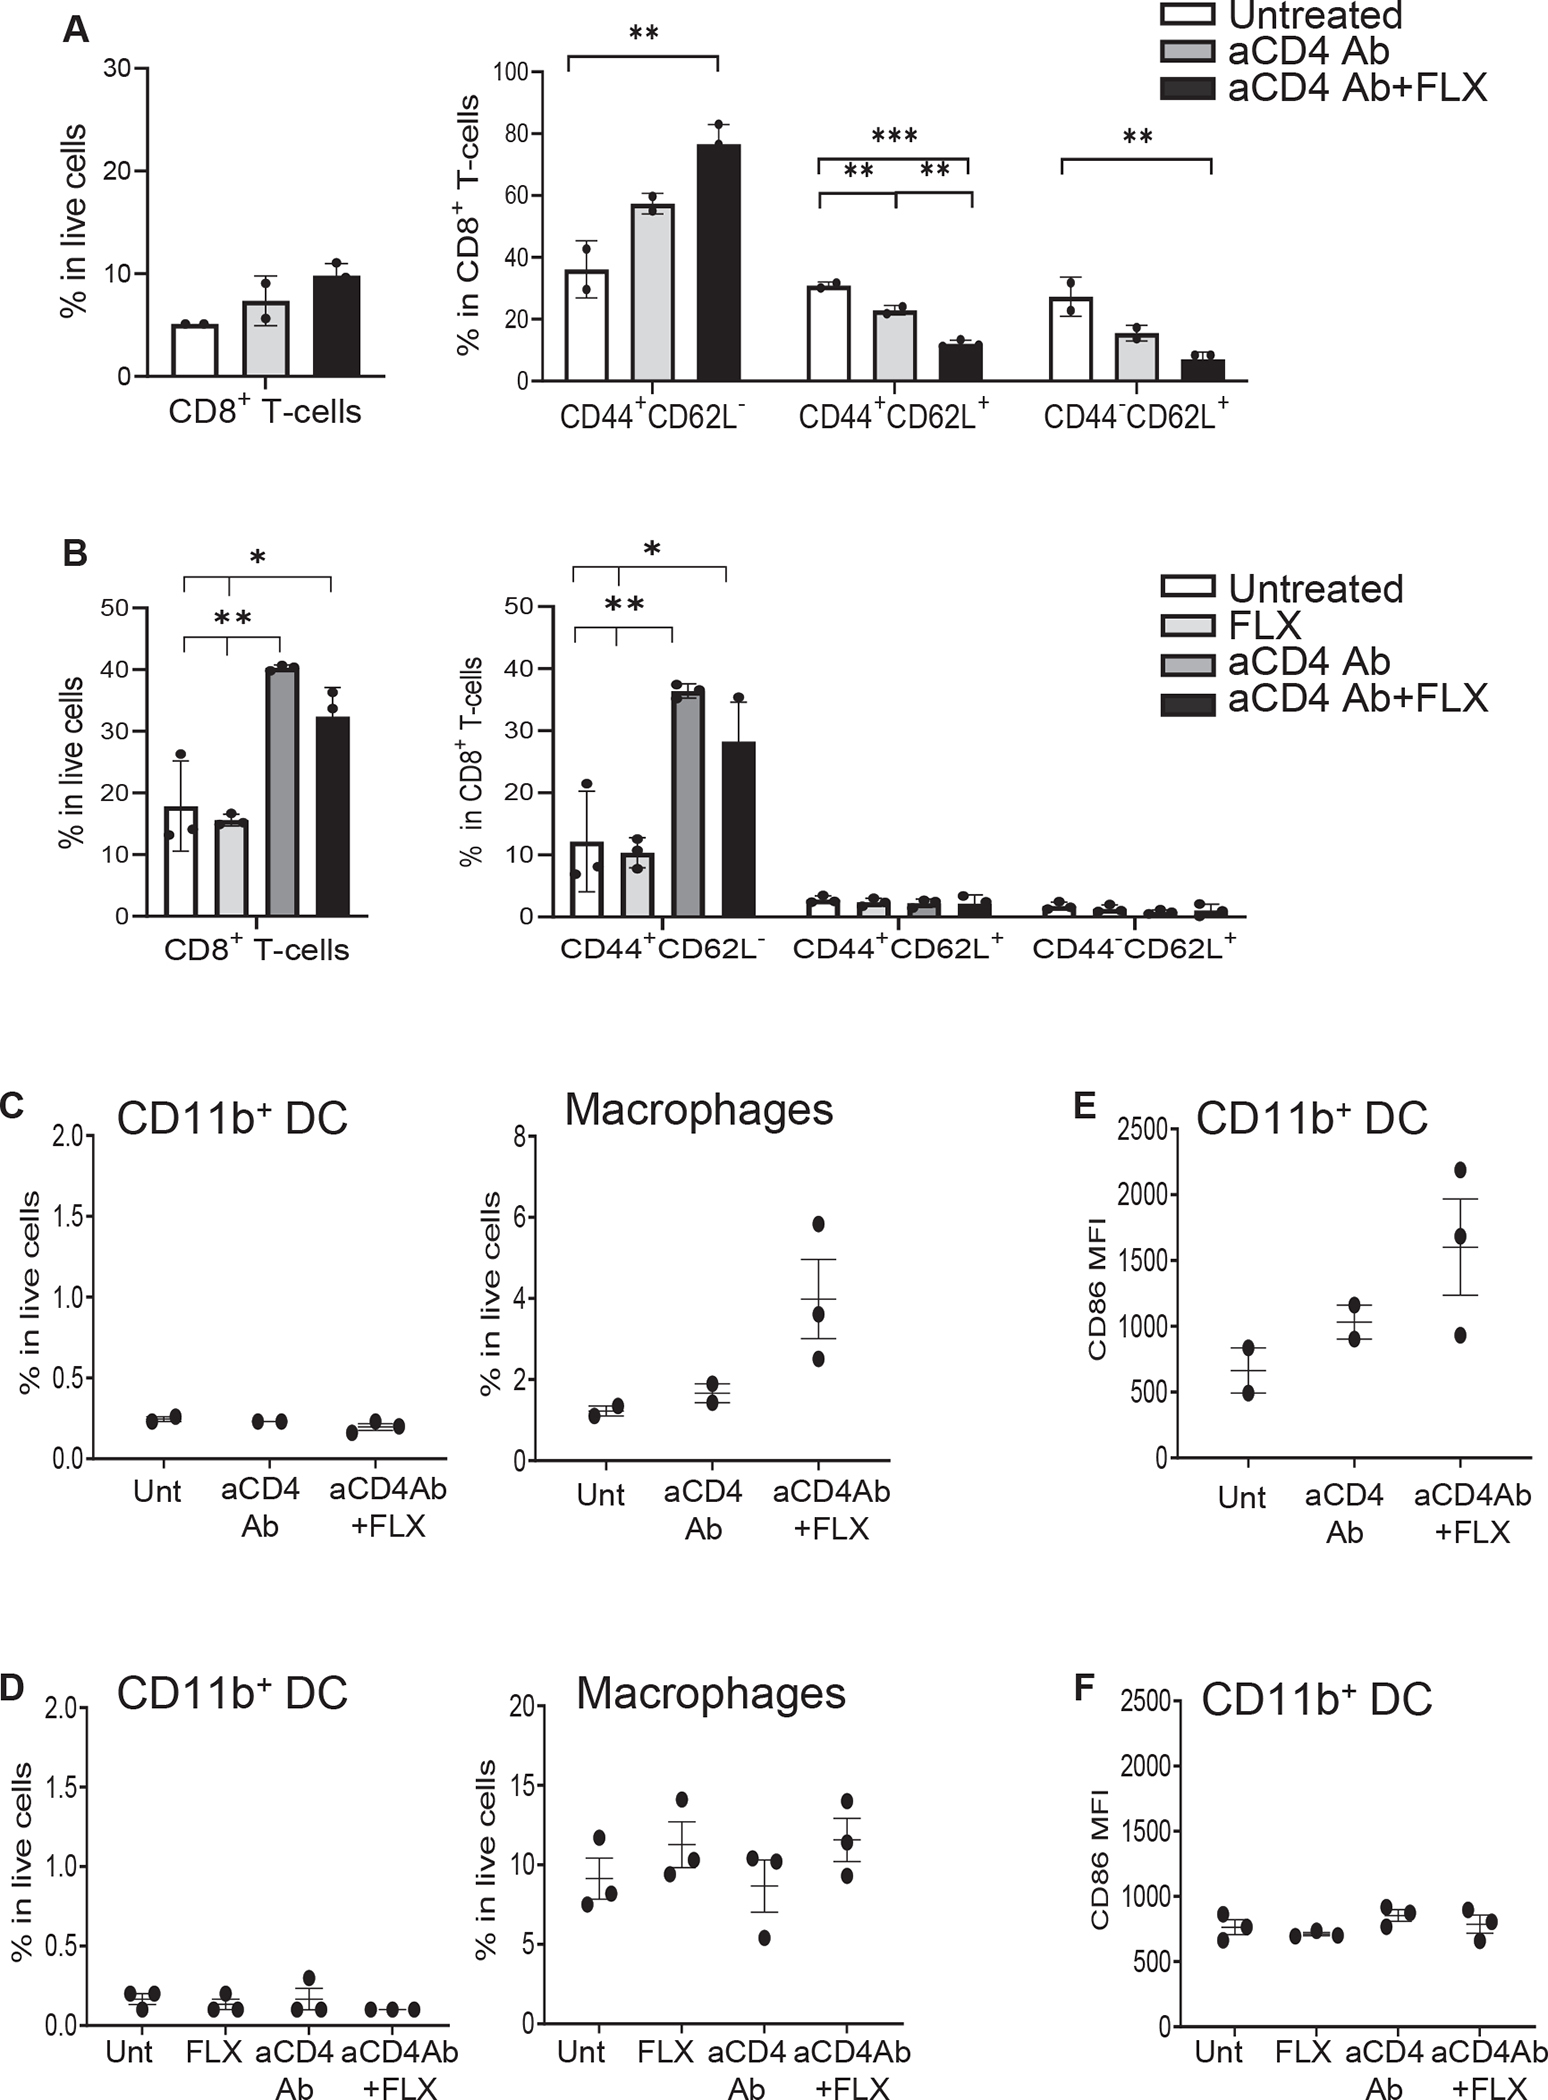
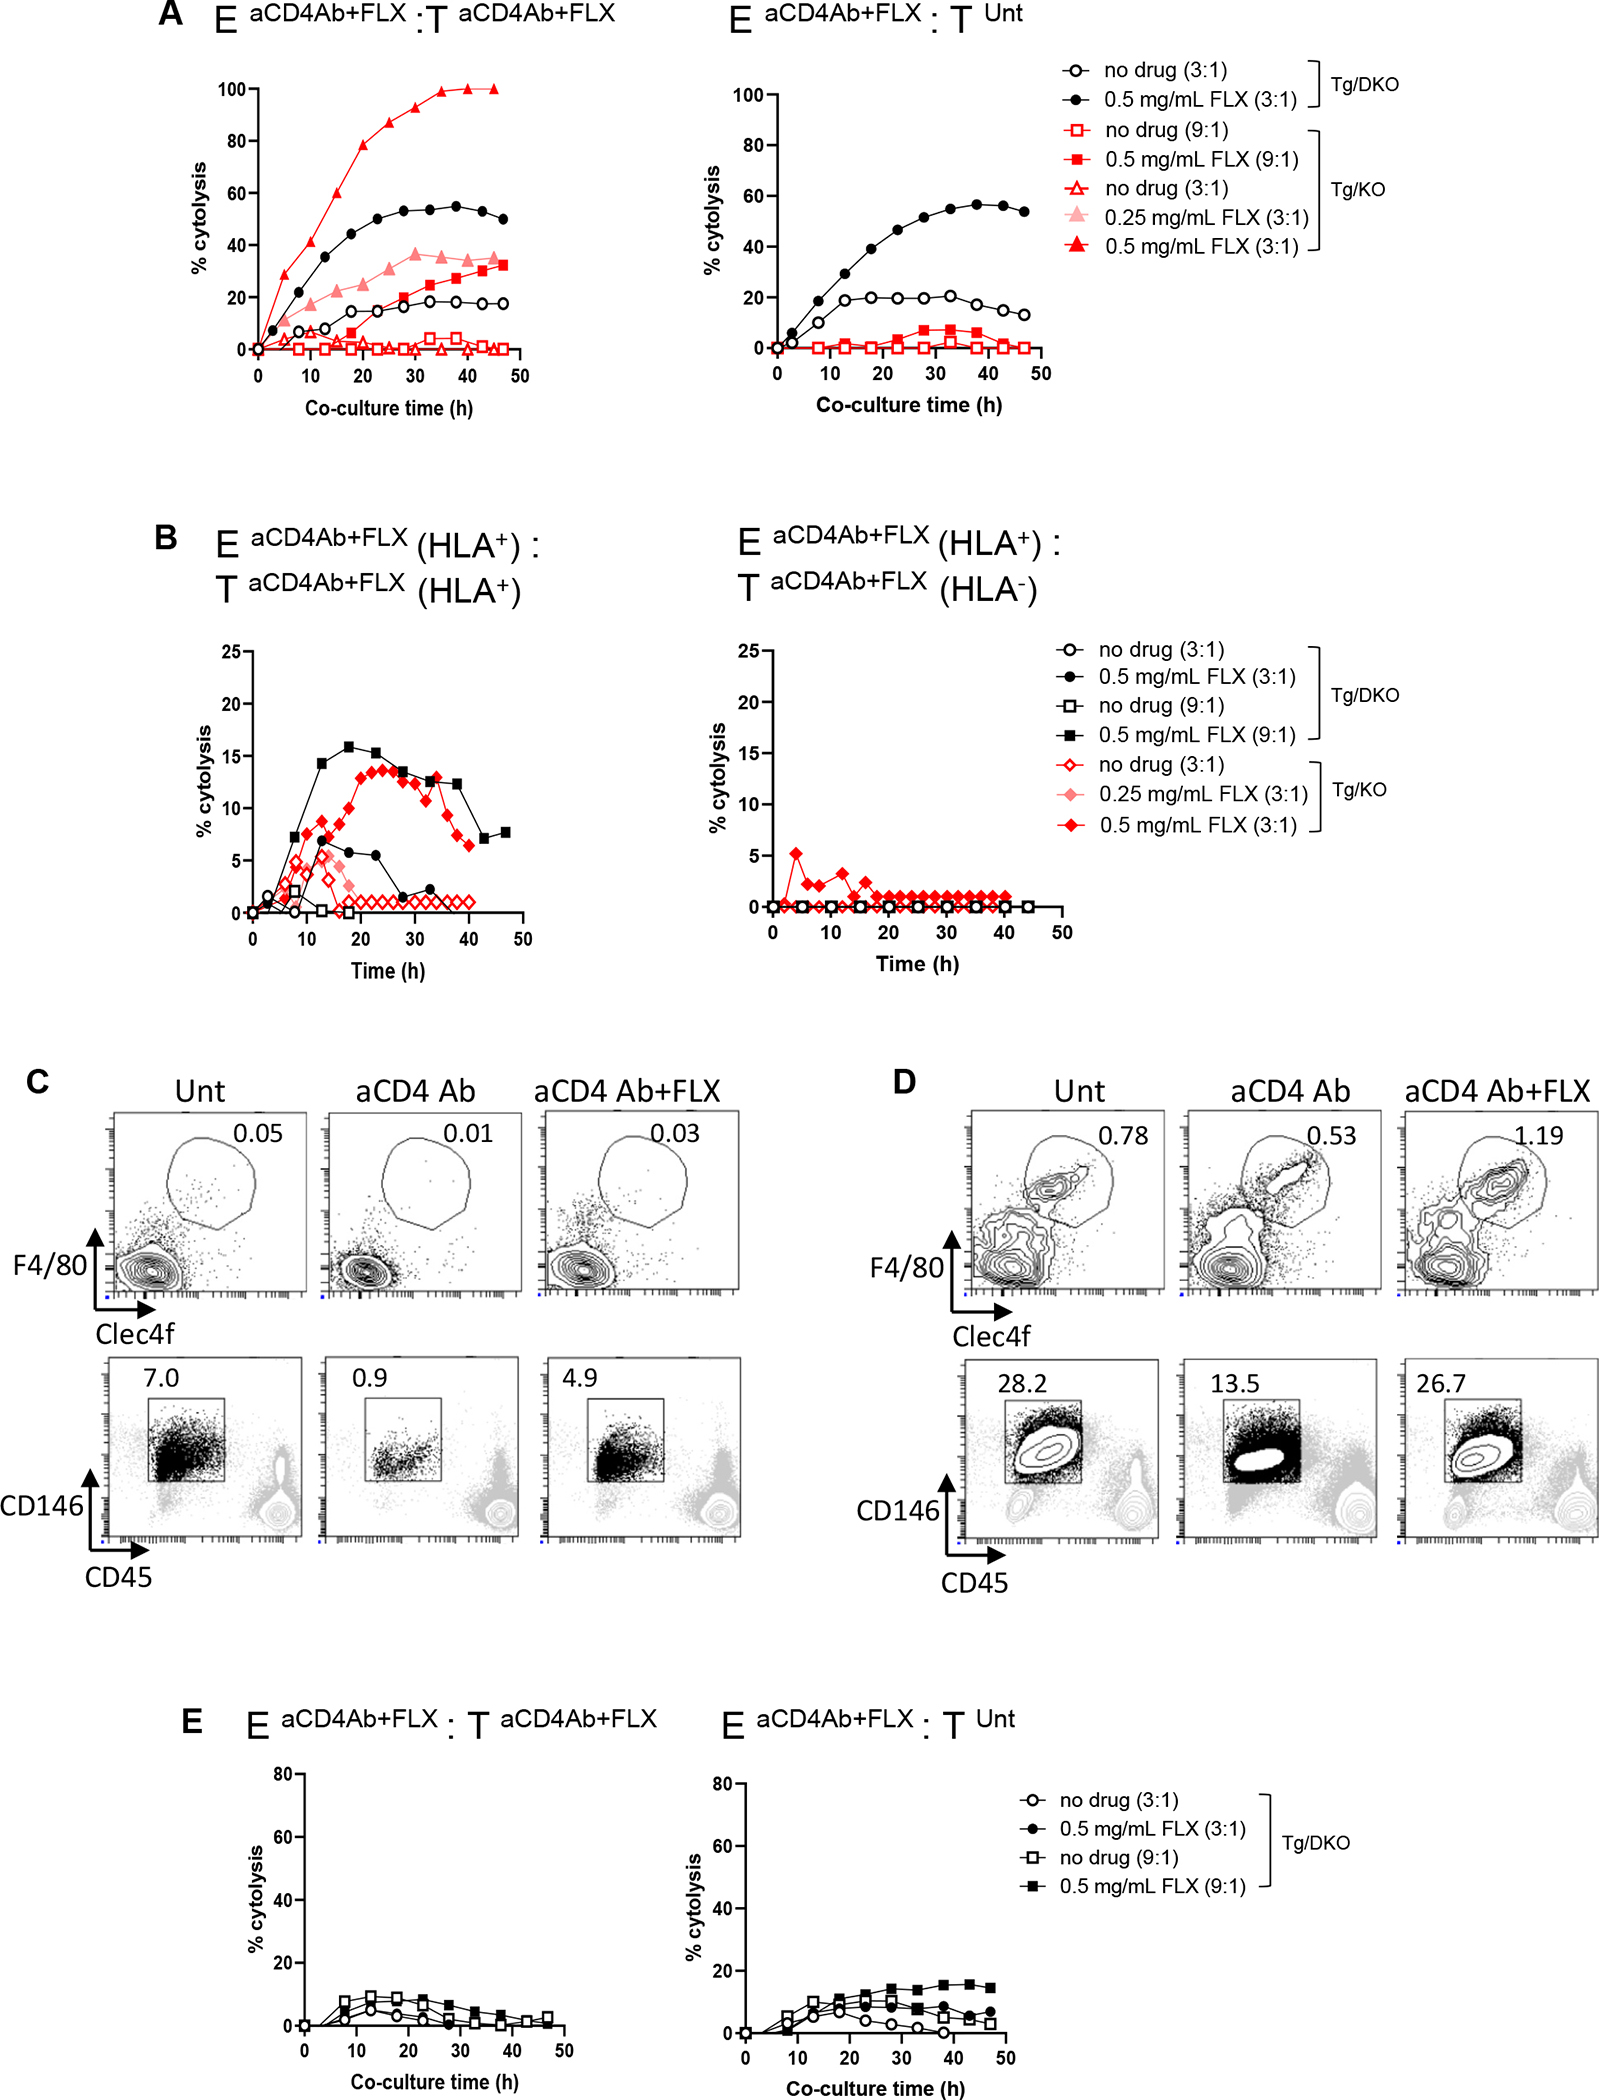
Results: CD8+ T-cell responses to FLX in Tg were dependent on both HLA and mouse major histocompatibility complex I presentation and in vivo priming. Eliminating H2-KbDb in Tg/KO to allow exclusive presentation of FLX by HLA resulted in a less robust drug-specific CD8+T-cell response unless CD4+ cells, including regulatory T cells, were depleted. Treatment of Tg/KO with anti-CD4 antibody and FLX led to subclinical liver inflammation associated with an increase in PD1+CD8+ T cells in the lymphoid organs and liver. Impaired PD-1 expression in Tg/DKO led to liver histopathologic and transcriptional alterations but without hepatic enzyme elevations. Moreover, effector lymphocytes accumulated in the liver and showed FLX-dependent hepatic cytotoxicity in vitro when tolerogenic liver cells were depleted.

Conclusions: In our in vivo models, FLX primes CD8+ T cells to recognize drug presented by HLA-B∗57:01 and murine major histocompatibility complex I. HLA-B∗57:01-dependent CD8+ T-cell reaction to FLX is limited by the presence of CD4+ cells, presumably regulatory T cells, and PD-1 expression. Tolerogenic hepatic cells limit clinical disease through PD-L1 or additional unexplored mechanisms.

Keywords: Flucloxacillin; HLA-B∗57:01 transgenic mice; drug-induced liver injury; tolerance.


Conflict of interest statement

Disclosure of potential conflict of interest: The authors declare that they have no relevant conflicts of interest.

Figures

FIG 1.
FIG 1.
Drug-reactive CD8+ T-cell responses are enriched in FLX-primed Tg mice. CD8+ T cells were isolated from spleens of drug-naive HLA-B*57:01+ (Tg) and WT control animals (A and B) or FLX-treated Tg mice (B) and cultured with irradiated autologous feeders at a 1:2 ratio in the presence or absence of FLX or ABC (125 μg/mL of FLX and 10 μg/mL of ABC in (B)). IFN-γ and GZMB levels were measured at different time points by ELISA. (A) Data shown are from 1 representative of 2 independent experiments. (B) IFN-γ values are presented as means ± SEMs of results from 3 animals per group. (C) Cell morphology changes observed by optical microscopy (20×) at day 4 of culture of CD8+ splenocytes from a representative FLX-primed animal, in the absence or presence of 125 μg/mL of FLX.
FIG 2.
FIG 2.
CD8+ T-cell reactivity to FLX is driven by both HLA-B*57:01 and mouse MHC-I molecules following different kinetics. (A and B) CD8+ T cells from LNs (A) and spleens (B) of untreated Tg mice or FLX-treated Tg and WT mice and cultured with irradiated autologous splenocytes at 1:2 ratio for up to 5 days. Feeders were incubated overnight with the indicated drug concentration before irradiation. FLX was also added to cocultures at the same concentration. IFN-γ release was measured by ELISA. Data represent means ± SEMs of values from 3 animals per group. (C and D) CD8+ T cells isolated from LN (C) or spleen (D) of FLX-treated animals were cultured with autologous (Tg) or WT feeders under conditions indicated in the graph. FLX was provided at a concentration of 150 μg/mL. IFN-γ levels in culture supernatants were measured by ELISA at days 2 and 4 of culture. (E) Splenic CD8+ T cells from drug-treated Tg mice were cultured with 150 μg/mL of FLX in vitro with autologous feeders in the presence or absence of 10 μg/mL anti-HLA or anti-mouse MHC-I (H2-Kb and H2-Db) antibodies. IFN-γ concentration in culture supernatants was measured by ELISA. Values represent means + SEMs of 3 animals per group. *P ≤ .05, **P ≤ .01, ***P ≤ .001, ****P ≤ .0001,1-way ANOVA.
FIG 3.
FIG 3.
CD8+ T cells from FLX primed Tg/KO cells have a delayed HLA-dependent response to FLX in vitro due to decreased levels of CD8+ T cells influenced by lack of H2-KbDb. (A and B) Splenic CD8+ T cells from FLX-primed Tg/KO animals (males and females, n = 3 each) were cocultured with drug-pulsed irradiated autologous feeders (matching sex) and 250 μg/mL of FLX for 14 days. (A) IFN-γ levels in culture supernatants were measured by ELISA at indicated time points. (B) Inhibition of IFN-γ release was represented as percentage of cytokine level between cultures pretreated with or without anti-HLA antibody. (C) Percentage of CD8+ and CD4+ T lymphocytes and NK cells in spleen of Tg and Tg/KO mice. (D) Percentage of splenic CD8+ T lymphocytes in total CD3+ T cells in mice of different backgrounds. (E and F) MFI for HLA B/C (E) and H2-Kb (F) molecules expressed in blood lymphocyte populations of different mouse strains. ****P ≤ .0001, unpaired t test. NK, Natural killer.
FIG 4.
FIG 4.
FLX treatment of Tg/KO mice leads to mild liver inflammation if CD4+ T cells, including Treg cells, are depleted. FLX was administered to Tg/KO mice with or without aCD4Ab. All animals were treated with RA. At day 10 after initiation of drug treatment, liver inflammation was evaluated by serum levels of ALTs (A), H&E staining of fixed liver sections (representative mouse per group) (B), and gene expression analysis of perfused liver by real-time PCR (geomean of n = 3–6 mice per group) (C). (D) Infiltrating liver leukocyte populations were isolated from perfused livers and characterized by FACS. Spleen (E) and LN (F) cell suspensions were obtained and analyzed with the same FACS antibody panel (n = 3–9 mice per group). Dead cells were excluded from analysis. Macrophages are CD11bhiF4/80+; cDC CD11b+ are CD19CD11c+CD8 cells (see gating strategy in Fig E5). *P ≤ .05, **P ≤ .01, ***P ≤ .001, ****P ≤ .0001, 1-way ANOVA. FACS, Fluorescence-activated cell sorting.
FIG 5.
FIG 5.
Enhanced drug reaction and liver histopathology in Tg/DKO mice after aCD4Ab + FLX treatment. (A) Flow cytometry analysis of CD8+ T cells in blood of drug-naive animals of different strains. (B-D) Tg/KO or Tg/DKO animals (n = 2–3 per group) were treated with aCD4Ab or aCD4Ab + FLX. Frequency of splenic IFN-γ+CD8+ (B) and GZMB+CD8+ (C) T cells was measured by flow cytometry analysis after day 10 of drug in vivo treatment and subsequent culture in the presence or absence of 250 μg/mL of FLX for 16 hours before adding brefeldin A for 4 hours. (D) IFN-γ levels in culture supernatant of total splenocytes restimulated with or without 250 μg/mL of FLX for 2 or 5 days. (E-H) Tg/DKO mice were treated as described in Methods. (E) Liver and gallbladder at euthanasia (1 representative animal). (F) H&E staining of fixed liver sections (scale bar 5 100 μm) (1 representative mouse per group). Additional sections showed more foci of inflammation in aCD4Ab–treated mice than untreated or FLX control groups, but inflammation and hepatocellular injury were most prominent in the aCD4Ab + FLX group (Fig E4). (G) Serum ALT at day 10 of treatment (n = 3 per group). (H) Gene expression analysis of perfused liver by real-time PCR (geomean of n = 3–12 mice per group).
FIG 6.
FIG 6.
Leukocyte profiling in spleen and liver of Tg/DKO mice. Animals received FLX and/or aCD4Ab. Livers were perfused before cell isolation. (A and B) Flow cytometry analysis of CD8+ T-cell subsets obtained from spleen (A) or liver (B) of Tg/DKO mice. (C and D) Frequency of DC (CD11b+CD11c+CD8) and macrophage (F4/80+CD11b+) in spleen (C) and liver (D). (E and F) MFI of CD86+CD11b+ DCs isolated from spleen (E) and liver (F) of the same animals in (C) and (D), respectively.
FIG 7.
FIG 7.
In vitro hepatocyte cytolysis by FLX-reactive leukocytes of mice treated with aCD4Ab + FLX is influenced by drug reexposure, HLA expression, and presence of liver tolerogenic cells. Tg/DKO and Tg/KO animals were treated with aCD4Ab + FLX or left untreated as per our 10-day standard protocol. (A and B) Primary hepatocytes were isolated from perfused livers and seeded in E-plates (target cells [T] at 20,000 cells per well) for 18 hours. Subsequently, liver leukocytes from aCD4Ab + FLX–treated mice (effector cells [E]) were added to cultures at an E:T ratio of 3:1 or 9:1 (E and T from same mouse strain). Superscript annotations correspond to in vivo treatment of animals from which E and T cells were isolated. Selected cocultures were exposed to FLX. Percentage cytolysis was measured as a function of impedance, as indicated in the Methods section in the Online Repository. In (B), T were isolated from HLA+ or HLA mice from Tg/KO or Tg/DKO strains. E were from HLA+ animals. Different symbols correspond to different animals. (C and D) Frequency of KCs (F4/80+Clec4f+) and LSECs (CD146+CD45) in cell suspensions of enriched liver leukocytes (C) or bulk NPC (D) from perfused livers of untreated or treated Tg/DKO animals. (E) Cytolysis was evaluated as indicated in (A) but with cocultures of hepatocytes and NPC from perfused livers of Tg/DKO mice.

References

    1. Andrade RJ, Tulkens PM. Hepatic safety of antibiotics used in primary care. J Antimicrob Chemother 2011;66:1431–46. - PMC - PubMed
    1. Goh SJR, Tuomisto JEE, Purcell AW, Mifsud NA, Illing PT. The complexity of T cell–mediated penicillin hypersensitivity reactions. Allergy 2021;76:150–67. - PubMed
    1. Blumenthal KG, Peter JG, Trubiano JA, Phillips EJ. Antibiotic allergy. Lancet 2019;393:183–98. - PMC - PubMed
    1. Olsson R, Wiholm BE, Sand C, Zettergren L, Hultcrantz R, Myrhed M. Liver damage from flucloxacillin, cloxacillin and dicloxacillin. J Hepatol 1992;15:154–61. - PubMed
    1. Russmann S, Kaye JA, Jick SS, Jick H. Risk of cholestatic liver disease associated with flucloxacillin and flucloxacillin prescribing habits in the UK: cohort study using data from the UK General Practice Research Database. Br J Clin Pharmacol 2005;60:76–82. - PMC - PubMed

Publication types

MeSH terms

LinkOut - more resources