. 2023 May;22(5):100544.
doi: 10.1016/j.mcpro.2023.100544. Epub 2023 Apr 6.

Translational and Posttranslational Dynamics in a Model Peptidergic System

Affiliations

Translational and Posttranslational Dynamics in a Model Peptidergic System

Soledad Bárez-López et al. Mol Cell Proteomics. 2023 May.

Abstract

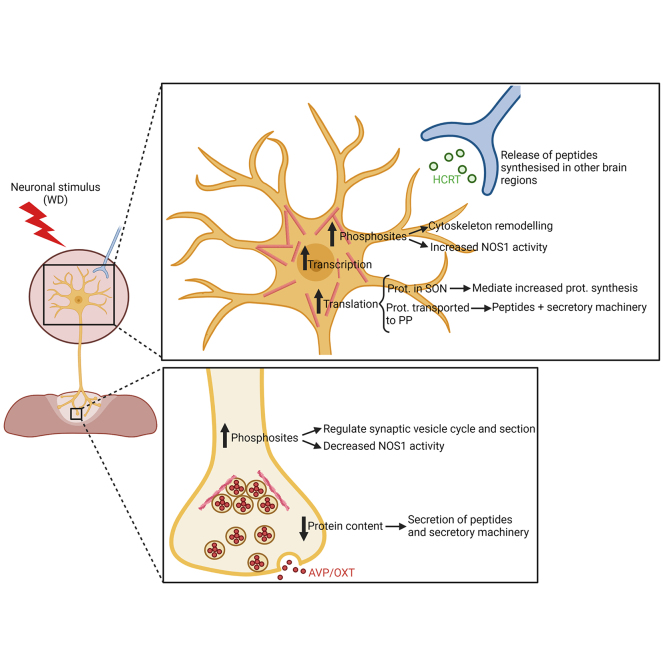
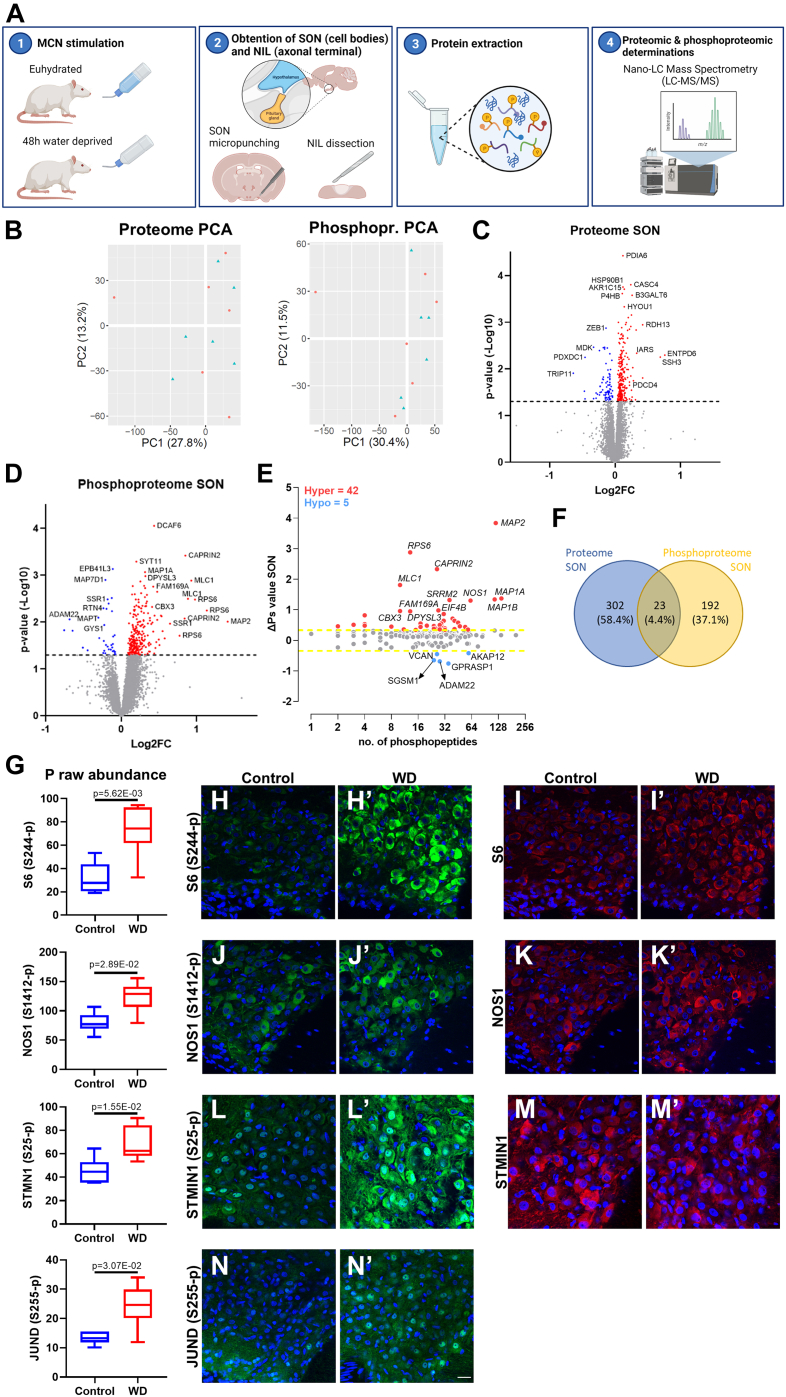
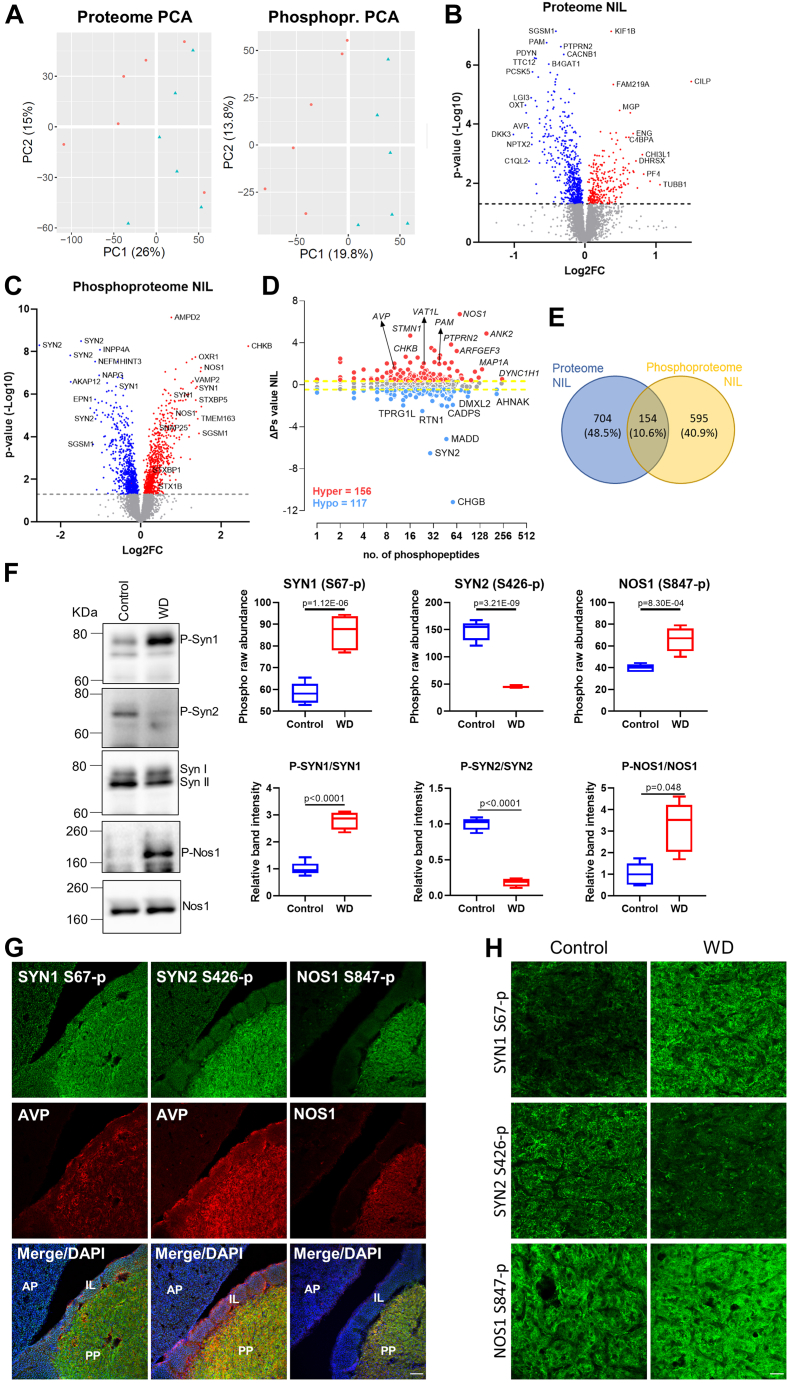
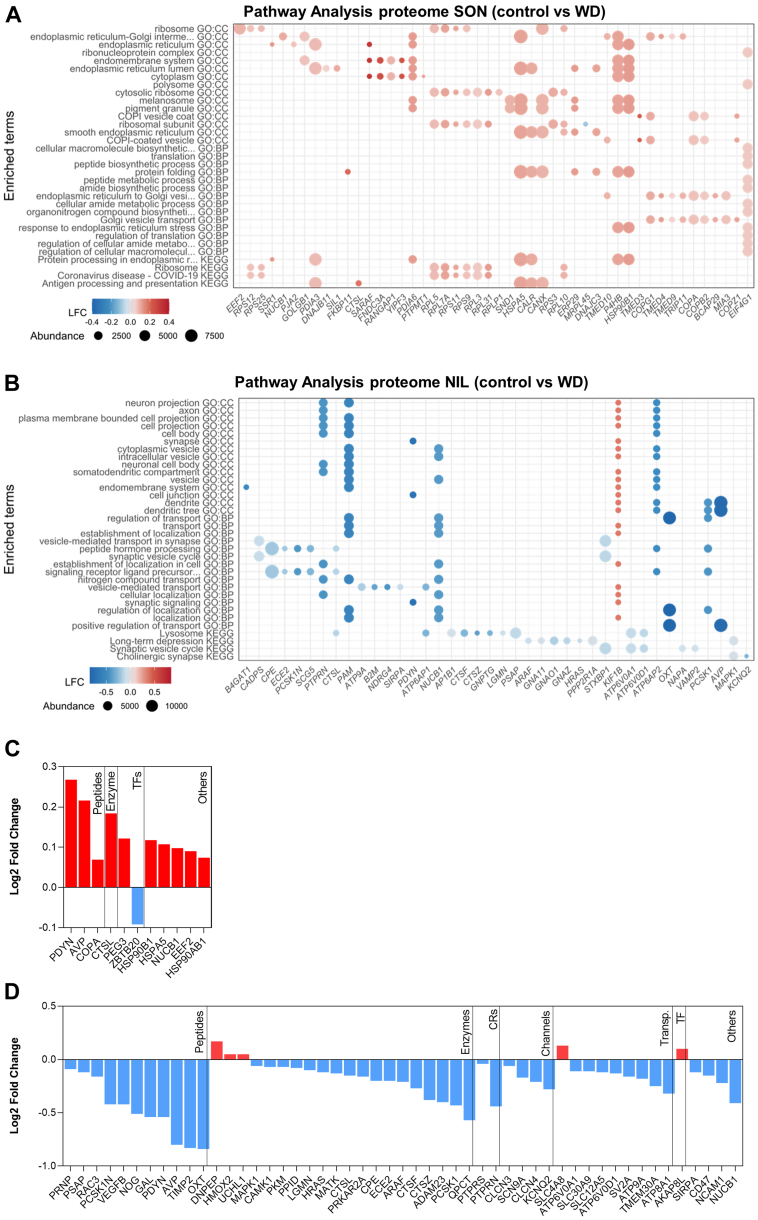
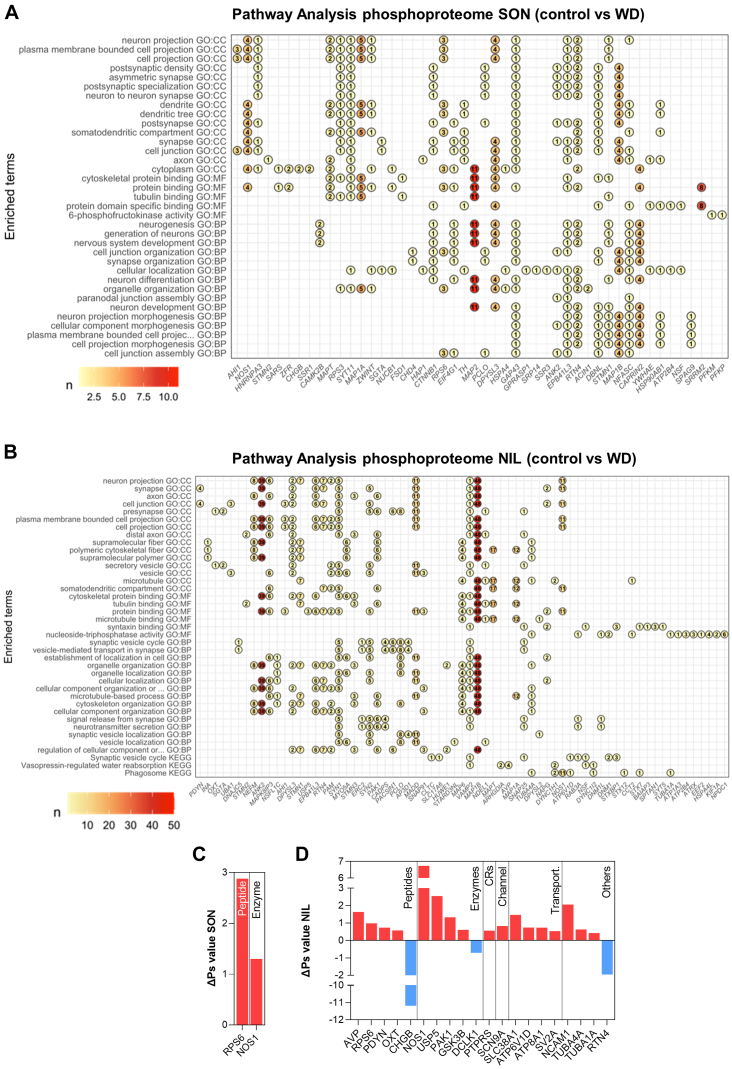
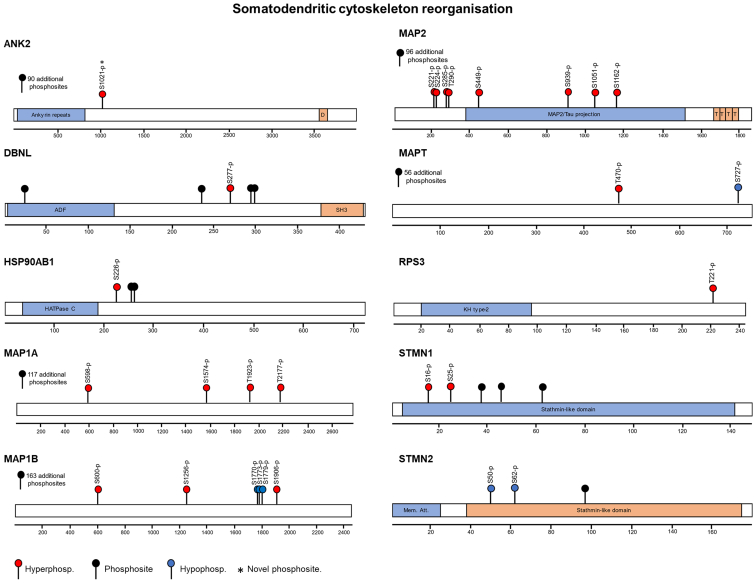
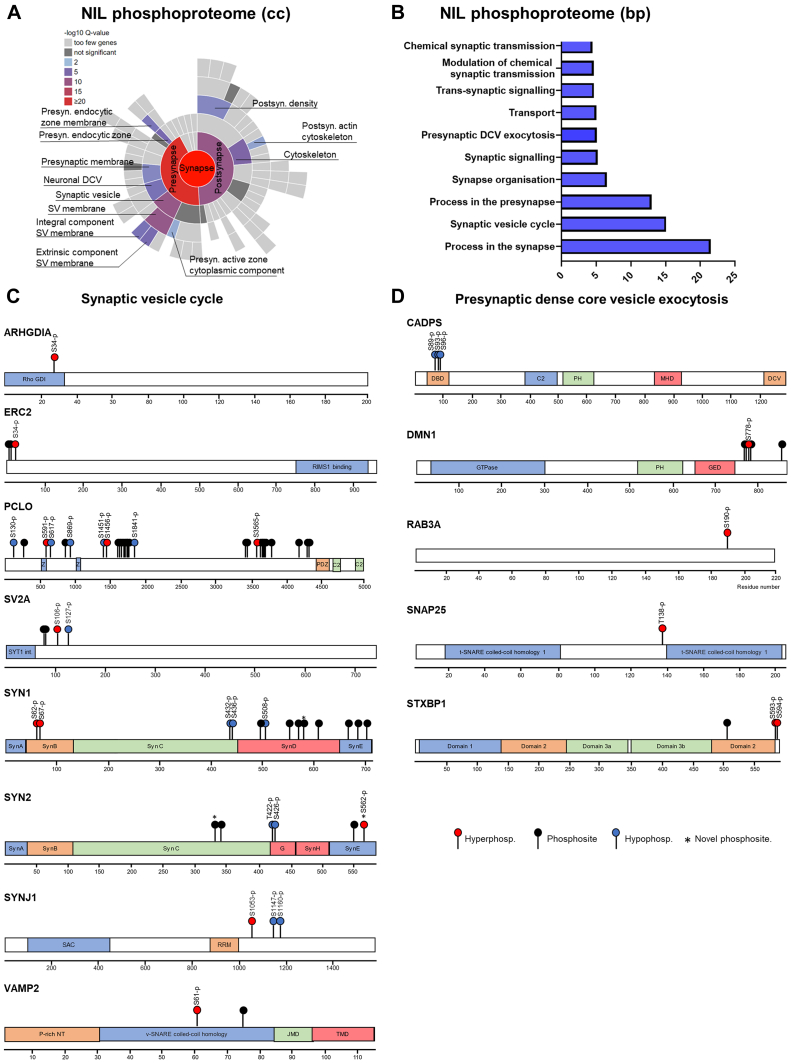
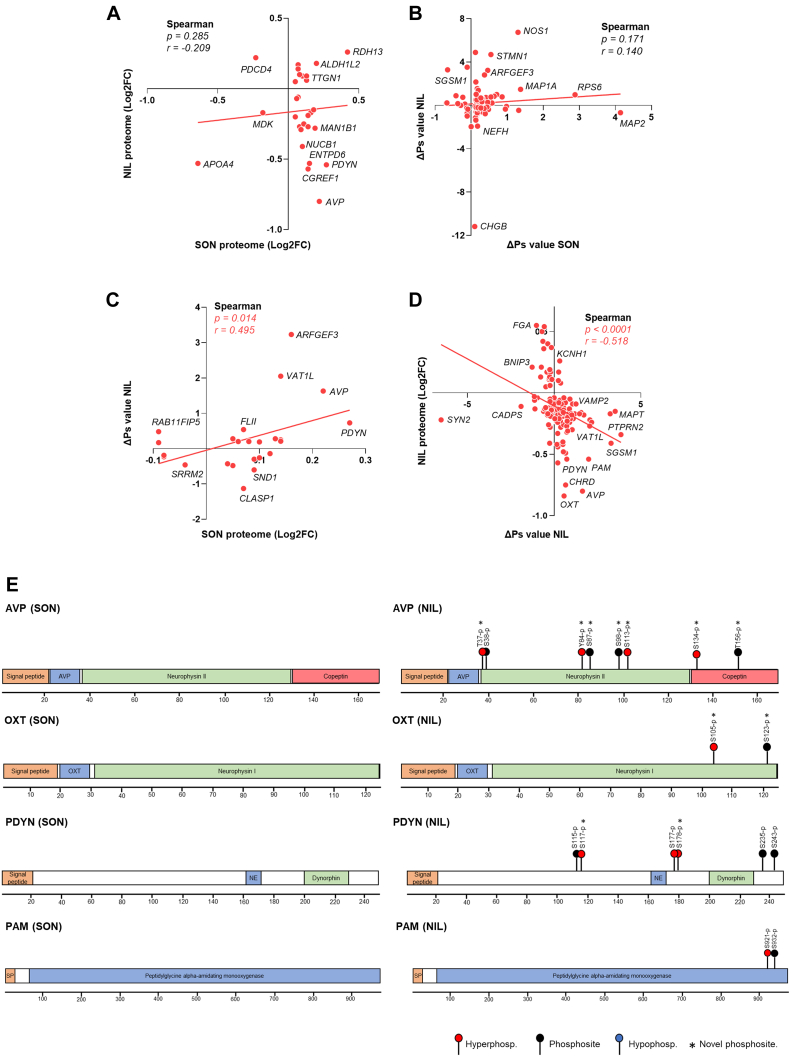
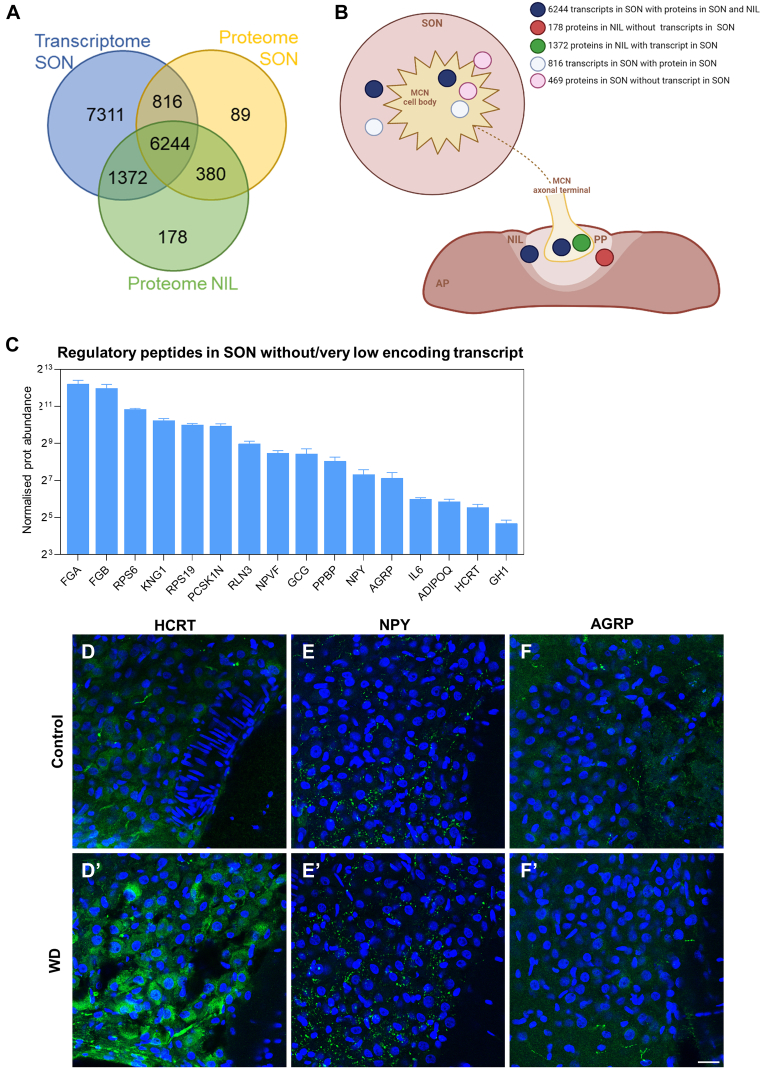
The cell bodies of hypothalamic magnocellular neurones are densely packed in the hypothalamic supraoptic nucleus, whereas their axons project to the anatomically discrete posterior pituitary gland. We have taken advantage of this unique anatomical structure to establish proteome and phosphoproteome dynamics in neuronal cell bodies and axonal terminals in response to physiological stimulation. We have found that proteome and phosphoproteome responses to neuronal stimulation are very different between somatic and axonal neuronal compartments, indicating the need of each cell domain to differentially adapt. In particular, changes in the phosphoproteome in the cell body are involved in the reorganization of the cytoskeleton and in axonal terminals the regulation of synaptic and secretory processes. We have identified that prohormone precursors including vasopressin and oxytocin are phosphorylated in axonal terminals and are hyperphosphorylated following stimulation. By multiomic integration of transcriptome and proteomic data, we identify changes to proteins present in afferent inputs to this nucleus.

Keywords: Axonal terminal; Cell body; Cytoskeleton; Magnocellular neurones; Phosphoproteome; Proteome; Synapse.


Conflict of interest statement

Conflict of interest The authors declare that they have no conflicts of interest.

Figures

None
Graphical abstract
Fig. 1
Fig. 1
Quantitative proteome and phosphoproteome of the rat supraoptic nucleus.A, graphical representation of the experimental approach (1). Twelve adult Sprague Dawley rats were divided into two groups: six control with constant access to water and six subjected to a 48-h water deprivation protocol (WD) to activate magnocellular neurones (MCNs) (2). The supraoptic nucleus (SON, mainly containing MCN cell bodies and dendrites) was punched from the hypothalamus, and the neurointermediate lobe (NIL, mainly containing axonal terminals from the posterior pituitary as well as the intermediate lobe) was dissected from the anterior pituitary (3). Proteins from SON and NIL were extracted and processed for Nano-LC Mass Spectrometry (LC-MS/MS) (4). Proteomics and phosphoproteomic determinations were performed by LC-MS/MS. Generated using BioRender (https://biorender.com/). B, principal component analysis (PCA) of the SON proteome and phosphoproteome in control (blue, n = 6) and WD rats (red; n = 6). C, volcano plot of WD versus control SON proteome showing 247 upregulated (p-value <0.05, red) and 78 downregulated (p-value <0.05, blue) proteins. D, volcano plot of WD versus control SON phosphoproteome showing 252 hyperphosphorylation (p-value <0.05, red) and 36 hypophosphorylation (p-value <0.05, blue) events. E, global overall phosphorylation state change (ΔPs) analysis of phosphoproteins between control and WD rats in the SON. Numbers of hyperphosphorylated (Hyper) and hypophosphorylated (Hypo) peptides are shown. Dotted lines, ΔPs = ±0.34. F, Venn diagram showing 23 proteins in common with changes at the proteome and phosphoproteome level in response to WD. G, phospho raw abundance for S244-p S6, S1412-p NOS1, S25-p STMN1, and S255-p JUND in the SON according to LC-MS/MS between control (n = 6) and WD (n = 6) rats. H, immunohistochemistry against S244-p S6 in the SON of control and (H′) WD rats. I, immunohistochemistry against S6 in the SON of control and (I′) WD rats. J, immunohistochemistry against S1412-p NOS1 in the SON of control and (J′) WD rats. K, immunohistochemistry against NOS1 in the SON of control and (K′) WD rats. L, immunohistochemistry against S25-p STMN1 in the SON of control and (L′) WD rats. M, immunohistochemistry against STMN1 in the SON of control and (M′) WD rats. N, immunohistochemistry against S255-p JUND in the SON of control and (N′) WD rats. Images are representative of n = 4. Scale bar represents 25 μm. LC-MS/MS, Nano-LC mass spectrometry.
Fig. 2
Fig. 2
Quantitative proteome and phosphoproteome of the rat neurointermediate lobe.A, principal component analysis (PCA) of the NIL proteome and phosphoproteome in control (blue, n = 6) and water-deprived (WD) rats (red; n = 6). B, volcano plot of WD versus control NIL proteome showing 276 upregulated (p-value <0.05, red) and 573 downregulated (p-value <0.05, blue) proteins. C, volcano plot of WD versus control NIL phosphoproteome showing 746 hyperphosphorylation (p-value <0.05, red) and 755 hypophosphorylation (p-value <0.05, blue) events. D, global ΔPs analysis of phosphoproteins between control and WD rats in the NIL. Numbers of hyperphosphorylated (Hyper) and hypophosphorylated (Hypo) peptides are shown. Dotted lines, ΔPs = ±0.4. E, Venn diagram showing 151 proteins in common with changes at the proteome and phosphoproteome level in response to WD. F, phospho raw abundance for S67-p SYN1, S426-p SYN2, and S426-p SYN2 in the NIL according to LC-MS/MS between control (n = 6) and WD (n = 6) rats. Western blotting analysis of S67-p SYN1 (normalized against SYN1), S426-p SYN2 (normalized against SYN2), and S847-p NOS1 (normalized against NOS1) in control (n = 5) and WD NILs (n = 5 for S847-p NOS1 and n = 4 for S67-p SYN1 and S426-p SYN2). G, immunohistochemistry against S67-p SYN1 and arginine vasopressin (AVP), S426-p SYN2 and AVP, and S847-p NOS1 and NOS1 in the pituitary gland of control rats showing the anterior pituitary (AP), intermediate lobe (IL), and posterior pituitary (PP). Images are representative of n = 4. Scale bar represents 75 μm. H, immunohistochemistry against S67-p SYN1, S426-p SYN2, and S847-p NOS1 in the PP of control and WD rats. Images are representative of n = 4. Scale bar represents 25 μm. ΔPs, phosphorylation state change; LC-MS/MS, Nano-LC mass spectrometry; NIL, neurointermediate lobe.
Fig. 3
Fig. 3
Pathway analyses and functional classification of the proteomes of supraoptic nucleus and neurointermediate lobe.A, pathway analysis of changes in the SON proteome as a result of water deprivation (WD) using GO and KEGG databases. Dot plot of up to 15 enriched terms retrieved for each category ranked according to PAdj value from top to bottom in increasing order. The top 10 most significant associated differentially expressed proteins of each overrepresented category are shown as dots colored based on Log2FC and sized according to total normalized protein expression following WD. B, pathway analysis of changes in the NIL proteome as a result of WD using GO and KEGG databases. Dot plot of up to 15 enriched terms retrieved for each category ranked according to PAdj value from top to bottom in increasing order. The top 10 most significant associated differentially expressed proteins of each overrepresented category are shown as dots colored based on Log2FC and sized according to total normalized protein expression following WD. C, proteome Log2FC changes in the rat SON as a consequence of WD categorized according to their pharmacological classification or their function as a transcription factor. D, proteome Log2FC changes in the rat NIL as a consequence of WD categorized according to their pharmacological classification or their function as a transcription factor. GO, gene ontology; KEGG, Kyoto Encyclopedia of Genes and Genomes; NIL, neurointermediate lobe; Log2FC, Log2 fold change; SON, supraoptic nucleus.
Fig. 4
Fig. 4
Pathway analyses and functional classification of the phosphoproteomes of supraoptic nucleus and neurointermediate lobe.A, pathway analysis of changes in the SON phosphoproteome as a result of water deprivation (WD) using GO and KEGG databases. Dot plot of up to 15 enriched terms retrieved for each category ranked according to PAdj value from top to bottom in increasing order. The top 10 proteins with most significant phosphorylation changes in a phosphosite are shown as a dot indicating the total number of phosphorylation events in that protein following WD. B, pathway analysis of changes in the NIL phosphoproteome as a result of WD using GO and KEGG databases. Dot plot of up to 15 enriched terms retrieved for each category ranked according to PAdj value from top to bottom in increasing order. The top 10 proteins with most significant phosphorylation changes in a phosphosite are shown as a dot indicating the total number of phosphorylation events in that protein following WD. C, ΔPs changes in the rat SON as a consequence of WD categorized according to their pharmacological classification or their function as a transcription factor. D, ΔPs changes in the rat NIL as a consequence of WD categorized according to their pharmacological classification or their function as a transcription factor. ΔPs, phosphorylation state change; GO, gene ontology; KEGG, Kyoto Encyclopedia of Genes and Genomes; NIL, neurointermediate lobe; SON, supraoptic nucleus.
Fig. 5
Fig. 5
Phosphorylation events regulating somatodendritic cytoskeleton reorganization in the stimulated supraoptic nucleus. Mapping the phosphosites and hyper and hypophosphorylation events in response to water deprivation (WD) in proteins involved in microtubule cytoskeleton organization. Protein domains include ADF: actin-depolymerizing factor homology domain; D: Death domain; HATPase C: Histidine kinase-, DNA gyrase B-, and HSP90-like ATPase domain; KH type 2: K Homology type 2 domain; Mem. Att: Membrane attachment domain; SH3, SRC Homology 3 domain; SON, supraoptic nucleus.
Fig. 6
Fig. 6
Phosphorylation events regulating synaptic processes in the stimulated neurointermediate lobe.A, SynGO cellular component (cc) enrichment analysis of all the proteins undergoing phosphorylation events in response to water deprivation (WD) in the NIL. B, SynGO biological processes (bp) enrichment analysis of all the proteins undergoing phosphorylation events in response to WD in the NIL. C, mapping the phosphosites and hyper and hypophosphorylation events in response to WD in proteins involved in the synaptic vesicle cycle. Protein domains include C2: Ca2+-dependent C2 domain; G: Pro-rich linker GTPase domain, GTPase domain; JMD: juxta-membrane domain; P-rich NT: proline-rich N-terminal domain; PDZ: post synaptic density domain; Rho GDI: RHO protein GDP dissociation inhibitor; RRM: RRM domain; SAC: SacI homology domain; Syn A, B, C, D, E, F, G, H, J: Synapsin domain A, B, C, D, E, F, G, H, J; SYT1 int: interaction with SYT1 domain; TMD: transmembrane domain; Z: Piccolo Zn-finger. D, mapping the phosphosites and hyper and hypophosphorylation events in response to WD in proteins involved in the presynaptic dense core vesicle exocytosis. C2, Ca2+-dependent C2 domain; DBD, dynactin 1 binding domain, DCV, dense core vesicle association domain, GED, Dynamin GTPase effector domain, GTPase, GTPase domain; MHD, Munc13-homology domain; NIL, neurointermediate lobe; PH, Pleckstrin homology domain.
Fig. 7
Fig. 7
Multiomic integration of stimulated supraoptic nucleus and neurointermediate lobe.A, spearman correlation analysis of Log2FC changes in the rat NIL proteome and SON proteome in response to water deprivation (WD). B, spearman correlation analysis of ΔPs changes in the rat NIL and SON in response to WD. C, spearman correlation analysis of ΔPs changes in the rat NIL and Log2FC changes in the SON proteome in response to WD. D, spearman correlation analysis of Log2FC changes in the rat NIL proteome and ΔPs changes in the NIL in response to WD. E, mapping the phosphosites and hyperphosphorylation events in response to WD in Vasopressin-neurophysin 2-copeptin (AVP), Oxytocin-neurophysin 1 (OXT), Proenkephalin-B (PDYN), Peptidylglycine alpha-amidating monooxygenase (PAM) in the SON and NIL. ΔPs, phosphorylation state change; AVP, arginine vasopressin; Log2FC, Log2 fold change; NIL, neurointermediate lobe; SON, supraoptic nucleus.
Fig. 8
Fig. 8
Basal state transcriptome versus proteome integration.A, Venn diagram showing the number of overlapping proteins in the supraoptic nucleus (SON) and neurointermediate lobe (NIL) and genes in the SON in control conditions. B, schematic representation of the gene and protein dynamics in the SON and NIL in control conditions according to comparisons from the Venn diagram. Generated using BioRender (https://biorender.com/). C, regulatory peptides detected in the SON without or very low transcripts in this structure. D, D', immunohistochemistry against HCRT in the SON of control and water-deprived (WD) rats. E, E', immunohistochemistry against NPY in the SON of control and WD rats. F, F', immunohistochemistry against AGRP in the SON of control and WD rats. Images are representative of n = 4. Scale bar represents 25 μm. NPY, neuropeptide Y.

Similar articles

Cited by

References

    1. Costa C.J., Willis D.E. To the end of the line: axonal mRNA transport and local translation in health and neurodegenerative disease. Dev. Neurobiol. 2018;78:209–220. - PMC - PubMed
    1. Sahoo P.K., Smith D.S., Perrone-Bizzozero N., Twiss J.L. Axonal mRNA transport and translation at a glance. J. Cell Sci. 2018;131 - PMC - PubMed
    1. Burbach J.P., Luckman S.M., Murphy D., Gainer H. Gene regulation in the magnocellular hypothalamo-neurohypophysial system. Physiol. Rev. 2001;81:1197–1267. - PubMed
    1. Mecawi A.S., Ruginsk S.G., Elias L.L., Varanda W.A., Antunes-Rodrigues J. Neuroendocrine regulation of hydromineral homeostasis. Compr. Physiol. 2015;5:1465–1516. - PubMed
    1. Crespo D., Ramos J., Gonzalez C., Fernandez-Viadero C. The supraoptic nucleus: a morphological and quantitative study in control and hypophysectomised rats. J. Anat. 1990;169:115–123. - PMC - PubMed

Publication types