. 2023 Apr 8;14(1):1975.
doi: 10.1038/s41467-023-37377-0.

Single cell transcriptomic analysis of HPV16-infected epithelium identifies a keratinocyte subpopulation implicated in cancer

Affiliations

Single cell transcriptomic analysis of HPV16-infected epithelium identifies a keratinocyte subpopulation implicated in cancer

Mary C Bedard et al. Nat Commun. .

Abstract

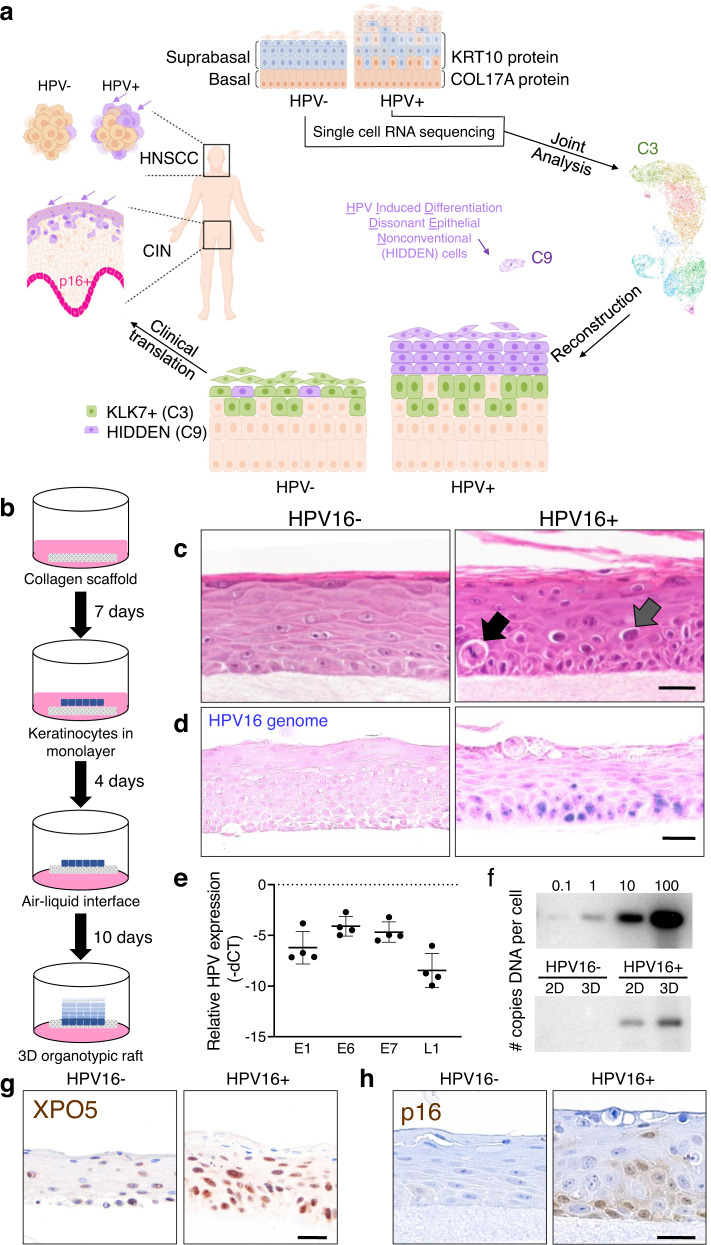
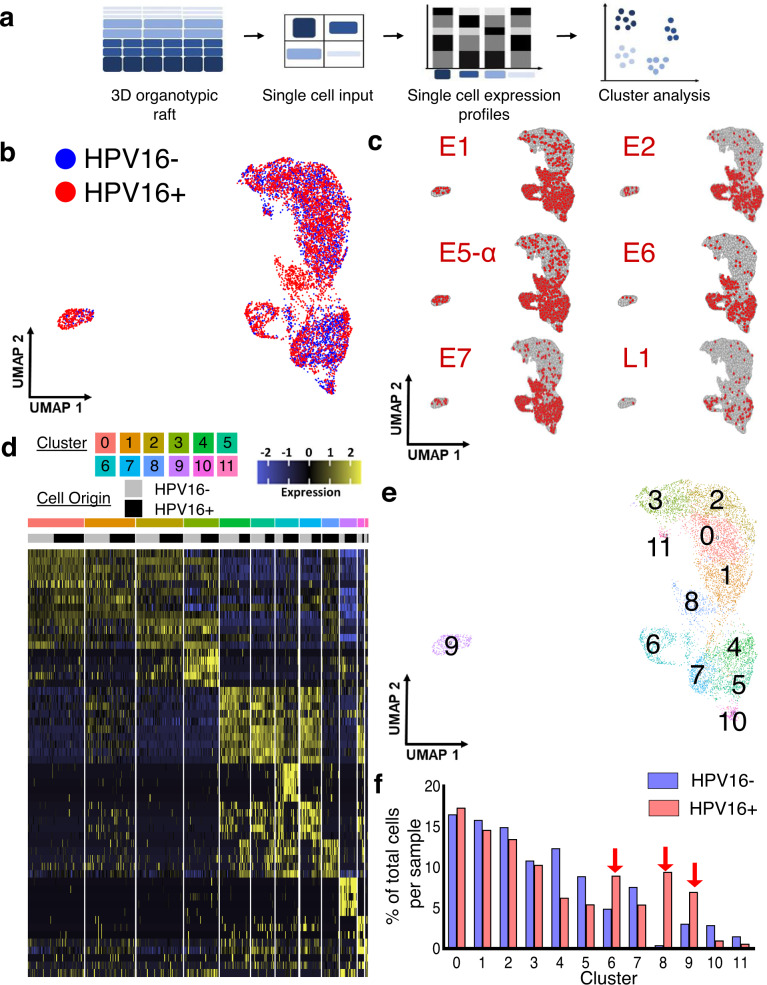
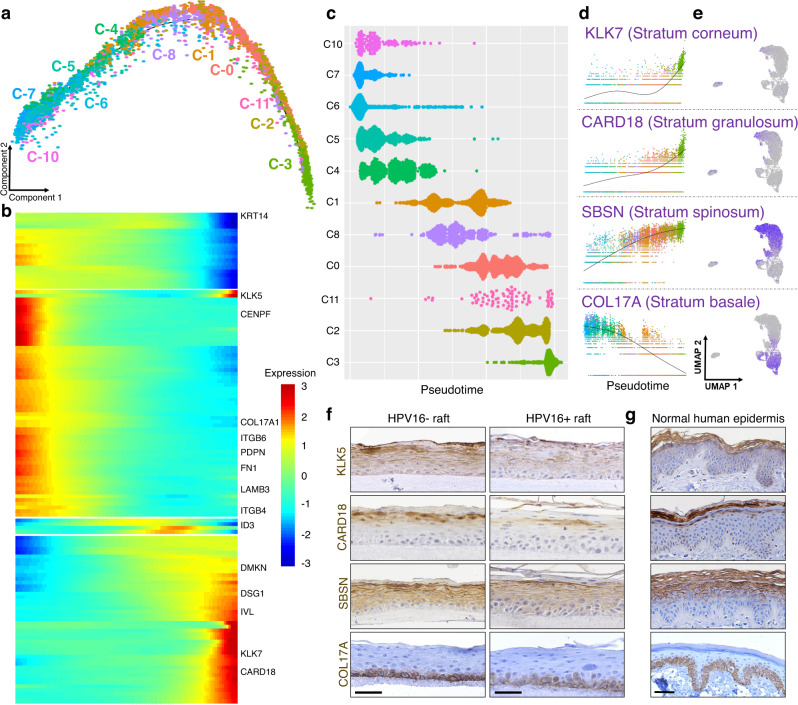
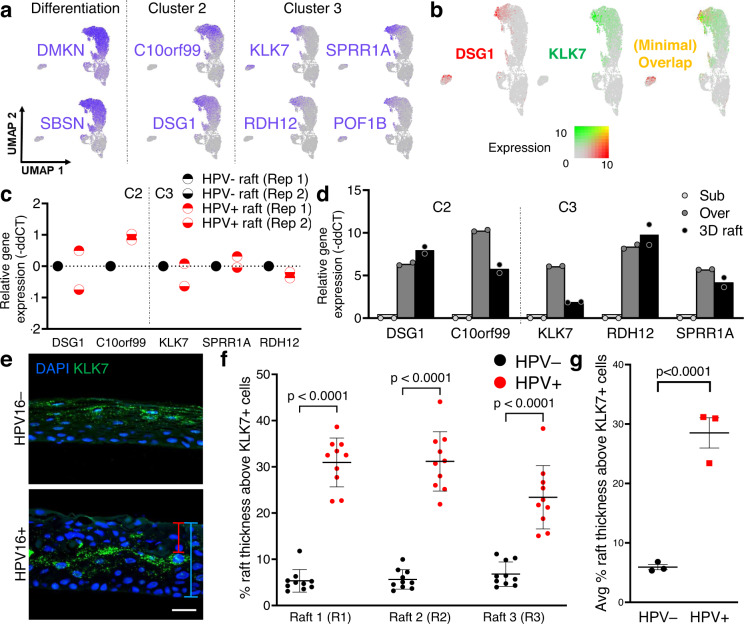
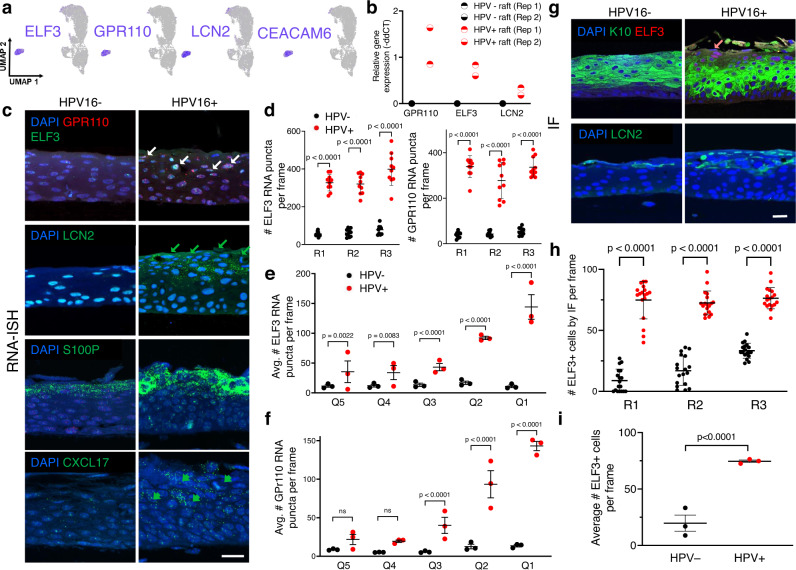
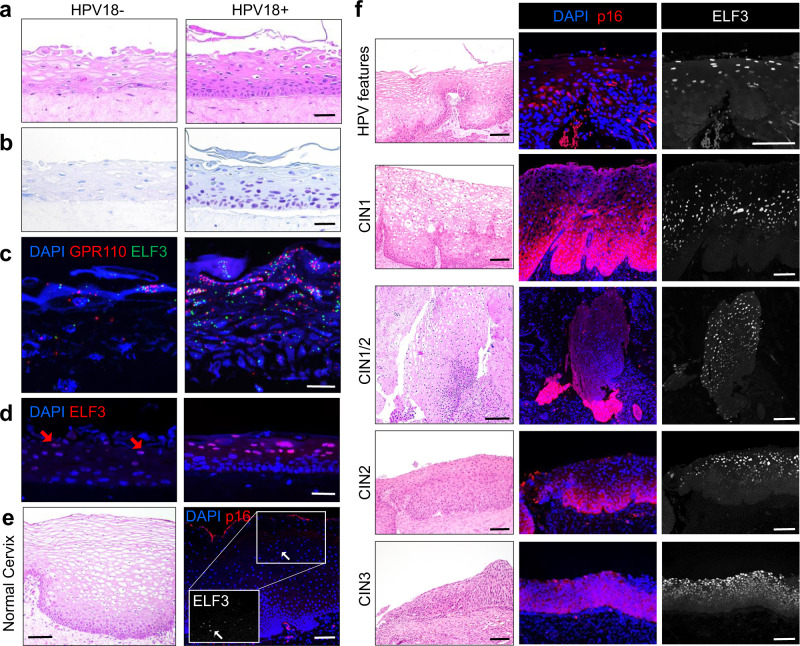
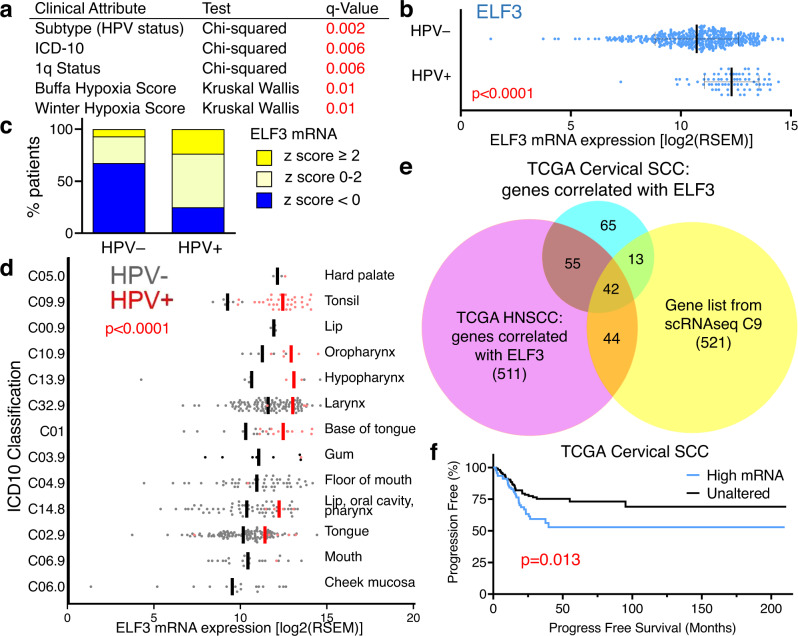
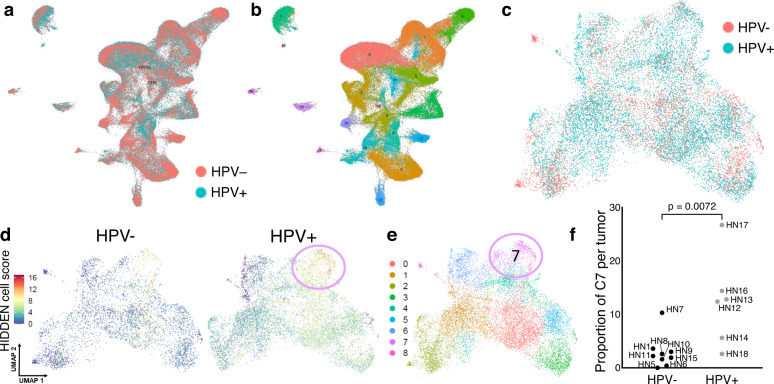
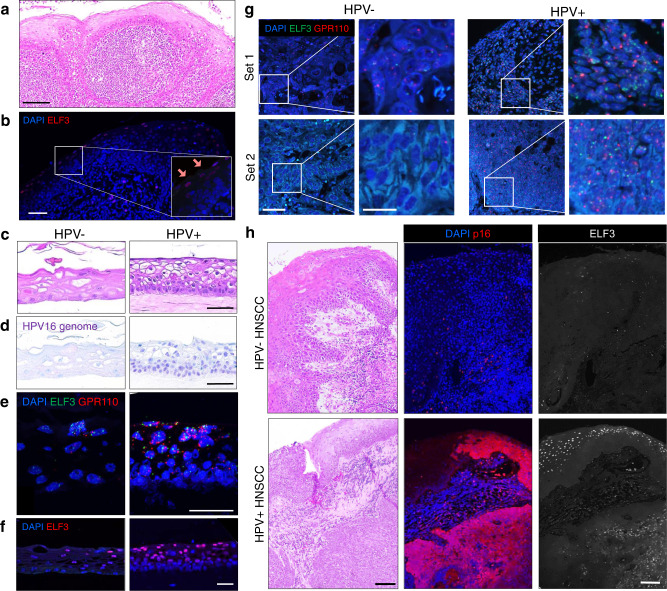
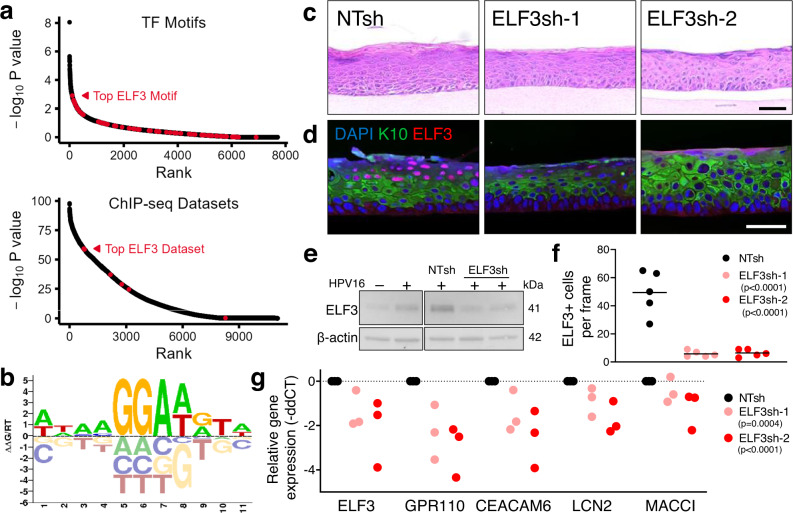
Persistent HPV16 infection is a major cause of the global cancer burden. The viral life cycle is dependent on the differentiation program of stratified squamous epithelium, but the landscape of keratinocyte subpopulations which support distinct phases of the viral life cycle has yet to be elucidated. Here, single cell RNA sequencing of HPV16 infected compared to uninfected organoids identifies twelve distinct keratinocyte populations, with a subset mapped to reconstruct their respective 3D geography in stratified squamous epithelium. Instead of conventional terminally differentiated cells, an HPV-reprogrammed keratinocyte subpopulation (HIDDEN cells) forms the surface compartment and requires overexpression of the ELF3/ESE-1 transcription factor. HIDDEN cells are detected throughout stages of human carcinogenesis including primary human cervical intraepithelial neoplasias and HPV positive head and neck cancers, and a possible role in promoting viral carcinogenesis is supported by TCGA analyses. Single cell transcriptome information on HPV-infected versus uninfected epithelium will enable broader studies of the role of individual keratinocyte subpopulations in tumor virus infection and cancer evolution.


Conflict of interest statement

R.L.F: Adagene Incorporated: Consulting; Aduro Biotech, Inc: Consulting, AstraZeneca/MedImmune: Clinical Trial, Research Funding; Bicara Therapeutics, Inc: Consultant; Bristol-Myers Squibb: Advisory Board, Clinical Trial, Research Funding; Brooklyn Immunotherapeutics LLC: Consultant; Catenion: Consultant; Coherus BioSciences, Inc.: Advisory Board; Eisai Europe Limited: Advisory Board; EMD Serono: Consultant; Everest Clinical Research Corporation: Consultant; F. Hoffmann-La Roche Ltd: Consultant; Federation Bio, Inc: Consultant; Genocea Biosciences, Inc: Consultant; Genmab: Advisory Board; Hookipa Biotech GmbH: Advisory Board; Instil Bio, Inc: Advisory Board; Kowa Research Institute, Inc.: Consultant; Lifescience Dynamics Limited: Advisory Board; MacroGenics, Inc.: Advisory Board; MeiraGTx, LLC: Advisory Board; Merck: Advisory Board, Clinical Trial; Mirati Therapeutics, Inc: Consultant; Mirror Biologics Inc: Supplementary Data Safety Monitoring Board; Nanobiotix: Consultant; Novartis Pharmaceutical Corporation: Consulting; Novasenta: Consulting, Stock, Research Funding; Numab Therapeutics AG: Advisory Board; OncoCyte Corporation: Advisory Board; Pfizer: Advisory Board; PPD Development, L.P.: Consultant; Rakuten Medical, Inc: Advisory Board; Sanofi: Consultant; Seagen, Inc: Advisory Board; SIRPant Immunotherapeutics, Inc: Advisory Board; Tesaro: Research Funding; Vir Biotechnology, Inc: Advisory Board; Zymeworks, Inc.: Consultant. T.J.H.: AstraZeneca, Caris, Clovis, Eisai, Genentech, GlaxoSmithKline, Immunogen, Johnson & Johnson, Merck, Mersana and Seagen (Advisory Boards). The remaining authors declare no competing interests.

Figures

Fig. 1
Fig. 1. Generation of isogenic HPV16+ versus HPV16- squamous epithelia.
a Visual summary. Created with BioRender.com. b Schematic of 3D organotypic epithelial raft generation using HPV16+ and HPV16− NIKS on a collagen scaffold with embedded fibroblasts. c Representative H&E stained images from n = 4 raft sets showing that HPV16+ rafts harbor atypical epithelial cells with koilocytic features, including cellular enlargement, hyperchromatic nuclei, and perinuclear clearing (gray arrow) as well as mitotic cells within the suprabasal layers (black arrow) that are not seen in HPV16− rafts. d Representative DNA-ISH images for HPV16 genome sequences showing HPV detection in rafts (n = 2 independent raft sets) generated from HPV16+, but not HPV16−, keratinocytes. e RT-qPCR (n = 4 HPV16+ rafts) for viral genes showing strong expression of early viral genes E1, E6, and E7 when compared to the late viral L1 gene, in line with a largely non-productive life cycle. Data were presented as mean values ± SD. f Southern blot analysis (n = 1) showing a modest increase in HPV16 genome copy number per cell in 3D rafts vs 2D monolayer cells. Strong expression of clinical markers indicative of HPV+, including exportin-5 (g) and p16 (h) is observed in HPV16+ but not HPV16− epithelium by IHC, counterstained with hematoxylin. Scale bars, 25 µm. Representative images were selected from n = 1 raft sets (g) or n = 3 raft sets (h). Source data are provided in the Source Data file.
Fig. 2
Fig. 2. scRNAseq of isogenic HPV16+ and HPV16– epithelium defines 12 distinct keratinocyte subpopulations.
a Schematic of the scRNAseq workflow using 3D epithelial rafts. b Combined UMAP of HPV16− (blue) and HPV16+ (red) keratinocytes that were jointly analyzed shows significant overlap following batch correction (n = 1 matched set). c Feature plots for HPV16 viral gene expression. Unbiased clustering reveals 12 transcriptomically distinct cell populations displayed as a heatmap (d) and UMAP (e). Gene lists per cluster are provided in Supplementary Data 2. Each keratinocyte subpopulation was assigned a number and color, and the origin of cells (from HPV16– or HPV16+ rafts) was indicated in gray versus black to highlight cluster composition. f Distribution of cells in HPV16+ and HPV16− epithelium reveals enrichment of HPV16+ cells in C6, C8, and C9 (arrows). Source data is provided in the Source Data file.
Fig. 3
Fig. 3. Pseudotime analysis aligns cells along the differentiation program of 3D stratified epithelium.
a Pseudotemporal trajectory analysis, excluding the divergent C9 subpopulation, indicates a linear progression of clusters (n = 1 matched set). b Pseudotime heatmap with select highlighted genes reflects a progression from basal to differentiated cell types; full list of genes, Supplementary Data 2. c The pseudotime violin plot splits the majority of clusters into primarily early (C10, C7, C6, C4, and C5) or late (C1, C8, C0, C11, C2, and C3) stages in the trajectory. Gene expression of established markers of stratified epithelial layers confirms a progression from basal to differentiated populations; shown over pseudotime (d) and UMAPs (e). f IHC staining validates the organization of layers of the stratified epithelium in the HPV16− versus HPV16+ 3D epithelium, with less intense staining in HPV16+ suprabasal layers. Scale bar, 100 µm. Representative image selected from n = 10 frames taken per n = 3 raft sets. g IHC staining of normal human skin is shown for comparison. Scale bars, 50 µm. Representative image selected from n = 3 frames taken per n = 2 patient biopsies.
Fig. 4
Fig. 4. Spatial localization of the terminally differentiated KLK7+ C3 keratinocyte subpopulation in stratified squamous epithelium.
a Feature plots showing differentiation markers and candidate cluster-defining markers for clusters C2 and C3 by UMAP (n = 1 matched set). b Dual expression plot visualizing cluster-defining markers of C2 (DSG1+) versus C3 (KLK7+) cells, demonstrating minimal overlap of cells with high dual expression. c RT-qPCR validation of selected cluster markers confirm similar levels of expression in HPV16− and HPV16+ rafts (n = 2). d Relative gene expression of C3 and C3 cluster markers in differentiated (overconfluent and raft cultures) vs undifferentiated (subconfluent) HPV− cells validates upregulation of C2 and C3 subpopulations with differentiation (n = 2). e Localization of the terminally differentiated KLK7+ C3 subpopulation in 3D epithelium by RNA-ISH. The red bracket is representative of the raft thickness measured above KLK7+ cells and the blue bracket of full raft thickness, measures used to quantify the unstained compartment superjacent to C3 KLK7 + cells in HPV16 + epithelium. Scale bar, 25 µm. f Quantification of the unstained compartment above KLK7+ cells by relative percent raft thickness (e.g., red bracket relative to blue bracket in e) for three sets of HPV ± rafts (n = 10 per raft, mean ± SD, two-way ANOVA with Sidak’s multiple comparisons, p < 0.0001). g Average quantification of (f) as the mean ± SEM (n = 3 rafts, two-way ANOVA, p < 0.0001). Source data (c, d, f, g) are provided in the Source Data file.
Fig. 5
Fig. 5. C9 cells occupy the superficial cell layers of the HPV16+ epithelium.
a Feature plots visualize expression of select C9-defining markers (n = 1 matched set). b Subset of RT-qPCR validation shows increased expression of C9 markers in HPV16+ vs HPV16− epithelium (n = 2). Additional C9 biomarker validation is shown in Supplementary Fig. 2B. c RNA-ISH validation in 3D epithelium for C9 biomarkers shows many cells with multiple puncta in HPV16+ epithelium, primarily in superficial suprabasal layers, vs very few in HPV16− epithelium. Scale bar, 25 µm. Arrows highlight positive staining in cells. d Quantification of total ELF3 or GPR110 puncta in three matched sets of rafts (n = 10 frames per raft with data presented as the mean ± SD, two-way ANOVA with Sidak’s multiple comparisons, all comparisons p < 0.0001) showing consistently higher total number of transcripts in HPV+ vs HPV− rafts. The distribution of ELF3 (e) and GPR110 (f) expression across rafts by quintile, where Q5 is basal and Q1 is the uppermost raft fifth, spatially locates C9 marker expression to the most suprabasal raft layers (n = 3 rafts presented as mean ± SEM, two-way ANOVA with Turkey’s multiple comparisons test, p values indicated per comparison). g IF showing a compartment of ELF3+/LCN2+ cells, specifically in HPV16+ rafts that is superjacent to the K10+ differentiated layer and confirms protein-level expression of C9 markers. Scale bar, 25 µm. h Quantification of ELF3+ cells by IF across three matched sets of rafts (n = 10 frames per raft presented as mean values ± SD, two-way ANOVA with Sidak’s multiple comparisons, all comparisons p < 0.0001). i Average number of ELF3+ cells by IF per frame in HPV+ vs HPV− rafts (n = 3 rafts represented as mean ± SEM, two-way ANOVA, p < 0.0001). Source data (b, df, h, i) are provided in the Source Data file.
Fig. 6
Fig. 6. HIDDEN cells are detected in HPV+ cervical rafts and in premalignant cervical lesions.
ad Representative images from n = 10 across each raft set (n = 1). a H&E of primary human cervical epithelial cells, with or without HPV18, engineered into 3D organotypic rafts. Scale bar, 50 µm. b DNA-ISH shows that all cells harbor HPV genomes in HPV+ but not HPV− epithelial rafts. Scale bar, 50 µm. c RNA-ISH for GPR110 and ELF3 shows increased puncta in HPV+ vs HPV− epithelium. Scale bar, 25 µm. d IF for ELF3 shows many intensely stained nuclei in the suprabasal compartment of HPV+ cervical rafts, with few and weakly stained ELF3+ cells (red arrows) in their HPV− counterparts. Scale bar, 50 µm. e Very few, lightly stained ELF3+ cells (arrows) are detected by IF in normal, p16-negative cervical epithelium (white arrow). Scale bar, 100 µm. Representative image from n = 2 patient biopsies. f Conversely, many strongly stained ELF3 + cells are observed in p16+ tissue harboring features of HPV infection, and in p16+ CIN1-3 lesions, both determined by a board-certified pathologist. Scale bar (H&Es and IFs), 100 µm. Representative images of n = 2 patient biopsies from each CIN stage.
Fig. 7
Fig. 7. The ELF3-dependent C9 cell population is associated with HPV+ head and neck and cervical SCC.
ad Analysis of the TCGA PanCancer Atlas for HNSCC (n = 488 patients). a Table summarizing clinical attributes with statistically significant differences between patients with high ELF3 vs normal ELF3 mRNA expression. b ELF3 has increased mRNA expression in HPV+ HNSCC (data were represented as mean values ± SD, Mann–Whitney test, p < 0.0001). c An increased number of HPV+ HNSCC patients (75%) have above average ELF3 mRNA expression vs HPV- HNSCC (32%). d ICD-10 classification of HNSCC labeled by anatomical site with lines representing mean values split by HPV status (two-way ANOVA, p = 0.015 between sites and p < 0.0001 by HPV status). e Venn Diagram showing overlap of the scRNAseq C9 gene list (621 total genes including ELF3) with genes correlated with ELF3 in the TCGA PanCancer Atlas for HNSCC (652 total genes) and cervical SCC studies (175 total genes). Lists are provided in Supplementary Data 5. f The Kaplan–Meier survival curve for cervical SCC patients (n = 275) with high versus normal mRNA expression of 19 co-occurring markers (Log-rank test, p = 0.013). bf Source data are provided in the Source Data file.
Fig. 8
Fig. 8. HIDDEN cells are detected in HPV+ vs HPV− HNSCC scRNAseq data.
a UMAP of all cells from published scRNAseq data of nine HPV− and six HPV+ HNSCC patient biopsies processed through our transcriptomic pipeline. b Transcriptomically distinct clusters, with each color representing a distinct cell subpopulation. c UMAP of keratinocytes only, with cells colored by HPV status of originating HNSCC. d UMAP of HPV− and HPV+ HNSCC epithelial cells with cells colored by the number of HIDDEN cell biomarkers expressed (18 total) shows enrichment in HPV+ HNSCCs, particularly in the area indicated with a circle. e scRNAseq clusters of epithelial subpopulations identify C7 as having the highest expression of HIDDEN cell biomarkers. f The proportion of C7 cells from each tumor demonstrates that all but one (HPV− tumor HN5, 0%) is represented in C7, with a greater proportion of cells originating from HPV+ tumors (two-tailed unpaired t-test with n = 9 HPV− tumors and n = 6 HPV+ tumors, p = 0.0072). Source data are provided in the Source Data file.
Fig. 9
Fig. 9. HIDDEN cells are detected in HPV+ tonsil-derived epithelium and in HNSCC patient biopsies.
a Representative H&E from n = 5 frames of the patient tonsil (Donor A) that was used to culture patient-derived tonsil keratinocytes to support experiments. Scale bar, 100 µm. b Representative IF showing few cells with light ELF3+ staining (arrows in inset) in tonsil tissue, indicating the relative absence of HIDDEN cells. Scale bar, 100 µm, n = 5 frames across tonsil tissue. cf Representative images from n = 10 frames from a raft set generated from Donor A. cf Scale bar, 50 µm. c Representative H&Es of epithelial rafts generated from tonsil-derived keratinocytes from Donor A that were either nucleofected with HPV16 or not nucleofected. Many more basal cells are seen in HPV+ tonsil epithelium. Scale bar, 50 µm d DNA-ISH for HPV genomes confirms HPV status of 3D rafts. e RNA-ISH for ELF3 and GPR110 shows few cells with puncta in HPV− rafts, and many puncta in HPV+ rafts. f IF staining reveals significant upregulation of ELF3+ HIDDEN cells in the suprabasal compartment. g, h Representative images from n = 10 frames from two p16+ and two p16− HNSCC biopsies. g RNA-ISH for HIDDEN cell biomarkers ELF3 and GPR110 shows many puncta in HPV+ vs HPV− HNSCC patient biopsies. Scale bar, 50 µm in the main image and 20 µm in an insert. h Representative images of HNSCC tumors stained by H&E stain and by IF. Stain for p16 confirms the HPV status of tumors and ELF3 staining demonstrates protein-level expression of HIDDEN cells, specifically in HPV+ HNSCCs. Scale bars, 100 µm.
Fig. 10
Fig. 10. The HIDDEN cell compartment requires ELF3 expression.
a Summary of RELI (top) and HOMER (bottom) analysis indicating ELF3 hits in red (permutation-based strategies detailed in Methods.) Source data is provided in Supplementary Data 6. b The ELF3 motif was identified by HOMER and RELI analysis as a potential driver of HIDDEN cell formation. c Representative H&E images from n = 1 raft set generated from HPV16+ cells transduced with NTsh or ELF3sh constructs. Scale bar, 50 µm. d Representative IF image from n = 1 raft set of HPV16+ NTsh rafts and ELF3sh rafts validates a dramatic decrease in ELF3+ HIDDEN cells, localized on the surface epithelium, with ELF3 knockdown and elimination of the ELF3+ HIDDEN cell compartment suprabasal to the K10+ layer (representative of n = 5 frames across 1 set of rafts). Scale bar, 50 µm. e Western blot of 3D raft lysates shows increased ELF3 protein levels in HPV+ vs HPV16– rafts, and a decrease in ELF3 in ELF3sh knockdown vs NTsh control rafts. f Quantification of the number of ELF3+ cells per frame, (n = 5 per raft with lines representing mean values, two-way ANOVA with Dunnett’s multiple comparisons against NTsh, p < 0.0001 for ELF3sh-1 and ELF3sh-2). g RT-qPCR of HIDDEN cell biomarkers is consistently decreased in ELF3sh rafts compared to NTsh rafts (n = 3 rafts, two-way ANOVA with Dunnett’s multiple comparisons against NTsh, p < 0.0001 for ELF3sh-1 and ELF3sh-2). f, g Source data is provided in the Source data file.

Similar articles

Cited by

References

    1. zur Hausen H. The search for infectious causes of human cancers: where and why (Nobel lecture) Angew. Chem. Int. Ed. Engl. 2009;48:5798–5808. doi: 10.1002/anie.200901917. - DOI - PubMed
    1. McBride AA. Human papillomaviruses: diversity, infection and host interactions. Nat. Rev. Microbiol. 2022;20:95–108. doi: 10.1038/s41579-021-00617-5. - DOI - PubMed
    1. Della Fera AN, et al. Persistent human papillomavirus infection. Viruses. 2021;13:321. doi: 10.3390/v13020321. - DOI - PMC - PubMed
    1. Bosch FX, et al. The causal relation between human papillomavirus and cervical cancer. J. Clin. Pathol. 2002;55:244–265. doi: 10.1136/jcp.55.4.244. - DOI - PMC - PubMed
    1. Serrano B, et al. Epidemiology and burden of HPV-related disease. Best Pract. Res. Clin. Obstet. Gynaecol. 2018;47:14–26. doi: 10.1016/j.bpobgyn.2017.08.006. - DOI - PubMed

Publication types

Substances