. 2023 Apr 8;14(1):1967.
doi: 10.1038/s41467-023-37570-1.

Predicting compound activity from phenotypic profiles and chemical structures

Affiliations

Predicting compound activity from phenotypic profiles and chemical structures

Nikita Moshkov et al. Nat Commun. .

Abstract

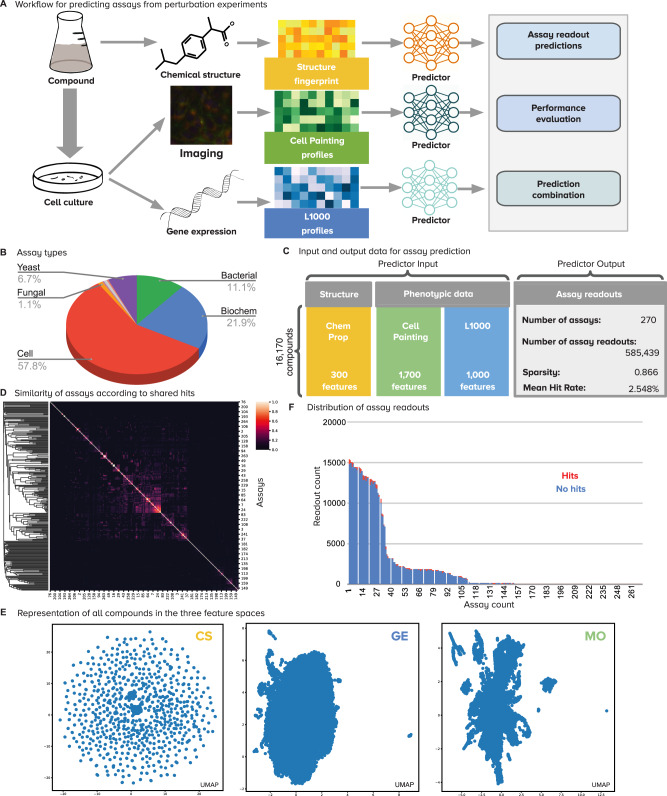
Predicting assay results for compounds virtually using chemical structures and phenotypic profiles has the potential to reduce the time and resources of screens for drug discovery. Here, we evaluate the relative strength of three high-throughput data sources-chemical structures, imaging (Cell Painting), and gene-expression profiles (L1000)-to predict compound bioactivity using a historical collection of 16,170 compounds tested in 270 assays for a total of 585,439 readouts. All three data modalities can predict compound activity for 6-10% of assays, and in combination they predict 21% of assays with high accuracy, which is a 2 to 3 times higher success rate than using a single modality alone. In practice, the accuracy of predictors could be lower and still be useful, increasing the assays that can be predicted from 37% with chemical structures alone up to 64% when combined with phenotypic data. Our study shows that unbiased phenotypic profiling can be leveraged to enhance compound bioactivity prediction to accelerate the early stages of the drug-discovery process.


Conflict of interest statement

The Authors declare the following competing interests: S.S. and A.E.C. serve as scientific advisors for companies that use image-based profiling and Cell Painting (A.E.C:Recursion, S.S.:Waypoint Bio, Dewpoint Therapeutics) and receive honoraria for occasional talks at pharmaceutical and biotechnology companies. All other authors declare no competing interests.

Figures

Fig. 1
Fig. 1. Overview of the workflow and data.
A Workflow of the methodology for predicting diverse assays from perturbation experiments (more details in Supplementary Figs. 1 and 2). B Types of assay readouts targeted for prediction, which include a total of eight categories (Supplementary Fig. 15). C Structure of the input and output data for assay prediction. D Similarity of assays according to the Jaccard similarity between sets of positive hits. Most assays have independent activity (Supplementary Fig. 13). E UMAP visualizations of all compounds in the three feature spaces evaluated in this study (Supplementary Fig. 10). CS (yellow) Chemical Structure, GE (blue) Gene Expression, MO (green) Morphology. F Distribution of assay readouts for assays in the horizontal axis sorted by readout counts. The available examples follow a long tail distribution and the average ratio of positive hits to tested compounds (hit rate) is 2.548%.
Fig. 2
Fig. 2. Number of assays that can be accurately predicted using single profiling modalities.
All reported numbers are the median result of the five-fold cross-validation experiments run in the dataset. A Performance of individual modalities measured as the number of assays (vertical axis) predicted with AUROC above a certain threshold (horizontal axis). With higher AUROC thresholds, the number of assays that can be predicted decreases for all profiling modalities. We define accurate assays as those with AUROC greater than 0.9 (dashed vertical line in blue). B The Venn diagrams on the right show the number of accurate assays (median AUROC > 0.9) that are in common or unique to each profiling modality. The bar plot shows the distribution of assay types correctly predicted by single profiling modalities. C Distribution of performance of data modalities over all assays. Points are the median AUROC scores of n = 270 assays. Box plot elements: center line, median; box limits, upper and lower quartiles; whiskers, 1.5x interquartile range; points, all points presented using a swarmplot. D Number of assays well predicted (median AUROC > 0.9) by each individual modality (first row is the same as in Fig. 3B). E Performance of chemical structure features on the assay prediction task: graph convolutions are learned representations, while Morgan Fingerprints are classical representations. CS Chemical Structure, GE Gene Expression, MO Morphology, AUROC Area under the receiver operating characteristic, AUPRC Area under the precision recall curve, Conv convolutions, FP fingerprints.
Fig. 3
Fig. 3. Number of assays that can be accurately predicted using combinations of profiling modalities.
Accurate predictors are defined as models with accuracy greater than 0.9 AUROC. We considered all four modality combinations using late data fusion in this analysis: CS + MO (chemical structures and morphology), CS + GE (chemical structures and gene expression), GE + MO (gene expression and morphology), and CS + GE + MO (all three modalities). A The Venn diagram shows the number of accurately predicted assays that are in common or unique to fused data modalities. The bar plots in the center show the distribution of assay types correctly predicted by the fused models. All counts are the median of results in the holdout set of a fivefold cross-validation experiment. B Performance of individual modalities (same as in first row of Fig. 2D). C The number of accurate assay predictors (AUROC > 0.9) obtained for combinations of modalities (columns) using late data fusion following predictive cross-validation experiments. D Retrospective performance of predictors using oracle counts. These counts indicate how many unique assays can be predicted with high accuracy (AUROC > 0.9), either by single or fused modalities. “Single” is the total number of assays reaching AUROC > 0.9 with any one of the specified modalities, i.e., take the best single-modality predictor for an assay in a retrospective way. This count corresponds to the simple union of circles in the Venn diagram in Fig. 2B, i.e., no data fusion is involved. “Plus fusion” is the same, except that it displays the number of unique assays that reach AUROC > 0.9 with any individual or data-fused combination. This count corresponds to the union of circles in the Venn diagram in Fig. 2B plus the number of additional assays that reach AUROC > 0.9 when the modalities are fused. For example, the last column counts an assay if its AUROC > 0.9 for any of the following: CS alone, GE alone, MO alone, data-fused CS + GE, data-fused GE + MO, data-fused CS + MO, and data-fused CS + GE + MO. E Distribution of performance of combinations of predictors over all assays. Points are the median AUROC scores of n = 270 assays. Box plot elements: center line, median; box limits, upper and lower quartiles; whiskers, 1.5x interquartile range; points, all points presented using a swarmplot. CS Chemical Structure, GE Gene Expression, MO Morphology, AUROC Area under the receiver operating characteristic, + late fusion, ★ choose best.
Fig. 4
Fig. 4. Prediction performance of example assays where data fusion successfully improves prediction accuracy.
Not all assays benefit from data fusion: see Fig. 3 for summary statistics of all assays. The plots are Receiver Operating Characteristic (ROC) curves and the area under the curve (AUROC) is reported for each modality with the corresponding color. A Four example assays from left to right: Cystic fibrosis transmembrane conductance regulator CFTR (cell-based), Ras selective lethality (cell-based), esBAF inhibitor (cell-based), SirT5 (biochemical). B Performance of predictors for the same assays when using combinations of profiling methods. C Table of AUROC scores of the four example assays (rows) according to predictors with individual and combined data modalities (columns). Numbers in bold are the highest AUROC scores for each assay (in a row). Abbreviations. CS: Chemical Structure, GE: Gene Expression, MO: Morphology.

Similar articles

Cited by

References

    1. Moffat JG, Vincent F, Lee JA, Eder J, Prunotto M. Opportunities and challenges in phenotypic drug discovery: an industry perspective. Nat. Rev. Drug Discov. 2017;16:531–543. doi: 10.1038/nrd.2017.111. - DOI - PubMed
    1. Haasen D, et al. How phenotypic screening influenced drug discovery: lessons from five years of practice. Assay. Drug Dev. Technol. 2017;15:239–246. doi: 10.1089/adt.2017.796. - DOI - PubMed
    1. Warchal SJ, Unciti-Broceta A, Carragher NO. Next-generation phenotypic screening. Future Med. Chem. 2016;8:1331–1347. doi: 10.4155/fmc-2016-0025. - DOI - PubMed
    1. Varnek A, Baskin I. Machine learning methods for property prediction in chemoinformatics: Quo Vadis? J. Chem. Inf. Model. 2012;52:1413–1437. doi: 10.1021/ci200409x. - DOI - PubMed
    1. Stokes JM, et al. A deep learning approach to antibiotic discovery. Cell. 2020;180:688–702.e13. doi: 10.1016/j.cell.2020.01.021. - DOI - PMC - PubMed

Publication types

MeSH terms