. 2023 Apr 8;13(1):5790.
doi: 10.1038/s41598-023-32545-0.

Impact of porous microsponges in minimizing myotoxic side effects of simvastatin

Affiliations

Impact of porous microsponges in minimizing myotoxic side effects of simvastatin

Ahmed U Ali et al. Sci Rep. .

Abstract

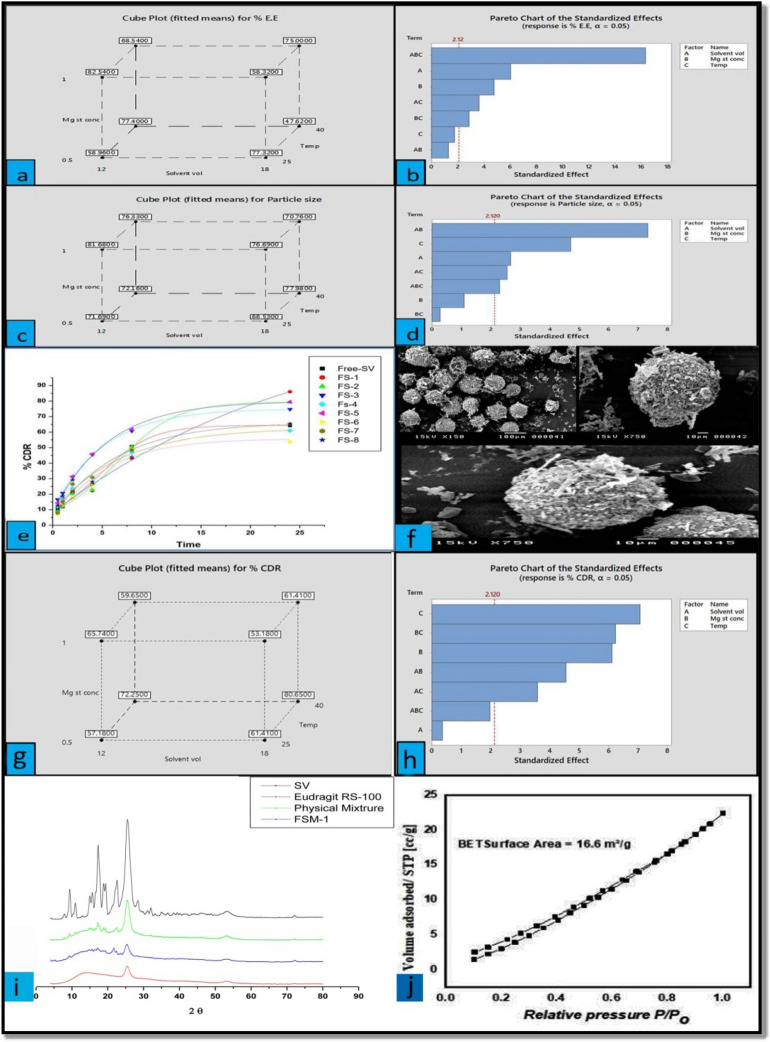
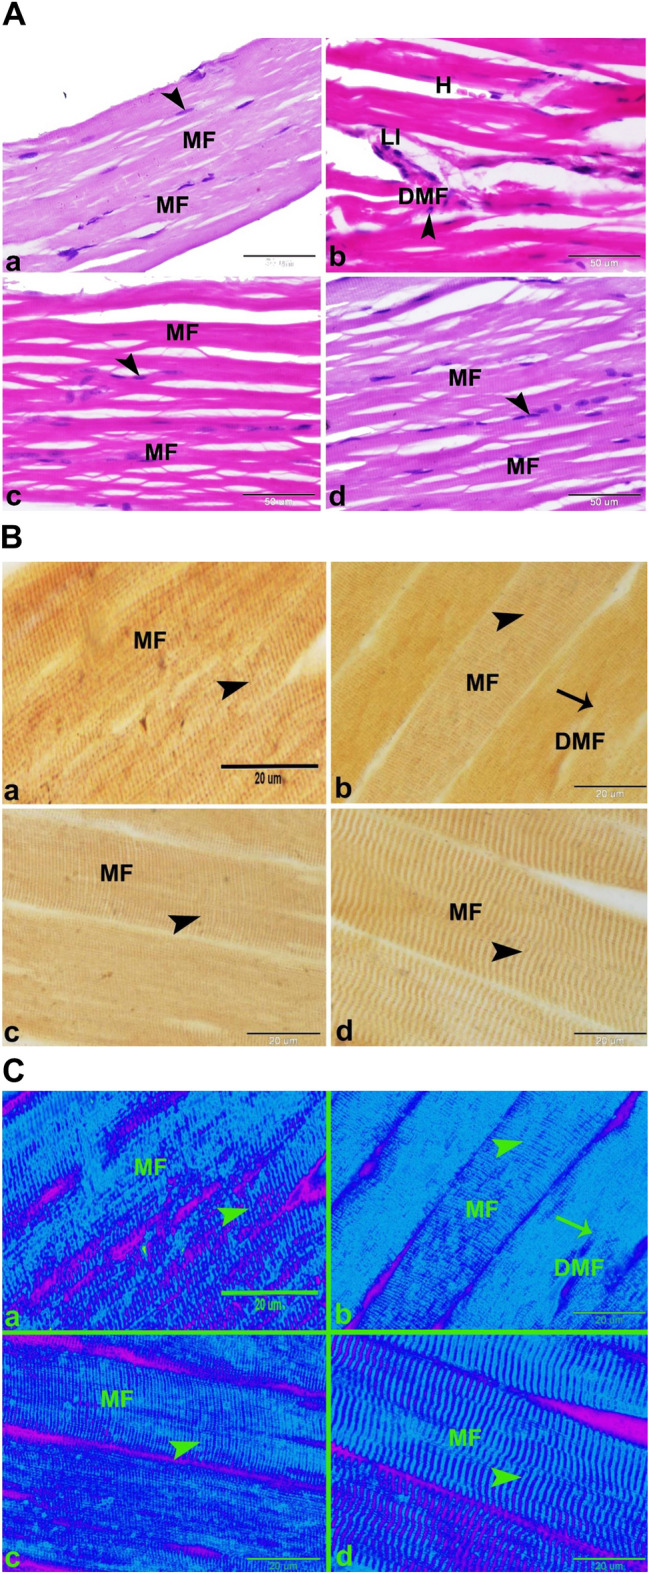
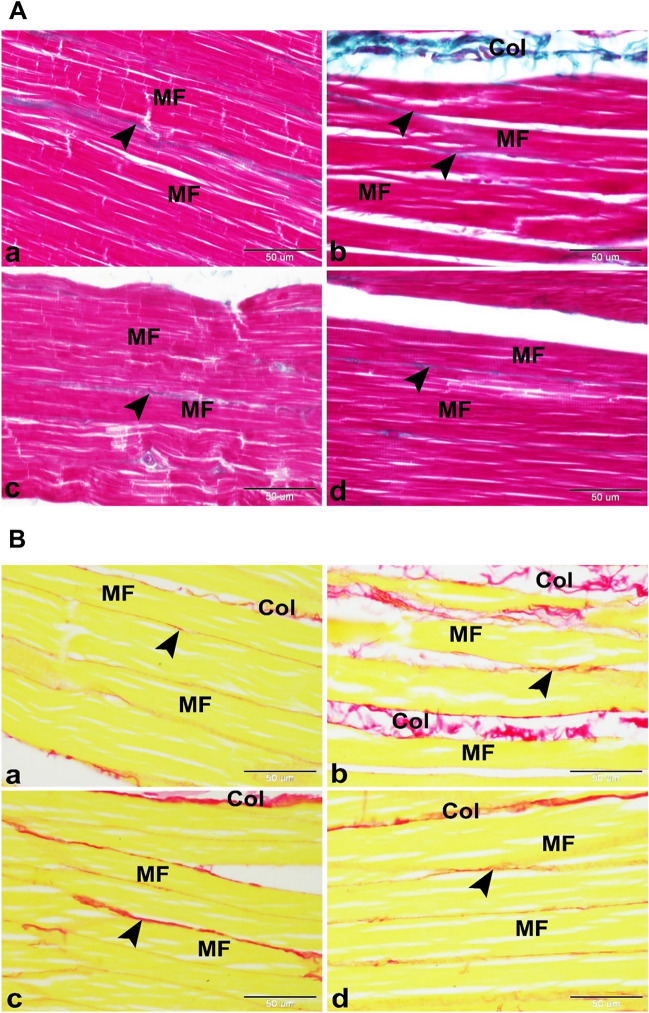
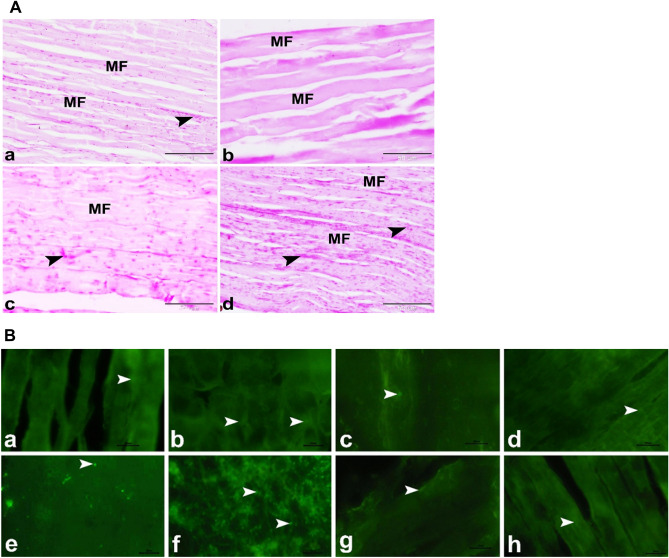
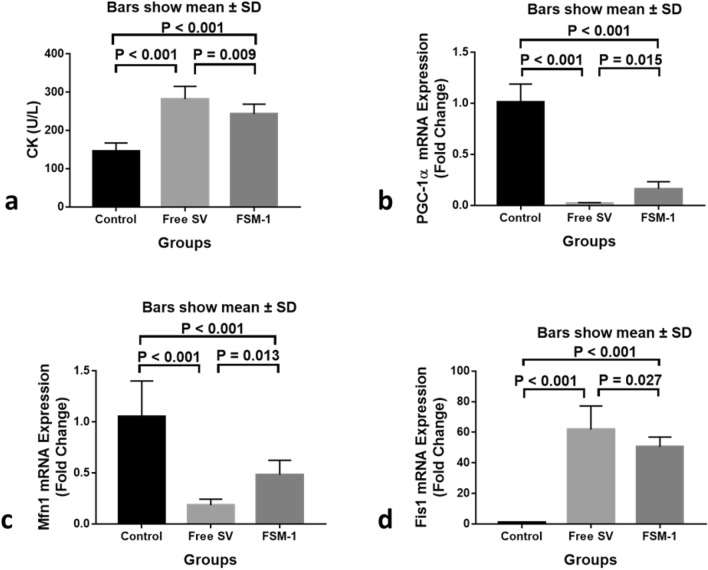
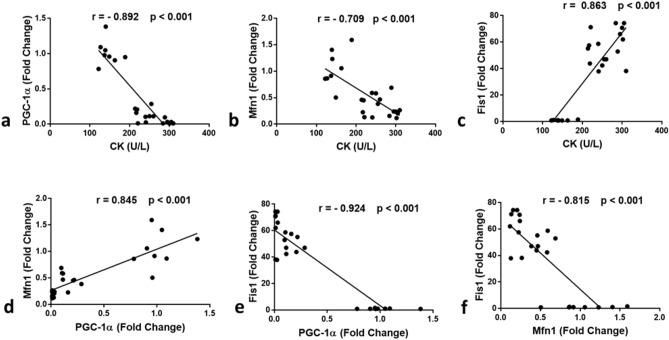
Simvastatin (SV) is a poorly soluble drug; its oral administration is associated with a significant problem: Myopathy. The present study aims to formulate SV microsponges that have the potential to minimize the myotoxicity accompanying the oral administration of the drug. SV microsponges were prepared by exploiting the emulsion solvent evaporation technique. The % entrapment efficiency (%EE) of the drug approached 82.54 ± 1.27%, the mean particle size of SV microsponges ranged from 53.80 ± 6.35 to 86.03 ± 4.79 µm in diameter, and the % cumulative drug release (%CDR) of SV from microsponges was significantly higher than that from free drug dispersion much more, the specific surface area of the optimized microsponges formulation was found to be 16.6 m2/g revealed the porosity of prepared microsponges. Histological and glycogen histochemical studies in the skeletal muscles of male albino rats revealed that microsponges were safer than free SV in minimizing myotoxicity. These findings were proven by Gene expression of Mitochondrial fusion and fission (Mfn1) & (Fis1) and (Peroxisome proliferator-activated receptor gamma co-activator 1α) PGC-1α. Finally, our study ascertained that SV microsponges significantly decreased the myotoxicity of SV.


Conflict of interest statement

The authors declare no competing interests.

Figures

Figure 1
Figure 1
(a) Cube plot (fitted means) for %EE. (b) Pareto chart of standardized effects (response is %EE. (c) Cube plot (fitted means) for particle size. (d) Pareto chart of standardized effects (response is particle size). (e) In vitro release profile of SV from different micrsoponges formulations and free SV dispersion. (f) Cube Plot (fitted means) for % CDR. (g) Pareto chart of standardized effects: response is %CDR. (h) SEM of optimized formulation of SV microsponges. (i) X-ray diffraction pattern for SV, Eudragit-RS-100, Physical mixture, and FSM-1. (j) N2 adsorption–desorption hysteresis of FSM-1.
Figure 2
Figure 2
(A) Photomicrographs showing minimizing of the myotoxic side effects of SV by using microsponges formulas in rats. (a) Control group showing the normal histological structure of the skeletal muscle in rat. The skeletal muscle was formed of several parallel elongated cylindrical muscle fibers (MF) with multiple flattened peripherally located nuclei (arrowhead) beneath the sarcolemma and acidophilic sarcoplasm. (b) Free SV group showing the myotoxic side effects of SV as; degenerated muscles fibers with deeply stained acidophilic sarcoplasm, pyknotic nucleus (arrowhead), hemorrhage (H) and leucocytic infiltration (LI). (c) FSV-6 group showing slight minimizing of the myotoxic side effects of SV by using microsponges formulation FSV-6. Note the deeply stained skeletal muscle fibers (MF) with multiple flattened peripherally located nuclei (arrowhead) beneath the sarcolemma. (d) FSV-1 group showing minimizing of the myotoxic side effects of SV by using microsponges formulation FSV-1.The skeletal muscle was formed of several parallel elongated cylindrical muscle fibers (MF) with acidophilic sarcoplasm and multiple flattened peripherally located nuclei (arrowhead) beneath the sarcolemma .Hx&E, scale bar = 50 μm. (B) Photomicrographs showing minimizing of the myotoxic side effects of SV by using microsponges formulas in rats. (a) Control group showing the normal skeletal muscle fibers (MF) with clear transvers striations (arrowhead). (b) Free SV group showing the myotoxic side effects of SV as; degenerated skeletal muscle fibers (DMF) with absence or ill clear transvers striations (arrowhead). (c) FSV-6 group showing skeletal muscle fibers (MF) with ill clear transvers striations (arrowhead). (d) FSV-1 group showing minimizing of the myotoxic side effects of SV. Note the skeletal muscle fibers (MF) with clear transvers striations (arrowhead). Silver impregnation technique, scale bar = 50 μm. (C) Negative images of the photomicrographs shown in (B).
Figure 3
Figure 3
(A) Photomicrographs showing minimizing of the myotoxic side effects of SV by using microsponges formulations in rats. (a) Control group showing the normal architecture of the skeletal muscle in rat. The skeletal muscle was formed of several parallel elongated cylindrical muscle fibers (MF) with few amounts of collagen fibers in the endomysium and perimysium. (b) Free SV group showing the myotoxic side effects of SV as increased amounts of collagen fibers in the endomysium (arrowhead) and perimysium (Col) which surround the muscle fibers (MF). (c) FSV-6 group showing few amounts of collagen fibers in the endomysium and perimysium (arrowhead) which surround the muscle fibers (MF). (d) FSV-1 group showing minimizing of the myotoxic side effects of SV. The skeletal muscle was formed of several parallel elongated cylindrical muscle fibers (MF) with few amounts of collagen fibers in the endomysium and perimysium (arrowhead). Masson’s trichrome, scale bar = 50 μm. (B) Photomicrographs showing minimizing of the myotoxic side effects of SV by using microsponges formulas in rats. (a) Control group showing several parallel elongated cylindrical muscle fibers (MF) with few amounts of mature collagen fibers in the endomysium (arrowhead) and perimysium (Col). (b) Free SV group showing the myotoxic side effects of SV as increased amounts of mature collagen fibers in the endomysium (arrowhead) between muscle fibers (MF) and perimysium (Col) surround muscle bundles. (c) FSV-6 group showing slight decrease in amounts of mature collagen fibers in the endomysium (arrowhead) between muscle fibers (MF) and perimysium (Col) surround muscle bundles. (d) FSV-1 group showing few amounts of mature collagen fibers in the endomysium (arrowhead) between muscle fibers (MF) and perimysium (Col) surround muscle bundles. Sirius red, scale bar = 50 μm.
Figure 4
Figure 4
(A) Photomicrographs showing minimizing of the myotoxic side effects of SV by using microsponges formulas in rats. (a) Control group showing the normal architecture of the skeletal muscle in rat. The skeletal muscle was formed of several parallel elongated cylindrical muscle fibers (MF) with large amounts of PAS positive glycogen (arrowhead) in the sarcoplasm. (b) Free SV group showing the myotoxic side effects of SV as depletion of PAS positive glycogen (arrowhead) in the sarcoplasm of the wavy muscle fibers (FM). (c) FSV-6 group showing increased amounts of PAS positive glycogen (arrowhead) in the sarcoplasm of muscle fibers (FM). (d) FSV-1 group showing minimizing of the myotoxic side effects of SV. The skeletal muscle was formed of several parallel elongated cylindrical muscle fibers (MF) with large amounts of PAS positive glycogen (arrowhead) in the sarcoplasm. PAS, scale bar = 50 μm. (B) Photomicrograph of GR (a–d) and SOD2 (e–h) immunostaining in the skeletal muscles; (a,e) Control group, (b,f) Free SV group, (c,g) FSV-6 group and (d,h) FSV-1 group showing that GR immuno-expression (arrowheads) was nearly similar in all experimental groups, while SOD2 immuno-expression (arrowheads) was significantly increased in SV group and it was significantly decreased in FSV-6 group and FSV-1 group compared to control group, scale bar = 20 μm.
Figure 5
Figure 5
Serum levels of CK (a) and Gene expression levels of PGC-1α (b), MFn1 (c), and Fis1 (d) of the studied groups (n = 8). Data are given as mean ± SD. P < 0.05 is considered significant using a one‐way analysis of variance with LSD post hoc test (n is number/group).
Figure 6
Figure 6
Correlation between (a) CK and PGC-1α; (b) CK and Mfn1; (c) CK and Fis1; (d) PGC-1α and Mfn1; (e) PGC-1α and Fis1; (f) Mfn1 and Fis1. Significant positive correlation was found between (c) CK and Fis1 (r = 0.863, P < 0.001), (d) PGC-1α and Mfn1 (r = 0.845, P < 0.001). On the other hand, significant negative correlation was found (a) CK and PGC-1α (r =  − 0.892, P < 0.001), (b) CK and Mfn1 (r =  − 0.709, P < 0.001), (e) PGC-1α and Fis1 (r =  − 0.924, P < 0.001), (f) Mfn1 and Fis1 (r =  − 0.815, P < 0.001). r: Pearson correlation factor. The Correlations are analyzed between the studied parameters in the control, Free SV, and FSM-1 groups (n = 24).

Similar articles

Cited by

References

    1. Libby P, Okamoto Y, Rocha VZ, Folco E. Inflammation in atherosclerosis: Transition from theory to practice. Circ. J. 2010;74:213–220. doi: 10.1253/circj.CJ-09-0706. - DOI - PubMed
    1. Tobert JA. Lovastatin and beyond: The history of the HMG-CoA reductase inhibitors. Nat. Rev. Drug Discov. 2003;2:517–526. doi: 10.1038/nrd1112. - DOI - PubMed
    1. Ng DS. The role of statins in oxidative stress and cardiovascular disease. Curr. Drug Targets-Cardiovasc. Hematol. Disord. 2005;5:165–175. doi: 10.2174/1568006043586170. - DOI - PubMed
    1. Leite-Moreira AF, Castro-Chaves P. Heart failure: Statins for all? Heart. 2006;92:1537–1538. doi: 10.1136/hrt.2006.089797. - DOI - PMC - PubMed
    1. Sathasivam S. Statin induced myotoxicity. Eur. J. Intern. Med. 2012;23:317–324. doi: 10.1016/j.ejim.2012.01.004. - DOI - PubMed