. 2023 Apr 8;14(1):1980.
doi: 10.1038/s41467-023-37671-x.

Endothelial FAT1 inhibits angiogenesis by controlling YAP/TAZ protein degradation via E3 ligase MIB2

Affiliations

Endothelial FAT1 inhibits angiogenesis by controlling YAP/TAZ protein degradation via E3 ligase MIB2

Rui Li et al. Nat Commun. .

Abstract

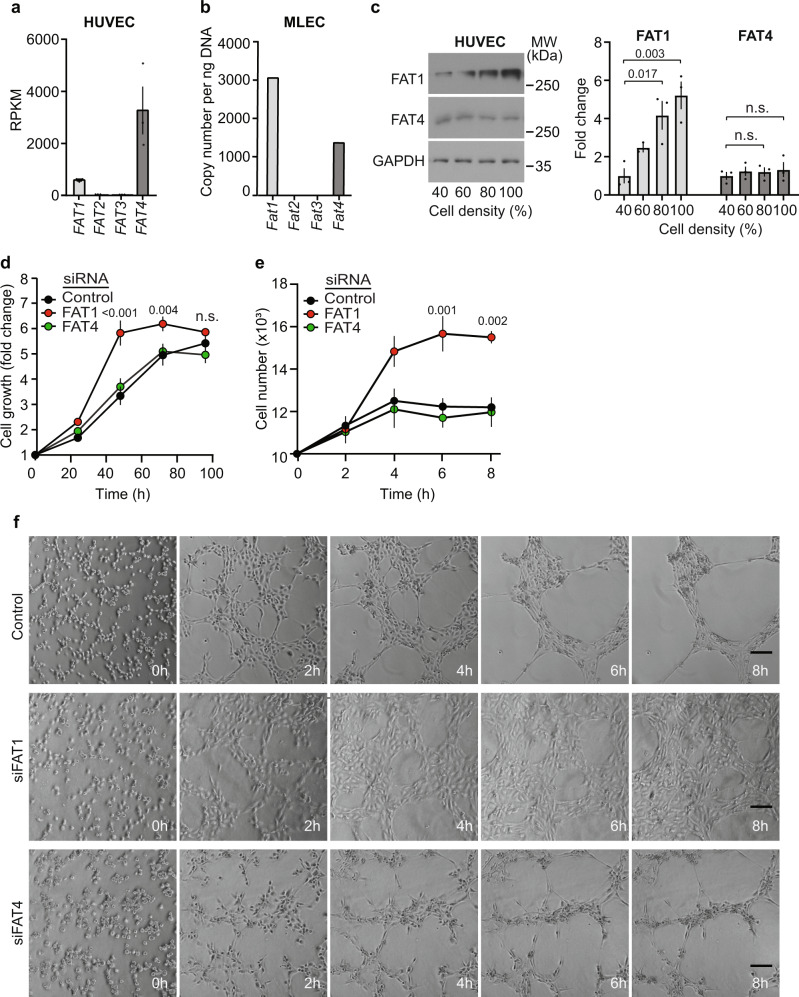
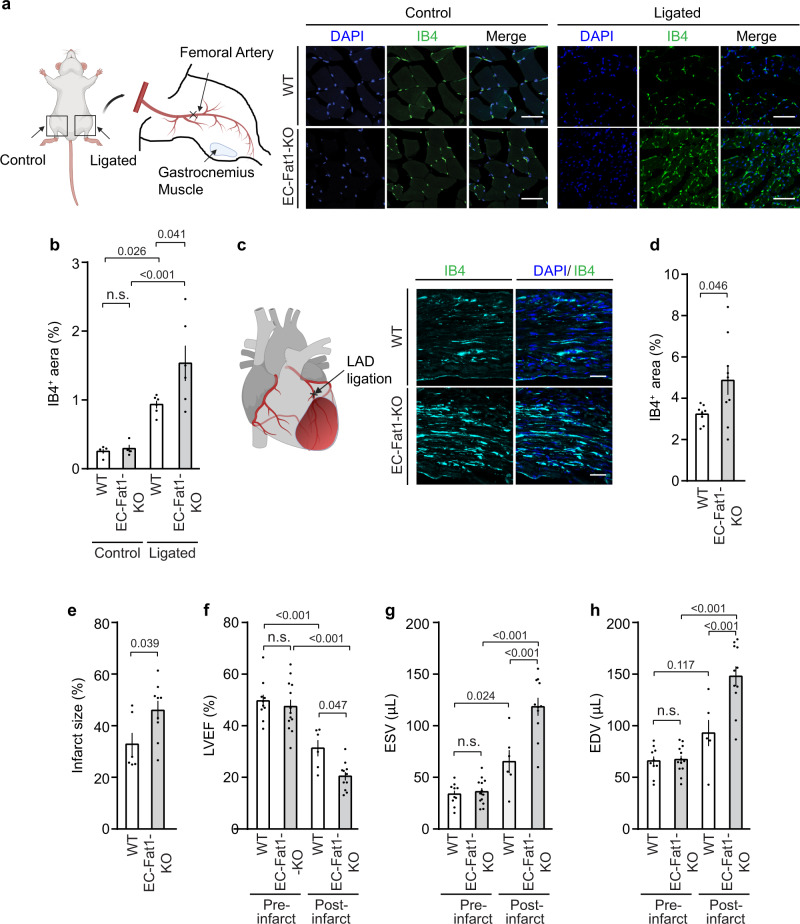
Activation of endothelial YAP/TAZ signaling is crucial for physiological and pathological angiogenesis. The mechanisms of endothelial YAP/TAZ regulation are, however, incompletely understood. Here we report that the protocadherin FAT1 acts as a critical upstream regulator of endothelial YAP/TAZ which limits the activity of these transcriptional cofactors during developmental and tumor angiogenesis by promoting their degradation. We show that loss of endothelial FAT1 results in increased endothelial cell proliferation in vitro and in various angiogenesis models in vivo. This effect is due to perturbed YAP/TAZ protein degradation, leading to increased YAP/TAZ protein levels and expression of canonical YAP/TAZ target genes. We identify the E3 ubiquitin ligase Mind Bomb-2 (MIB2) as a FAT1-interacting protein mediating FAT1-induced YAP/TAZ ubiquitination and degradation. Loss of MIB2 expression in endothelial cells in vitro and in vivo recapitulates the effects of FAT1 depletion and causes decreased YAP/TAZ degradation and increased YAP/TAZ signaling. Our data identify a pivotal mechanism of YAP/TAZ regulation involving FAT1 and its associated E3 ligase MIB2, which is essential for YAP/TAZ-dependent angiogenesis.


Conflict of interest statement

The authors declare no competing interests.

Figures

Fig. 1
Fig. 1. Loss of endothelial FAT1 increases cell proliferation.
a, b Expression of FAT1-4 in HUVECs (a) and mouse lung endothelial cells (MLECs) (b) determined by RNA-sequencing (a; n = 3 independently performed experiments) and RT-qPCR (b). c HUVECs were cultured and lysed at the indicated densities. Thereafter, protein levels of FAT1 and FAT4 were analyzed by Western blotting. GAPDH served as a loading control. Shown is a representative experiment and the statistical evaluation of a densitometric analysis (n = 3 independent experiments). d HUVECs were transfected with control siRNA or siRNA directed against FAT1 or FAT4 and cell proliferation was determined using a colorimetric cell proliferation assay 24, 48, 72 and 96 h after seeding of cells. Results were expressed as the fold change relative to the cell numbers at 0 h (time of transfection) (n = 6 independent experiments). e, f HUVECs transfected with control siRNA or siRNA directed against FAT1 or FAT4 were seeded in matrigel for 3D culture. Cells were counted after matrigel digestion. Shown are the statistical evaluation (e; n = 3 independently performed experiments) as well as pictures taken directly after seeding and every 2 h afterwards (f). Bar length: 100 µm. Shown are mean values ± SEM. n.s. non-significant (one-way ANOVA and Tukey’s post hoc test (c) and two-way ANOVA and Bonferroni’s post hoc test (d and e)).
Fig. 2
Fig. 2. Loss of endothelial FAT1 results in increased postnatal and tumor angiogenesis in vivo.
ac Wild-type (WT) and EC-Fat1-KO newborns were treated at P1-3 with tamoxifen, and retinae were prepared at P6. Shown are representative photomicrographs of retinae stained for isolectin B4 (IB4), ERG and cleaved caspase 3 as well as for EdU after treatment for 6 h (a, c) and the statistical evaluation of staining for IB4 (n = 12 mice, WT; n = 9 mice, EC-Fat1-KO), for ERG (n = 11 mice, WT; n = 9 mice, EC-Fat1-KO), for EdU (n = 8 mice, WT; n = 7 mice, EC-Fat1-KO), and for cleaved caspase 3 (n = 6 mice) (b, c). Scale bar: 50 µm. df Tumor development after subcutaneous injection of Lewis lung carcinoma cells (LLC1) or B16 melanoma cells (B16) (d, e) and final tumor weight after 16 and 11 days, respectively (f) (n = 11 animals per group). Bar length (d): 1 cm. g, h Vascularization of LLC1 tumors was determined after staining with DAPI and an anti-CD31 antibody (g, exemplary photomicrograph; h, statistical evaluation) (n = 5 mice per group; 10–15 randomly selected sections were analyzed per mouse). Scale bar (g): 50 µm. i LLC1 tumor-bearing mice received EdU through their drinking water for 1 week before the end of the experiment and EdU-positive endothelial cells (Edu+/CD31+; CD45) were analyzed by flow cytometry (n = 8 mice per group). j Mice subcutaneously injected with B16 tumor cells were sacrificed after 11 days, and the percentage of CD31-positive cells in tumors was analyzed by flow cytometry (n = 7 mice (WT); n = 8 mice (EC-Fat1-KO)). Data are presented as mean ± SEM. n.s. non-significant. Comparisons were performed using two-tailed unpaired t-test (b, c, f, hj) or two-way ANOVA and Bonferroni’s post hoc test (e).
Fig. 3
Fig. 3. Loss of endothelial FAT1 increases ischemia-induced angiogenesis in vivo.
a, b Hind-limb ischemia was induced by femoral artery ligation in wild-type and EC-Fat1-KO mice. Shown are representative photomicrographs of sections of the gastrocnemius muscle of the ligated hind limb (ligated) and of the unligated side (control) 14 days after the operation (n = 5 mice, WT unligated control; n = 4 mice, EC-FAT1-KO unligated control; n = 6 mice, WT and EC-Fat1-KO ligation). Shown are representative sections stained with DAPI and IB4 (a) and the statistical evaluation of the IB4+-area (b). Bar length (a): 50 µm. ch Myocardial ischemia was induced by ligation of the left anterior descending coronary artery in wild-type (WT) and EC-Fat1-KO mice, and vascularization of the infarct zone was determined by IB4 staining (c, d) (n = 8 mice, WT; n = 9 mice, EC-Fat1-KO). Bar length (c): 50 µm. e Quantification of infarct size as determined by picrosirius red staining in hearts from control and EC-Fat1-KO mice after 14 days of acute myocardial infarction (n = 6 mice (WT); n = 9 mice (EC-Fat1-KO)). fh Heart function was analyzed by magnetic resonance imaging of control and EC-Fat1-KO mice before and 14 days after acute myocardial infarction (n = 10 mice (WT pre-infarct); n = 13 mice (EC-Fat1-KO pre-infarct); n = 6 mice (WT post-infarct); n = 11 mice (EC-Fat1-KO post-infarct)). Shown are the left ventricular ejection fraction (LVEF) (f), the end systolic volume (ESV) (g) and the end diastolic volume (EDV) (h). All values are mean ± SEM. n.s. non-significant. Comparisons were performed using one-way ANOVA and Tukey’s post hoc test (b, fh) or two-tailed unpaired t-test (d, e). Drawing displayed in (a) and (c) were created with BioRender.com.
Fig. 4
Fig. 4. YAP/TAZ mediate increased endothelial proliferation in the absence of FAT1 in vitro and in vivo.
a Expression of YAP/TAZ target genes in HUVECs after transfection with control siRNA or siRNA directed against FAT1 (n = 3 (ANKRD1, FAT1) and n = 4 (CYR61, CTGF)) independent experiments; all data normalized to GAPDH and controls were set as 1. b Growth curve of HUVECs after siRNA-mediated knock-down of FAT1, YAP/TAZ or FAT1/YAP/TAZ. Cell growth was determined using a live-cell imaging system as described in the “Methods” section. The time of transfection was set as “0” (n = 4 independent experiments per group). c, d Tumor weight 16 days after subcutaneous injection of Lewis lung carcinoma cells (LLC1) in wild-type (WT), EC-Fat1-KO, EC-Yap/Taz-KO and EC-Fat1/Yap/Taz-KO mice (n = 15 mice (WT); n = 11 mice (EC-Fat1-KO); n = 10 mice (EC-Yap/Taz-KO and EC-Fat1/Yap/Taz-KO)) (c) and percentage of endothelial cells (CD31+CD45) of all cells in LLC1 tumor samples of the indicated genotypes determined by flow cytometry (d) (n = 8 mice (WT); n = 6 mice (EC-Fat1-KO, EC-Yap/Taz-KO and EC-Fat1/Yap/Taz-KO)). All values are mean ± SEM. n.s. non-significant. Comparisons were performed using two-tailed unpaired t-test (a)) or one-way ANOVA and Tukey’s post hoc test (c, d) or two-way ANOVA and Bonferroni’s post hoc test (b).
Fig. 5
Fig. 5. Loss of FAT1 expression results in increased YAP/TAZ protein stability in HUVECs.
a Immunoblot analysis of total and phosphorylated Hippo pathway components in lysates of HUVECs transfected with control siRNA or siRNA directed against FAT1. Shown is a representative blot and the densitometric analysis (n = 3 independent experiments). b YAP/TAZ protein levels in the cytoplasmic and nuclear fraction of HUVECs transfected with control siRNA or siRNA directed against FAT1. LaminA/C and tubulin were used as markers for nuclear and cytoplasmic proteins. Shown are a representative blot and the statistical analysis (n = 3 independent experiments). c HUVECs were transfected with control siRNA or with siRNA directed against FAT1 and were cultured and lyzed at the indicated cell densities. Thereafter, protein levels of FAT1, YAP and TAZ were analyzed by Western blotting (shown is a representative of three independently performed experiments). GAPDH served as a loading control. d YAP and TAZ protein levels in endothelial cells which were isolated from primary LLC1 tumors of control and EC-Fat1-KO mice. Shown is a representative blot and the statistical analysis (n = 3 mice). e YAP and TAZ as well as FAT1 mRNA levels in HUVECs after transfection with control siRNA or siRNA directed against FAT1 (n = 3 independently performed experiments). f YAP and TAZ protein turnover in HUVECs transfected with control siRNA or siRNA directed against FAT1 as determined by incubation of cells with 50 µg/ml of cycloheximide (CHX) for the indicated time periods. Shown is a representative immunoblot and the statistical evaluation (n = 4 (YAP) and n = 5 (TAZ) independent experiments). Data are presented as mean ± SEM. n.s. non-significant (two-tailed unpaired t-test (a, b, d, e) or two-way ANOVA and Bonferroni’s post hoc test (f)).
Fig. 6
Fig. 6. FAT1 interacts with E3 ligases MIB2 to promote YAP/TAZ protein degradation.
a, b HUVECs stably expressing flag-tagged control peptide (control) or flag-tagged intracellular domain of FAT1 fused to the transmembrane domain of the IL-2 receptor (FAT1ICD) were transfected with control siRNA or siRNA directed against endogenous FAT1, and cell proliferation (a) or YAP and TAZ protein levels (b) were determined (mean values ± SEM, n = 10, two-way ANOVA and Bonferroni’s post hoc test (a); 1 representative of 3 independently performed experiments (b)). c Proteins immunoprecipitated with an anti-FLAG antibody from lysates of HUVECs expressing Flag-tagged FAT1ICD or control were analyzed by mass spectrometry. Shown is a volcano plot highlighting enriched proteins in the FAT1ICD interactome. Statistical evaluation was two-sided Bayesian moderated t-test provided by the limma package. The p values were adjusted for multiple hypothesis testing using the method by Benjamini–Hochberg. d FAT1 was immunoprecipitated from HUVECs transfected with control siRNA or siRNA directed against FAT1, and immunoprecipitates were analyzed for presence of MIB2 (IgG: control immunoprecipitation; shown is a representative of three independently performed experiments). e, f HEK293 cells were cotransfected with HA-tagged MIB2 and the indicated Flag-tagged FAT1-ICD mutants (e) or with Flag-tagged FAT1 and the indicated HA-tagged mutants of MIB2 (f). Thereafter FAT1 (e) or MIB2 (f) was immunoprecipitated (IP) using anti-Flag or anti-HA antibodies, respectively, and precipitates were analyzed with the indicated antibodies (IB). Shown are a representative of three independently performed experiments. g, h The purified FAT1ICD-GST fusion protein was incubated with purified MBP-tagged MIB2 or His-tagged YAP protein followed by GST pull-down (g) or purified MBP-MIB2 fusion protein was incubated with purified FAT1ICD-GST and His-tagged YAP protein followed by MBP pull-down (h). Precipitated proteins were analyzed by immunoblotting (IB) using the indicated antibodies. Shown are a representative of three independently performed experiments. i HUVECs were transfected with control siRNA or siRNA directed against FAT1 or MIB2, and YAP/TAZ were immunoprecipitated (IP). Unrelated IgG served as an IP-control. Ubiquitination of YAP/TAZ was analyzed by immunoblotting (IB) using an anti-ubiquitin antibody. Immunoblots of the lysates (input) using the indicated antibodies are shown below (1 representative of 3 independently performed experiments).
Fig. 7
Fig. 7. Role of MIB2 in endothelial cells in vivo and in vitro.
ac HUVECs were transfected with control siRNA or siRNA directed against MIB2 as indicated. 24 h later, YAP/TAZ protein levels were analyzed by immunoblotting (a), YAP/TAZ target genes were analyzed by qRT-PCR (b) and YAP and TAZ protein degradation was determined after incubation of cells with 50 µg/ml cycloheximide (CHX) for the indicated time periods and subsequent immunoblotting using anti-YAP/TAZ antibodies (c) (n = 3 independent experiments in b and c). d Tumor development after subcutaneous injection of B16 melanoma cells into control and EC-Mib2-KO mice (n = 8 mice per group). Bar length: 1 cm. e Vascularization of LLC1 tumors was determined after staining with DAPI and an anti-CD31 antibody. The bar diagram shows the statistical analysis (n = 4 mice per group; 10–15 randomly selected sections were analyzed per mouse). Scale bar: 50 µm. f YAP and TAZ protein levels in endothelial cells isolated from primary LLC1 tumors of control and EC-Mib2-KO mice. Shown is a representative immunoblot of three independent experiments. Shown are mean values ± SEM. (two-tailed unpaired t-test (b, e) or two-way ANOVA and Bonferroni’s post hoc test (c, d)).
Fig. 8
Fig. 8. MIB2 mediates FAT1-dependent YAP/TAZ regulation.
a, b Control and FAT1ICD-expressing HUVECs were transfected with control siRNA or siRNA directed against MIB2, and YAP and TAZ protein levels (a) or cell proliferation (b) were determined by immunoblotting or a colorimetric cell proliferation assay, respectively (n = 3 (a) and n = 4 (b) independently performed experiments). c, d HUVECs were transfected with control siRNA or siRNA directed against FAT1 (c) or MIB2 (d), and cells were lyzed to either detect the indicated proteins by Western blotting (input) or lysates were subjected to immunoprecipitation (IP). Immunoprecipitation was performed using an anti-MIB2 (c) or an anti-FAT1 antibody (d). Subtype-matched IgG served as control. Immunoprecipitates were analyzed by immunoblotting using the indicated antibodies. Shown is a representative of three independently performed experiments. e Schematic representation showing how FAT1 negatively controls endothelial cell proliferation during angiogenesis through MIB2-mediated degradation of YAP/TAZ. TF transcription factor, VEGF vascular endothelial growth factor, VEGFR VEGF-receptor, Ub ubiquitin. Shown are mean values ± SEM. n.s. not significant (two-tailed unpaired t-test (a) or two-way ANOVA and Bonferroni’s post hoc test (b)).

References

    1. Blair S, McNeill H. Big roles for Fat cadherins. Curr. Opin. Cell Biol. 2018;51:73–80. doi: 10.1016/j.ceb.2017.11.006. - DOI - PMC - PubMed
    1. Sadeqzadeh E, de Bock CE, Thorne RF. Sleeping giants: emerging roles for the fat cadherins in health and disease. Med. Res. Rev. 2014;34:190–221. doi: 10.1002/med.21286. - DOI - PubMed
    1. Cao LL, et al. Control of mitochondrial function and cell growth by the atypical cadherin Fat1. Nature. 2016;539:575–578. doi: 10.1038/nature20170. - DOI - PMC - PubMed
    1. Helmbacher F. Tissue-specific activities of the Fat1 cadherin cooperate to control neuromuscular morphogenesis. PLoS Biol. 2018;16:e2004734. doi: 10.1371/journal.pbio.2004734. - DOI - PMC - PubMed
    1. Caruso N, et al. Deregulation of the protocadherin gene FAT1 alters muscle shapes: implications for the pathogenesis of facioscapulohumeral dystrophy. PLoS Genet. 2013;9:e1003550. doi: 10.1371/journal.pgen.1003550. - DOI - PMC - PubMed

Publication types

MeSH terms

LinkOut - more resources