. 2023 Apr 8;13(1):119.
doi: 10.1038/s41398-023-02414-5.

Sex-specific effects of psychedelic drug exposure on central amygdala reactivity and behavioral responding

Affiliations

Sex-specific effects of psychedelic drug exposure on central amygdala reactivity and behavioral responding

D P Effinger et al. Transl Psychiatry. .

Abstract

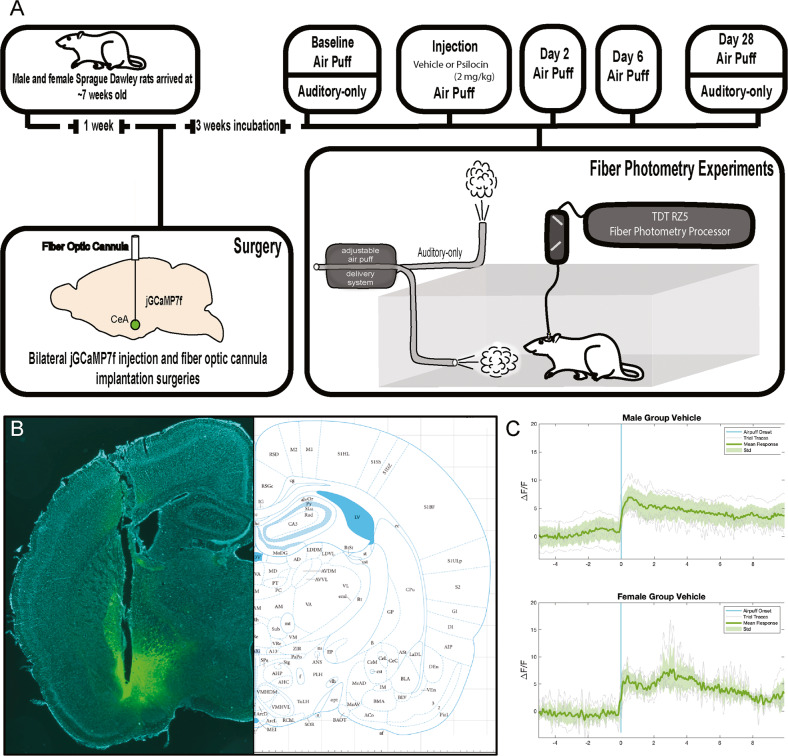
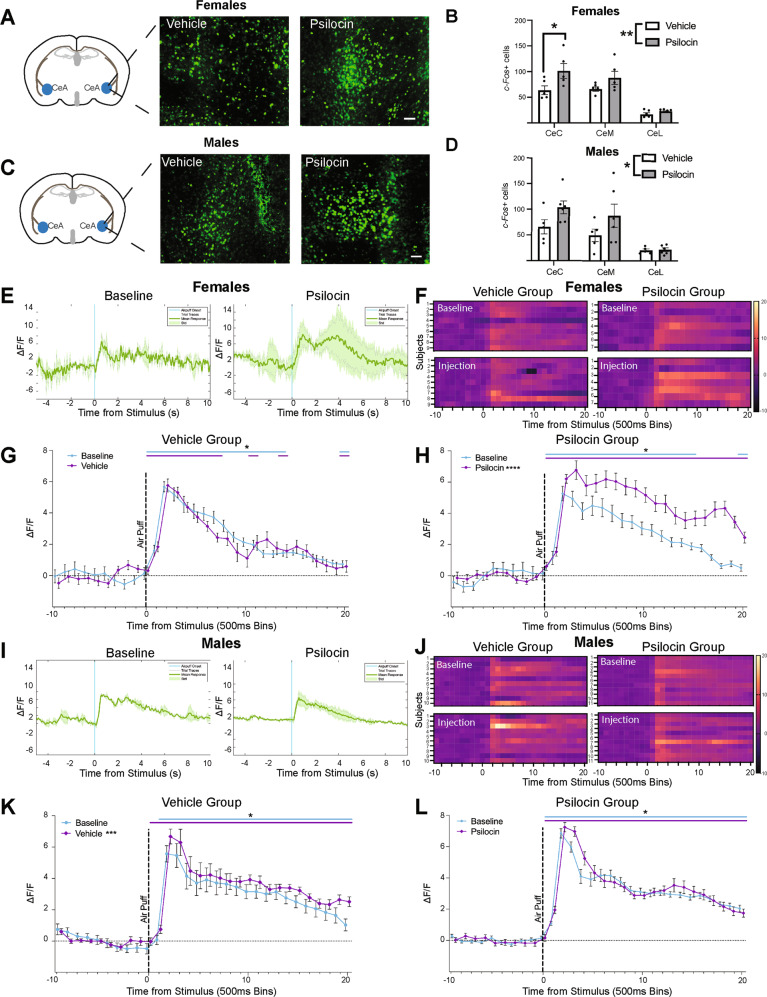
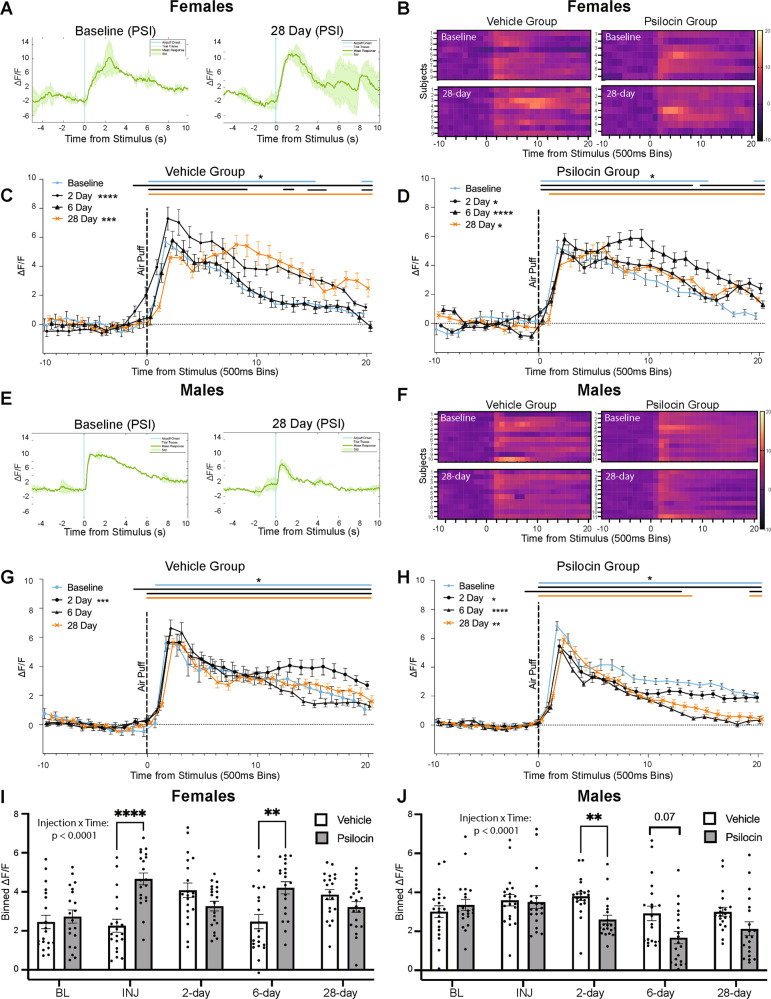
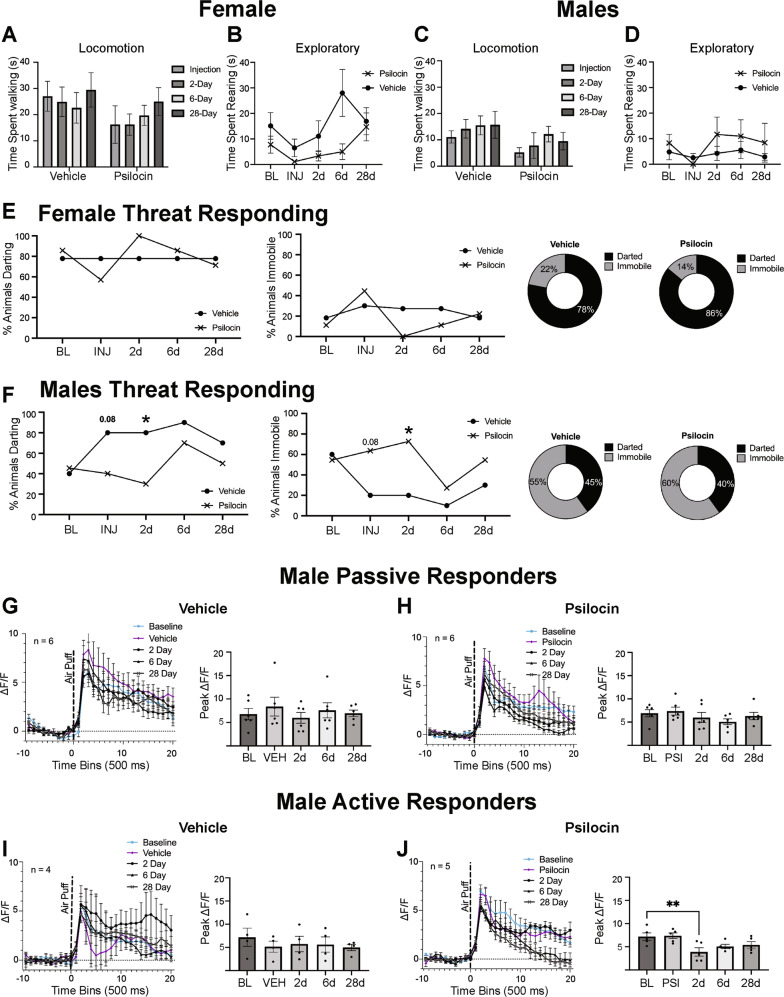
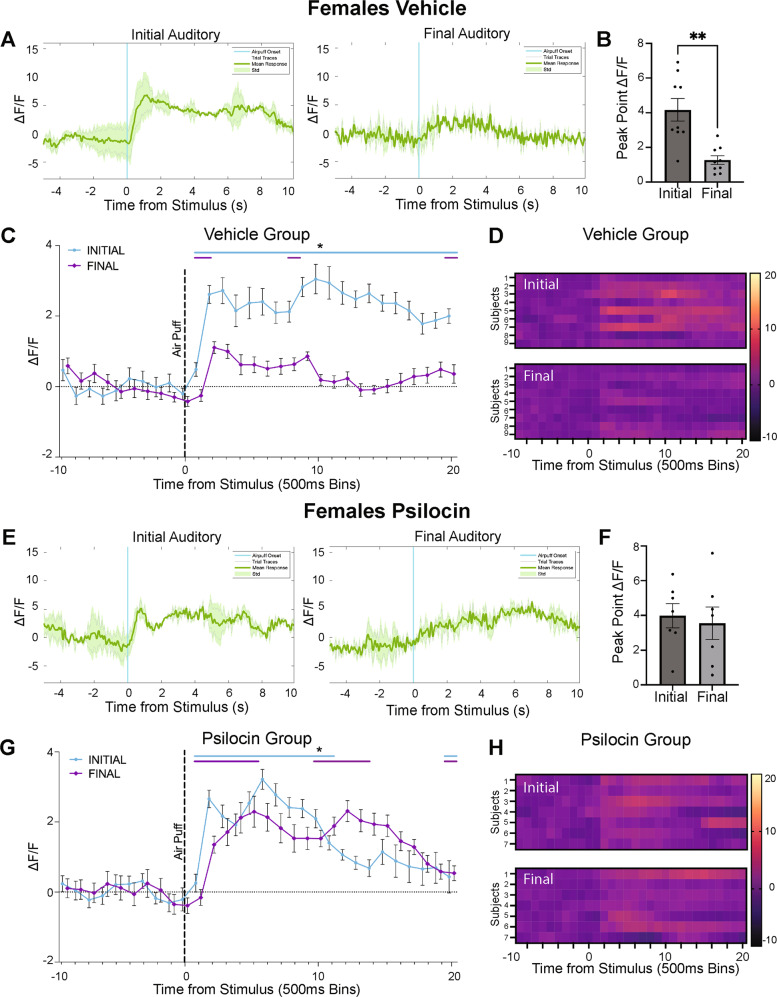
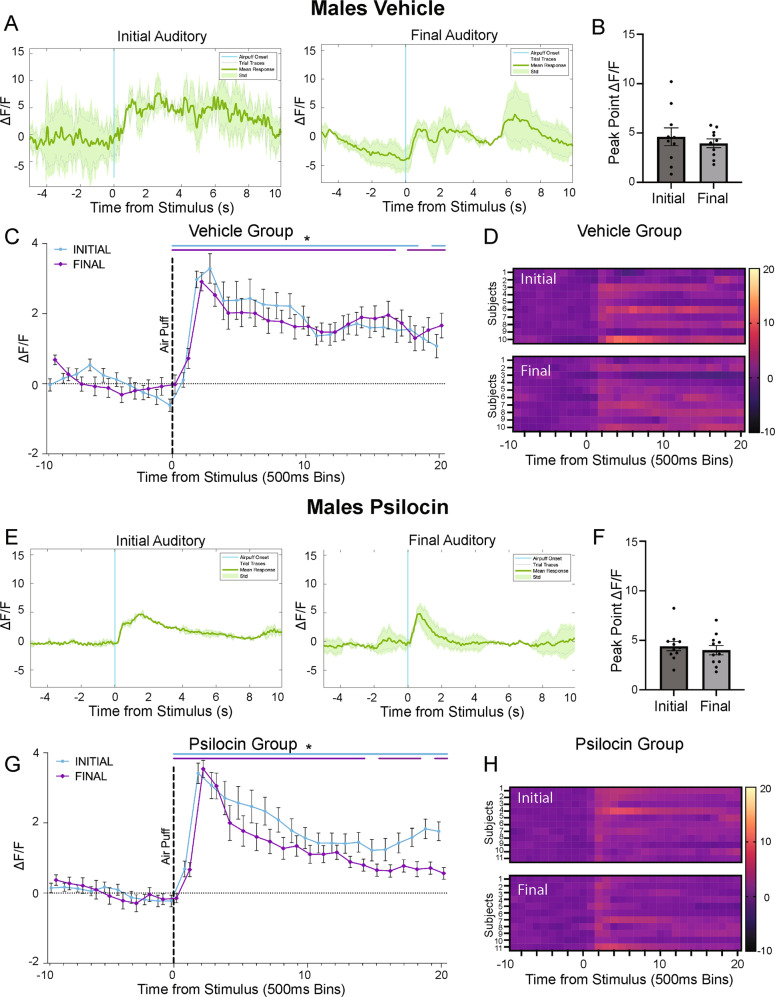
Psilocybin and its active metabolite psilocin have been shown to elicit rapid and long-lasting symptom improvements in a variety of affective psychiatric illnesses. However, the region-specific alterations underlying these therapeutic effects remain relatively unknown. The central amygdala (CeA) is a primary output region within the extended amygdala that is dysregulated in affective psychiatric disorders. Here, we measured CeA activity using the activity marker c-Fos and CeA reactivity using fiber photometry paired with an aversive air-puff stimulus. We found that psilocin administration acutely increased CeA activity in both males and females and increased stimulus specific CeA reactivity in females, but not males. In contrast, psilocin produced time-dependent decreases in reactivity in males, but not in females, as early as 2 days and lasting to 28 days post administration. We also measured behavioral responses to the air-puff stimulus and found sex-dependent changes in threat responding but not exploratory behavior or general locomotion. Repeated presentations of the auditory component of the air-puff were also performed and sex-specific effects of psilocin on CeA reactivity to the auditory-alone stimulus were also observed. This study provides new evidence that a single dose of psilocin produces sex-specific, time-dependent, and enduring changes in CeA reactivity and behavioral responding to specific components of an aversive stimulus.


Conflict of interest statement

The authors declare no competing interests.

Figures

Fig. 1
Fig. 1. Schematic including experimental timeline, representative coronal image, and group mean photometry traces.
A Experimental timeline. Animals arrived at 6–7 weeks old and were allowed to habituate for 1 week prior to surgeries. Bilateral injection of calcium sensor (jGCaMP7f) and implantation of fiber optic cannulas were conducted. After 3 weeks for viral transduction, animals underwent a series of fiber photometry experiments. B Representative coronal section showing fiber placement and GCaMP expression. C Mean air-puff traces showing consistency of CeA signal in response to the air-puff stimulus.
Fig. 2
Fig. 2. Acute changes in CeA reactivity in response to an aversive air-puff stimulus following psilocin administration.
A Females: representative images showing c-Fos+ cells tagged with a green fluorescence protein (GFP) in the CeA. Scale bar = 100 μm. B Female vehicle vs. psilocin: histogram showing the number of c-Fos+ cells in each subregion of the CeA. CeC capsular CeA, CeM Medial CeA, CeL lateral CeA. Data points correspond to the mean of 2–4 hemispheres for each individual subject. C Males: representative images showing c-Fos+ cells tagged with a green fluorescence protein (GFP) in the CeA. Scale bar = 100 μm. D Male vehicle vs. psilocin: histogram showing the number of c-Fos+ cells in each subregion of the CeA. CeC capsular CeA, CeM medial CeA, CeL lateral CeA. Data points correspond to the mean of 2–4 hemispheres for each individual subject. E Female psilocin group: representative raw ΔF/F traces showing an individual at baseline and while on psilocin. Blue line = air-puff onset, Gray lines = individual traces, Green line = mean trace, Std standard deviation. F Females: Heatmaps comparing baseline to injection. Each row represents an individual subjects mean trace. G Female vehicle group: air-puff trace plots of changes in CeA fluorescence following exposure to a 500 ms air-puff at 85 psi. Data points represent group averages within 500 ms binned window +/− S.E.M. H Female psilocin group: air-puff trace plots of changes in CeA fluorescence following exposure to a 500 ms air-puff at 85 psi. Data points represent group averages within 500 ms binned window +/− S.E.M. I Male psilocin group: representative raw ΔF/F traces showing an individual at baseline and while on psilocin. Blue line = air-puff onset, Gray lines = individual traces, Green line = mean trace, Std standard deviation. J Males: Heatmaps comparing baseline to injection. Each row represents an individual subjects mean trace. K Male vehicle group: air-puff trace plots of changes in CeA fluorescence following exposure to a 500 ms air-puff at 85 psi. Data points represent group averages within 500 ms binned window +/− S.E.M. L Male psilocin group: air-puff trace plots of changes in CeA fluorescence following exposure to a 500 ms air-puff at 85 psi. Data points represent group averages within 500 ms binned window +/− S.E.M. In each trace bin plot panel, a significant increase in ΔF/F was determined whenever the lower bound of the 99% CI was >0. These points of statistical significance are shown as colored lines above each ΔF/F curve with colors corresponding to the respective binned traces with a * above the lines. *p < 0.05, **p < 0.01, ***p < 0.001, ****p < 0.0001.
Fig. 3
Fig. 3. Prolonged changes in CeA reactivity in response to an aversive air-puff stimulus following psilocin administration.
A Female psilocin group: representative raw ΔF/F traces showing an individual at baseline and at the 28-day follow-up. Blue line = air-puff onset, Gray lines = individual traces, Green line = mean trace, Std standard deviation B Females: Heatmaps comparing baseline to the 28-day follow-up. Each row represents an individual subjects mean trace. C Female vehicle group: air-puff trace plots of changes in CeA fluorescence following exposure to a 500 ms air-puff at 85 psi. Data points represent group averages within 500 ms binned window +/− S.E.M. D Female psilocin group: air-puff trace plots of changes in CeA fluorescence following exposure to a 500 ms air-puff at 85 psi. Data points represent group averages within 500 ms binned window +/− S.E.M. E Male psilocin group: representative raw ΔF/F traces showing an individual at baseline and while on psilocin. Blue line = air-puff onset, Gray lines = individual traces, Green line = mean trace, Std standard deviation. F Males: Heatmaps comparing baseline to the 28-day follow-up. Each row represents an individual subjects mean trace. G Male vehicle group: air-puff trace plots of changes in CeA fluorescence following exposure to a 500 ms air-puff at 85 psi. Data points represent group averages within 500 ms binned window +/− S.E.M. H Male psilocin group: air-puff trace plots of changes in CeA fluorescence following exposure to a 500 ms air-puff at 85 psi. Data points represent group averages within 500 ms binned window. I Females: Summary histogram comparing the mean of all 20 time bins following air-puff administration. Each data point represents an individual time bin within that condition collapsed across all subjects. +/−S.E.M. J Males: Summary histogram comparing the mean of all 20 time bins following air-puff administration +/− S.E.M. Each data point represents an individual time bin within that condition collapsed across all subjects. +/−S.E.M. In each trace bin plot panel, a significant increase in ΔF/F was determined whenever the lower bound of the 99% CI was >0. These points of statistical significance are shown as colored lines above each ΔF/F curve with colors corresponding to the respective binned traces with a * above the lines. *p < 0.05, **p < 0.01, ***p < 0.001, ****p < 0.0001.
Fig. 4
Fig. 4. Acute and Prolonged Behavioral Effects of Psilocin.
A Females: locomotion plots comparing vehicle and psilocin groups at each time point. Data points are mean time in seconds +/− S.E.M. B Females: time spent rearing comparing vehicle and psilocin groups at each time point. Data points are mean time in seconds +/− S.E.M. C Males: locomotion plots comparing vehicle and psilocin groups at each time point. Data points are mean time in seconds +/− S.E.M. D Males: time spent rearing comparing vehicle and psilocin groups at each time point. Data points are mean time in seconds +/− S.E.M. E Females threat responding behavior. First figure is showing percentage of subjects that darted following air-puff administration. Second figure is showing the percentage of animals that remained immobile following air-puff. Third and fourth figure are pie charts showing the percentage of animals that darted vs. remained immobile F Males threat responding behavior: First figure is showing percentage of subjects that darted following air-puff administration. Second figure is showing the percentage of subject that remained immobile following air-puff. Third and fourth figure are pie charts showing the percentage of animals that darted vs. remained immobile. G Male vehicle passive responders (remained immobile) group: First figure shows air-puff trace plots of changes in CeA fluorescence following exposure to a 500 ms air-puff at 85 psi. Data points represent group averages within 500 ms binned window +/− S.E.M.; second figure is a histogram showing differences in the mean peak ΔF/F value for each group +/− S.E.M following air-puff administration. Data points reflect each individual subject within the corresponding subgroup. H Male psilocin passive responders (remained immobile) group: First figure shows air-puff trace plots of changes in CeA fluorescence following exposure to a 500 ms air-puff at 85 psi. Data points represent group averages within 500 ms binned window +/− S.E.M. Second figure is a histogram showing differences in the mean peak ΔF/F value for each group +/− S.E.M following air-puff administration. Data points reflect each individual subject within the corresponding subgroup. I Male vehicle active responders (darted) group: First figure shows air-puff trace plots of changes in CeA fluorescence following exposure to a 500 ms air-puff at 85 psi. Data points represent group averages within 500 ms binned window +/− S.E.M. Second figure is a histogram showing differences in the mean peak ΔF/F value for each group +/− S.E.M following air-puff administration. Data points reflect each individual subject within the corresponding subgroup. J Male psilocin active responders (darted) group: First figure shows air-puff trace plots of changes in CeA fluorescence following exposure to a 500 ms air-puff at 85 psi. Data points represent group averages within 500 ms binned window +/− S.E.M. Second figure is a histogram showing differences in the mean peak ΔF/F value for each group +/− S.E.M following air-puff administration. Data points reflect each individual subject within the corresponding subgroup. *p < 0.05, **p < 0.01.
Fig. 5
Fig. 5. Changes in CeA reactivity in response to an auditory stimulus following psilocin administration in female subjects.
A Female vehicle group: representative mean ΔF/F traces showing an individual at initial auditory compared to final auditory. Blue line = air-puff onset, Gray lines = individual traces, Green line = mean trace, Std standard deviation. B Female vehicle group: peak point of binned mean ΔF/F traces compared between initial and final auditory recordings. Data points represent each individual subject’s peak ΔF/F value +/− S.E.M. C Female vehicle group: air-puff trace plots of changes in CeA fluorescence following exposure to a 500 ms air-puff at 85 psi. Data points represent group averages within 500 ms binned window +/− S.E.M. D Female vehicle group: Heatmaps comparing initial to final auditory. Each row represents an individual subjects mean trace. E Female psilocin group: representative mean ΔF/F traces showing an individual at initial auditory compared to final auditory. Blue line = air-puff onset, Gray lines = individual traces, Green line = mean trace, Std standard deviation. F Female psilocin group: peak point of binned mean ΔF/F traces compared between initial and final auditory recordings. Data points represent individual subject’s peak ΔF/F value +/− S.E.M. G Female psilocin group: air-puff trace plots of changes in CeA fluorescence following exposure to a 500 ms air-puff at 85 psi. Data points represent group averages within 500 ms binned window +/− S.E.M. H Female psilocin group: Heatmaps comparing initial to final auditory. Each row represents an individual subjects mean trace. In each trace bin plot panel, a significant increase in ΔF/F was determined whenever the lower bound of the 99% CI was >0. These points of statistical significance are shown as colored lines above each ΔF/F curve with colors corresponding to the respective binned traces with a * above the lines. **p < 0.01.
Fig. 6
Fig. 6. Changes in CeA reactivity in response to an auditory stimulus following psilocin administration in male subjects.
A Male vehicle group: representative mean ΔF/F traces showing an individual at initial auditory compared to final auditory. Blue line = air-puff onset, Gray lines = individual traces, Green line = mean trace, Std standard deviation. B Male vehicle group: peak point of binned mean ΔF/F traces compared between initial and final auditory recordings. Data points represent each individual subject’s peak ΔF/F value +/− S.E.M. C Male vehicle group: air-puff trace plots of changes in CeA fluorescence following exposure to a 500 ms air-puff at 85 psi. Data points represent group averages within 500 ms binned window + /− S.E.M. D Male vehicle group: Heatmaps comparing initial to final auditory. Each row represents an individual subjects mean trace. E Male psilocin group: representative mean ΔF/F traces showing an individual at initial auditory compared to final auditory. Blue line = air-puff onset, Gray lines = individual traces, Green line = mean trace, Std standard deviation. F Male psilocin group: peak point of binned mean ΔF/F traces compared between initial and final auditory recordings. Data points represent individual subject’s peak ΔF/F value + /− S.E.M. G Male psilocin group: air-puff trace plots of changes in CeA fluorescence following exposure to a 500 ms air-puff at 85 psi. Data points represent group averages within 500 ms binned window + /- S.E.M. H Male psilocin group: Heatmaps comparing initial to final auditory. Each row represents an individual subjects mean trace. In each trace bin plot panel, a significant increase in ΔF/F was determined whenever the lower bound of the 99% CI was >0. These points of statistical significance are shown as colored lines above each ΔF/F curve with colors corresponding to the respective binned traces with a * above the lines.

References

    1. Nichols DE. Hallucinogens. Pharmacol Ther. 2004;101:131–81. doi: 10.1016/j.pharmthera.2003.11.002. - DOI - PubMed
    1. Dinis-Oliveira RJ. Metabolism of psilocybin and psilocin: clinical and forensic toxicological relevance. Drug Metab Rev. 2017;49:84–91. doi: 10.1080/03602532.2016.1278228. - DOI - PubMed
    1. Passie T, Seifert J, Schneider U, Emrich HM. The pharmacology of psilocybin. Addict Biol. 2002;7:357–64. doi: 10.1080/1355621021000005937. - DOI - PubMed
    1. Davis AK, Barrett FS, May DG, Cosimano MP, Sepeda ND, Johnson MW, et al. Effects of psilocybin-assisted therapy on major depressive disorder: a randomized clinical trial. JAMA Psychiatry. 2021;78:481–9. doi: 10.1001/jamapsychiatry.2020.3285. - DOI - PMC - PubMed
    1. Bogenschutz MP, Johnson MW. Classic hallucinogens in the treatment of addictions. Prog Neuropsychopharmacol Biol Psychiatry. 2016;64:250–8. doi: 10.1016/j.pnpbp.2015.03.002. - DOI - PubMed

Publication types