. 2023 Apr 8;14(1):1979.
doi: 10.1038/s41467-023-37712-5.

MOZ/ENL complex is a recruiting factor of leukemic AF10 fusion proteins

Affiliations

MOZ/ENL complex is a recruiting factor of leukemic AF10 fusion proteins

Yosuke Komata et al. Nat Commun. .

Abstract

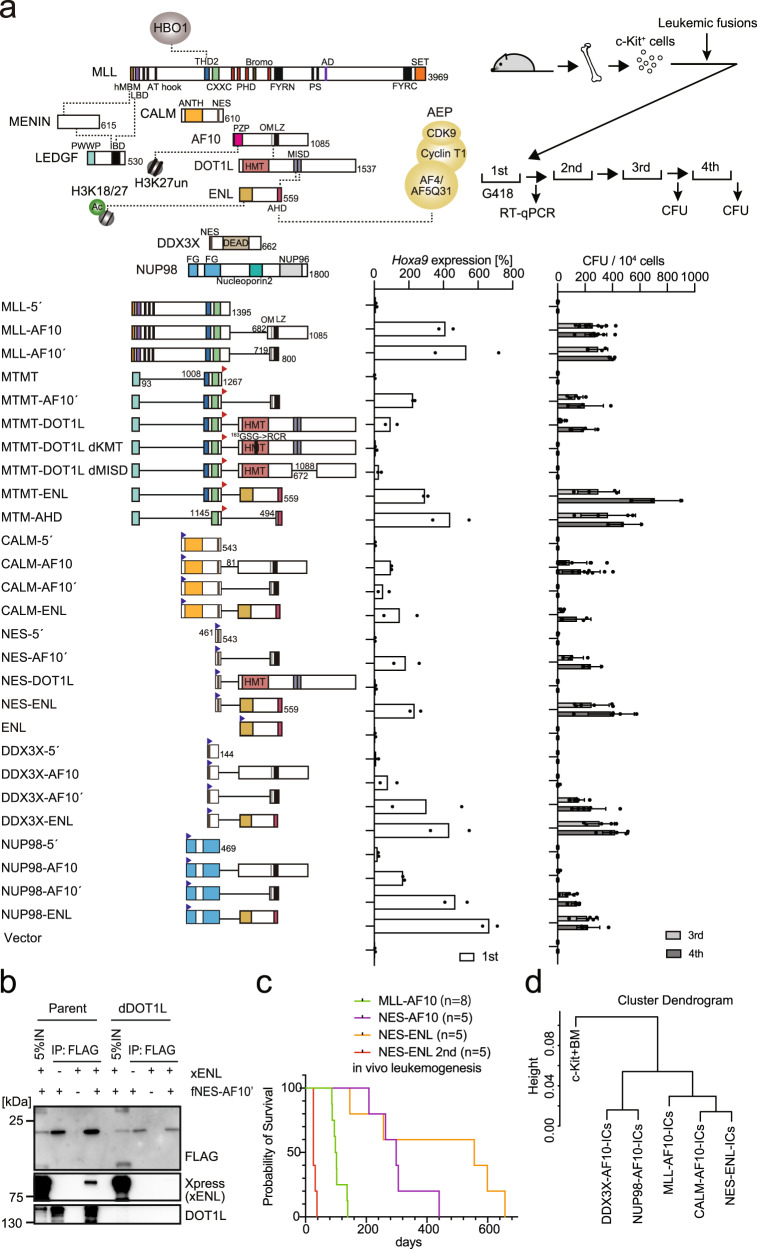
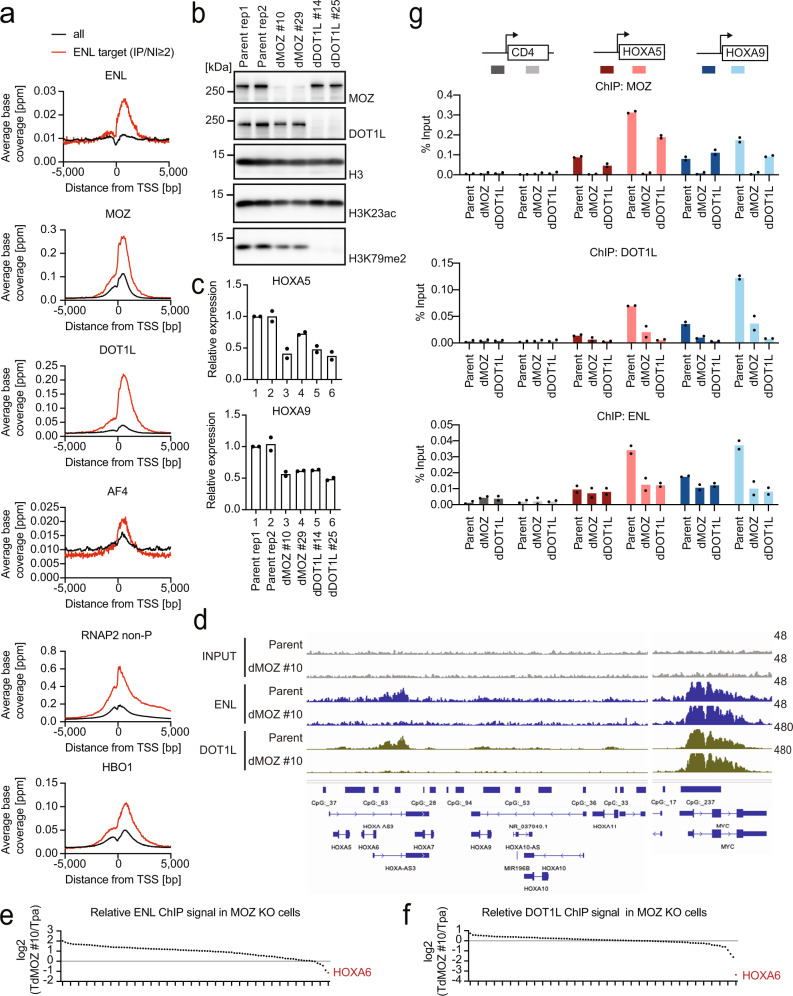
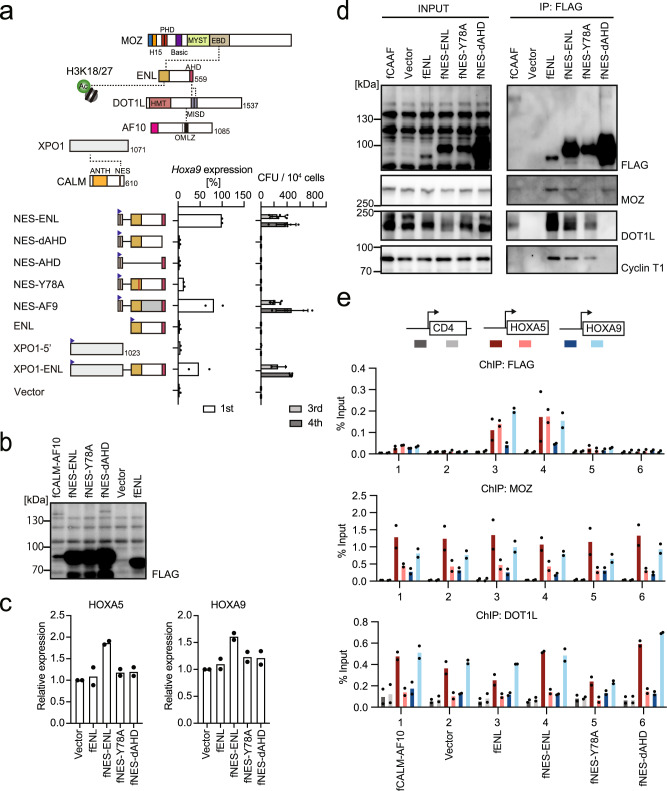
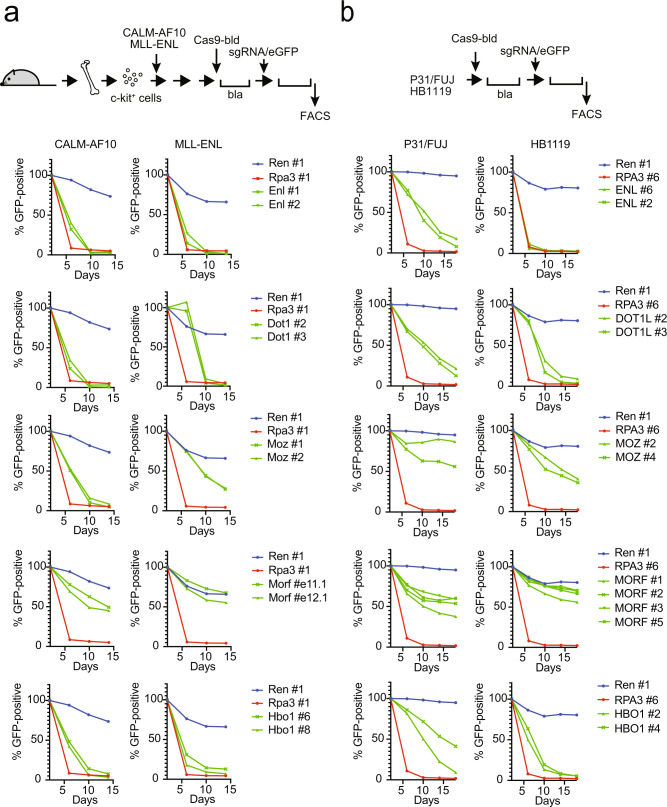
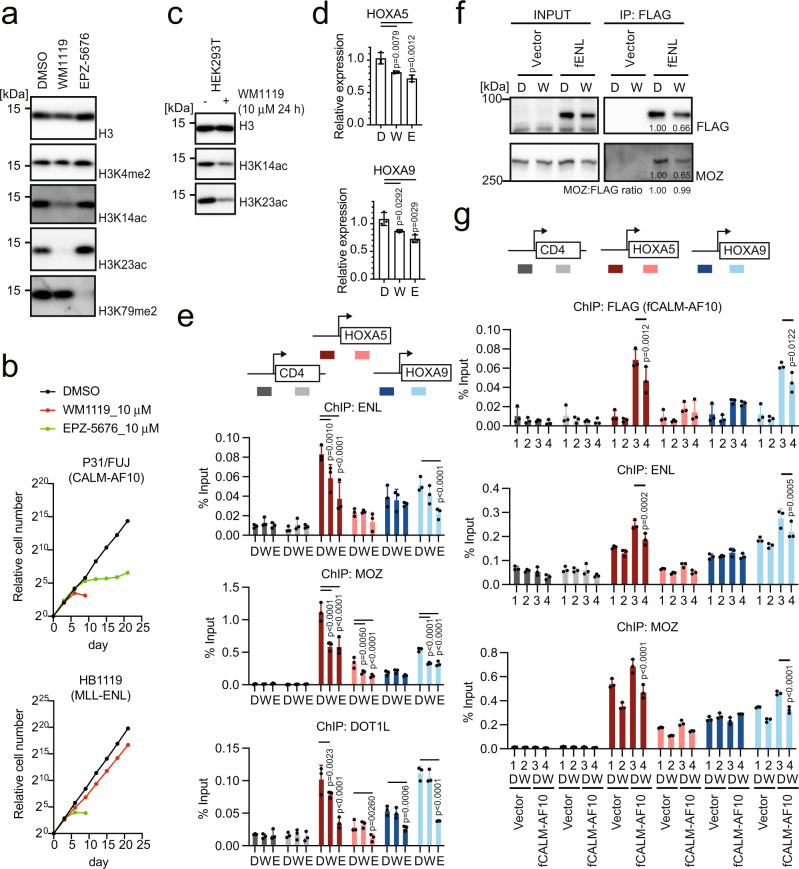
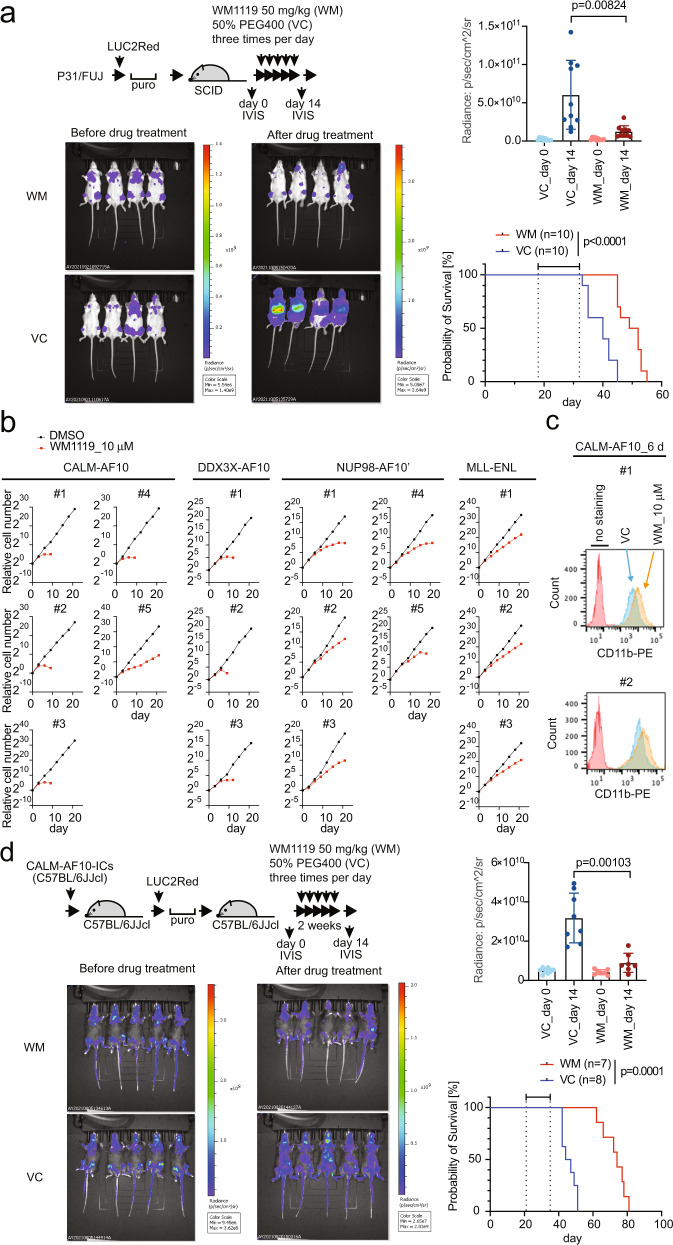
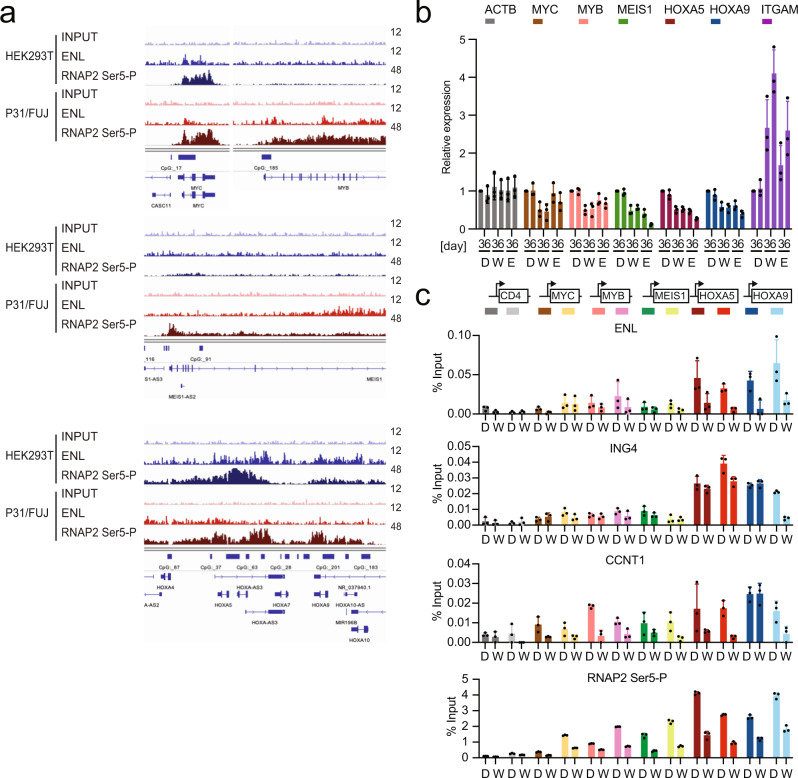
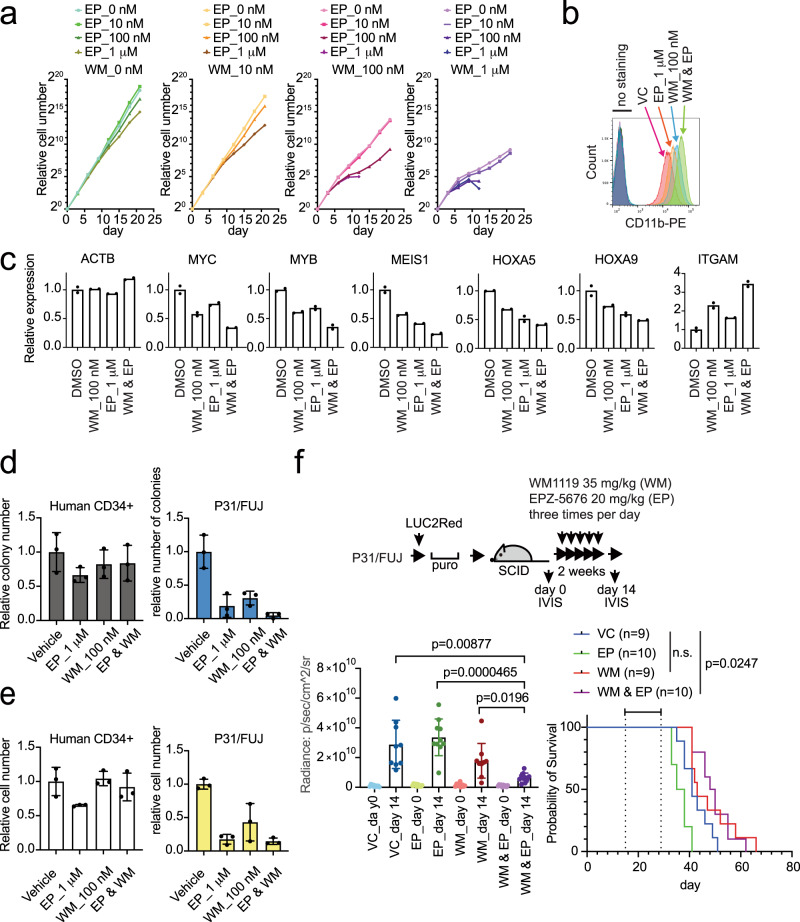
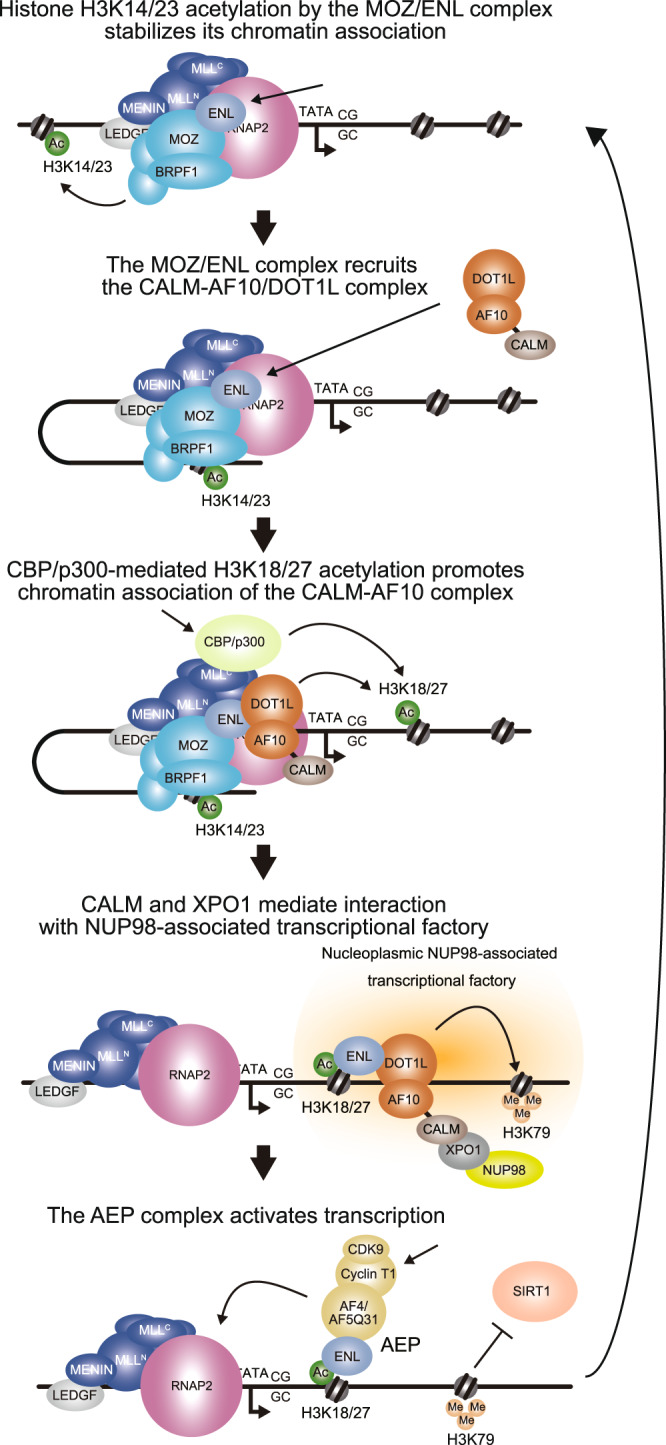
Changes in the transcriptional machinery cause aberrant self-renewal of non-stem hematopoietic progenitors. AF10 fusions, such as CALM-AF10, are generated via chromosomal translocations, causing malignant leukemia. In this study, we demonstrate that AF10 fusion proteins cause aberrant self-renewal via ENL, which binds to MOZ/MORF lysine acetyltransferases (KATs). The interaction of ENL with MOZ, via its YEATS domain, is critical for CALM-AF10-mediated leukemic transformation. The MOZ/ENL complex recruits DOT1L/AF10 fusion complexes and maintains their chromatin retention via KAT activity. Therefore, inhibitors of MOZ/MORF KATs directly suppress the functions of AF10 fusion proteins, thereby exhibiting strong antitumor effects on AF10 translocation-induced leukemia. Combinatorial inhibition of MOZ/MORF and DOT1L cooperatively induces differentiation of CALM-AF10-leukemia cells. These results reveal roles for the MOZ/ENL complex as an essential recruiting factor of the AF10 fusion/DOT1L complex, providing a rationale for using MOZ/MORF KAT inhibitors in AF10 translocation-induced leukemia.


Conflict of interest statement

A.Y. received a research grant from Sumitomo Pharma Co. Ltd. The remaining authors declare no competing interests.

Figures

Fig. 1
Fig. 1. AF10 fusions transform hematopoietic progenitors via ENL.
a Structures required for AF10 fusion-mediated myeloid transformation. Various AF10 fusion constructs were examined to assess their transforming ability of myeloid progenitors. HA-tag (indicated by red triangles) was fused to MTM and MTMT constructs. FLAG-tag (indicated by blue triangles) was fused to other AF10 fusion constructs. Dotted lines indicate protein-protein interaction. A schema of a myeloid progenitor transformation assay is shown at the top. Hoxa9 expression normalized to Gapdh in first-round colonies (left) is shown as the relative value of CALM-AF10 (arbitrarily set at 100%) (mean of two biological replicates). Colony-forming ability at the third- and fourth-round passages (right) is shown with error bars (mean ± SD of biological replicates, n ≥ 3). b Association of NES-AF10 fusion with ENL in the presence or absence of DOT1L. IP-western blotting (WB) analyses of the chromatin fraction of HEK293T cells [the parental clone or a DOT1L-knockout clone (dDOT1L)] transiently expressing the FLAG-tagged (indicated as f) NES-AF10´ fusion (fNES-AF10´) construct and Xpress-tagged (indicated as x) ENL (xENL) were performed. Co-purification of ENL was observed only in the presence of DOT1L. c Leukemogenesis by NES-ENL fusion in vivo. Various AF10 fusion-derivatives including NES-ENL were transduced to c-Kit-positive hematopoietic progenitors and transplanted into syngeneic mice. Primary NES-ENL leukemia cells were harvested from the bone marrow (BM) and transplanted into recipient mice. d Hierarchical clustering analysis of RNA-seq profiles of AF10 fusion-ICs. Normalized count data in various AF10 fusion-ICs was clustered using R ward D2 method. Source data are provided as a Source Data file.
Fig. 2
Fig. 2. MOZ recruits ENL and DOT1L to HOXA gene promoters.
a Genomic localization of various transcriptional regulators in HEK293T cells. ChIP-seq analysis of the chromatin of HEK293T cells for the indicated proteins. The average ChIP signal distribution of the indicated proteins around the transcriptional stat sites (TSSs) is shown for the ENL-target genes (red) or all genes (black). ChIP-seq tags of ENL and its input chromatin at all genes were clustered into a 2-kb bin (0 to +2 kb from the TSS) and the genes with the ENL ChIP/input ratio ≥2 were defined as ENL target genes. b Protein expression of MOZ and DOT1L and histone modification levels. WB of the of HEK293T cells was performed in two technical replicates of the parental clone and two biological replicates of MOZ- or DOT1L-knockout clones each. c HOXA gene expression in MOZ and DOT1L-deficient cells. RT-qPCR was performed on the HEK293T clones shown in b (mean of two technical replicates). d Localization of ENL and DOT1L in MOZ-deficient cells. ChIP-seq analysis was performed on MOZ knockout HEK293T cell line and its parental clone. ChIP-signals were visualized using the Integrative genome browser (IGV, Broad Institute). e Relative ChIP signals of ENL between a MOZ-deficient cell line and its parental clone. ENL ChIP signals of the dMOZ#10 clone in the bins of 0–1 kb of the top 100 ENL-bound genes of its parental clone were subdivided by those of the parental clone. HOXA6 is highlighted in red. f Relative abundance of DOT1L ChIP signals of the top 100 DOT1L-bound genes in a MOZ-deficient clone is shown as in e. g Localization of MOZ, DOT1L, and ENL. ChIP-qPCR was performed on two technical/biological replicates of each genotype for the indicated gene loci using qPCR probes designed for the pre-TSS ( − 1 to −0.5 kb of TSS) and post-TSS regions (+1 to +1.5 kb of TSS) of each gene. ChIP signals are expressed as a percentage of the input with error bars (mean of two technical/biological replicates). Source data are provided as a Source Data file.
Fig. 3
Fig. 3. Structural requirements of NES-ENL in overactivation of HOX genes.
a Structures required for NES-ENL-mediated transformation. Various ENL constructs were examined for the transformation of myeloid progenitors as in Fig. 1a. b Protein expression of various ENL constructs in stably transduced HEK293T cells. FLAG-tagged (denoted as f) gene constructs were lentivirally transduced to HEK293T cells and selected for puromycin resistance. WB of the whole-cell extracts was performed using anti-FLAG antibodies. c HOX gene expression in HEK293T cells stably expressing ENL mutants. RT-qPCR was performed on the cells presented in c (mean of two technical replicates). Multiple comparisons were performed using a one-way ANOVA. d Protein interaction of NES-ENL in the chromatin fraction. IP-WB of the chromatin fraction of HEK293T cells stably expressing various FLAG-tagged ENL constructs was performed using specific antibodies for the indicated proteins. e Localization of the various ENL constructs and CALM-AF10. ChIP-qPCR for the FLAG-tagged proteins, MOZ, and DOT1L were performed as in Fig. 2d. (mean of two technical replicates). Source data are provided as a Source Data file.
Fig. 4
Fig. 4. ENL co-factors and MYST family KATs determine survival in leukemia cells.
a Requirement of DOT1L, ENL, MOZ, MORF, and HBO1 for myeloid progenitors immortalized by CALM-AF10 or MLL-ENL. sgRNA competition assays of immortalized myeloid progenitors were performed. The ratio of GFP-positive cells co-expressing sgRNA was measured using flow cytometry. sgRNA for Renilla luciferase (Ren), which does not affect proliferation, was used as a negative control. sgRNA for Rpa3, which impairs proliferation, was used as a positive control. b Requirement of DOT1L, ENL, MOZ/MORF, and HBO1 for human leukemia cell lines carrying CALM-AF10 (P31/FUJ) or MLL-ENL (HB1119). sgRNA competition assays were performed in P31/FUJ and HB1119 cells as in a. Source data are provided as a Source Data file.
Fig. 5
Fig. 5. MOZ/MORF-mediated acetylation is required for the localization of the MOZ/ENL complex and CALM-AF10 at the target chromatin.
a Histone modifications in CALM-AF10 leukemia cells after treatment with MOZ/MORF KAT (WM1119) and DOT1L KMT (EPZ-5676) inhibitors. WB of the P31/FUJ cells treated with 10 µM of WM1119 or EPZ-5676 for 6 days using antibodies specific to each histone modification. b Leukemia cell proliferation in the presence of WM1119 and EPZ-5676. P31/FUJ cell proliferation in the presence of 10 µM WM1119 or EPZ-5676 was monitored for 21 days along with the vehicle control (DMSO). c Histone modifications in HEK293T cells after treatment with WM1119. WB of the HEK293T cells treated with 10 µM of WM1119 for 24 h using antibodies specific to each histone modification. d HOXA gene expression in HEK293T cells after treatment with WM1119 and EPZ-5676. RT-qPCR of the HEK293T cells treated with 10 μM of WM1119 (W), EPZ-5676 (E), or DMSO control (D) for 5 days (mean ± SD of technical replicates, n = 3). Multiple comparisons were performed using a one-way ANOVA. e Localization of ENL, MOZ, and DOT1L after treatment with WM1119 and EPZ-5676. ChIP-qPCR of HEK293T cells treated with 10 µM of WM1119 or EPZ-5676 for 5 days was performed as in Fig. 2d (mean ± SD of technical replicates, n = 3). Multiple comparisons were made using a two-way ANOVA. f Effects of WM1119 on protein interactions in ENL. IP-WB of the chromatin fraction of HEK293T cells stably expressing various FLAG-tagged ENL constructs with (W: WM1119) or without (D: DMSO control) the treatment with WM1119 at 10 µM for 5 days was performed. The co-precipitates were analyzed using anti-FLAG and MOZ antibodies. The relative band intensity was quantified using the Image J software. g Localization of CALM-AF10 after treatment with WM1119. HEK293T cells stably expressing FLAG-tagged CALM-AF10 (fCALM-AF10) were treated with 10 µM WM1119 (W) or the DMSO control (D) for 5 days and subjected to ChIP-qPCR analysis as in Fig. 2d (mean ± SD of technical replicates, n = 3). Multiple comparisons were performed using a two-way ANOVA. Source data are provided as a Source Data file.
Fig. 6
Fig. 6. Pharmacological inhibition using the MOZ/MORF KAT inhibitor suppresses CALM-AF10-mediated leukemia in vivo.
a Leukemia burden before and after MOZ/MORF KAT inhibitor treatment. P31/FUJ human leukemia cells expressing LUC2Red were transplanted into sublethally irradiated SCID mice and intraperitoneally injected with WM1119 50 mg/kg (WM) or the 50% PEG400 vehicle control (VC) three times a day for 2 weeks, as shown in the top schema. Representative images of luciferase-mediated bioluminescence reflecting leukemia cell abundance are shown with scale bars. Quantification of leukemia burden by region-of-interest analysis of the IVIS images (mean ± SD of biological replicates, n = 10). Welch’s t-test (two-sided) was performed on the indicated two-group comparison. Survival of transplanted recipient mice with or without MOZ/MORF KAT inhibitor treatment (the duration of drug administration is indicated in the graph). A log-rank (Mantel–Cox) test was performed. b Proliferation of various AF10 fusion-ICs in the presence of MOZ/MORF KAT inhibitor (10 µM WM1119) was monitored for 21 days along with the vehicle control (DMSO). c Differentiation induced by MOZ/MORF KAT inhibitors. Flow cytometry analysis for the CD11b antigen was performed on the CALM-AF10-ICs treated with 10μM of WM1119 for 6 days. d Leukemia burden before and after MOZ/MORF KAT inhibitor treatment. Murine CALM-AF10 leukemia cells expressing LUC2Red were transplanted into sub-lethally irradiated syngeneic C57BL/6JJcl mice, treated with WM1119 as in a. Representative images of luciferase-mediated bioluminescence are shown as in a. Quantification of leukemia burden by region-of-interest analysis of the IVIS images (mean ± SD of biological replicates, n ≥ 7). Welch’s t-test (two-sided) was performed on the indicated two-group comparison. Survival of transplant recipient mice with or without MOZ/MORF KAT inhibitor treatment (the duration of drug administration is indicated in the graph). A log-rank (Mantel–Cox) test was performed. Source data are provided as a Source Data file.
Fig. 7
Fig. 7. Inhibition of MOZ/MORF KATs reduces ENL-mediated oncogene activation in CALM-AF10 leukemia cells.
a Genomic localization of ENL. ChIP-seq for ENL was performed on P31/FUJ and HEK293T cells. Data for RNA Polymerase II with its CTD phosphorylated at Ser 5 of the heptapeptide repeats (RNAP2-Ser5-P) are shown as a comparison. b Gene expression after MOZ/MORF KAT or DOT1L KMT inhibition. RT-qPCR was performed on the P31/FUJ cells treated with 10 μM WM1119 (W), 10 µM EPZ-5676 (E), or DMSO control (D) for 3 or 6 days (mean ± SD of technical replicates, n = 3). c Effects of MOZ/MORF KAT inhibitor on the localization of ENL, ING4, Cyclin T1, and RNAP2-Ser5-P at target chromatin. ChIP-qPCR was performed on P31/FUJ cells treated with WM1119 (W) (1 μM for 24 h) or DMSO control (D) (mean ± SD of technical replicates, n = 3) using specific antibodies for the indicated proteins. The positions of the qPCR probe are set at 0.5 kb upstream and 1.5 kb downstream of TSS as indicated on the top. Source data are provided as a Source Data file.
Fig. 8
Fig. 8. Dual inhibition of MOZ/MORF KATs and DOT1L KMT cooperatively induces differentiation of CALM-AF10 leukemia cells.
a Effects on the proliferation of P31/FUJ cells by dual inhibition of MOZ/MORF KATs and DOT1L KMT. Proliferation of P31/FUJ cells in the presence of WM1119 and EPZ-5676 at the indicated concentrations was monitored for 21 days. b Differentiation of P31/FUJ cells after combinatorial inhibition of MOZ/MORF KAT and DOT1L KMT. Flow cytometry analysis for the CD11b antigen was performed on the P31/FUJ cells treated with various combinations of WM1119 and EPZ-5676 for 6 days. c Effects of combinatorial inhibition of MOZ/MORF KAT and DOT1L KMT on gene expression. RT-qPCR was performed on the P31/FUJ cells treated with only 100 nM WM1119 (WM), only 1 µM EPZ-5676 (EP), or a combination of both (WM & EP) (mean of two technical replicates). d Effects on the colony formation of human CD34 + cells and P31/FUJ cells by dual inhibition of MOZ/MORF KATs and DOT1L KMT (mean ± SD of technical replicates, n = 3). e Effects on the cell numbers of Human CD34 + cells and P31/FUJ cells by dual inhibition of MOZ/MORF KATs and DOT1L KMT (mean ± SD of three technical replicates). f Leukemia burden before and after the combination therapy using MOZ/MORF KATs and DOT1L KMT inhibitors. P31/FUJ human leukemia cells expressing LUC2Red were transplanted into sublethally irradiated SCID mice and subsequently administered with 35 mg/kg of WM119 and 20 mg/kg of EPZ-5676 three times a day (i.p.) for 2 weeks (mean ± SD of biological replicates, n ≥ 9). Welch’s t-test (two-sided) was performed on the indicated two-group comparison. Survival of transplanted recipient mice with or without MOZ/MORF KAT inhibitor treatment (the duration of drug administration is indicated in the graph). A log-rank (Mantel–Cox) test was performed. n.s.: P > 0.05. Source data are provided as a Source Data file.
Fig. 9
Fig. 9. MOZ-dependent recruitment of AF10 fusion complex leads to gene activation.
A model of CALM-AF10-mediated gene activation is dipcted in a cartoon.

Similar articles

Cited by

References

    1. Cozzio A, et al. Similar MLL-associated leukemias arising from self-renewing stem cells and short-lived myeloid progenitors. Genes Dev. 2003;17:3029–3035. doi: 10.1101/gad.1143403. - DOI - PMC - PubMed
    1. Huntly BJ, et al. MOZ-TIF2, but not BCR-ABL, confers properties of leukemic stem cells to committed murine hematopoietic progenitors. Cancer Cell. 2004;6:587–596. doi: 10.1016/j.ccr.2004.10.015. - DOI - PubMed
    1. Meyer C, et al. The MLL recombinome of acute leukemias in 2017. Leukemia. 2018;32:273–284. doi: 10.1038/leu.2017.213. - DOI - PMC - PubMed
    1. Mohan M, et al. Linking H3K79 trimethylation to Wnt signaling through a novel Dot1-containing complex (DotCom) Genes Dev. 2010;24:574–589. doi: 10.1101/gad.1898410. - DOI - PMC - PubMed
    1. Okada Y, et al. hDOT1L links histone methylation to leukemogenesis. Cell. 2005;121:167–178. doi: 10.1016/j.cell.2005.02.020. - DOI - PubMed

Publication types