. 2023 Apr 8;14(1):1970.
doi: 10.1038/s41467-023-37774-5.

RNAi-mediated rheostat for dynamic control of AAV-delivered transgenes

Affiliations

RNAi-mediated rheostat for dynamic control of AAV-delivered transgenes

Megha Subramanian et al. Nat Commun. .

Abstract

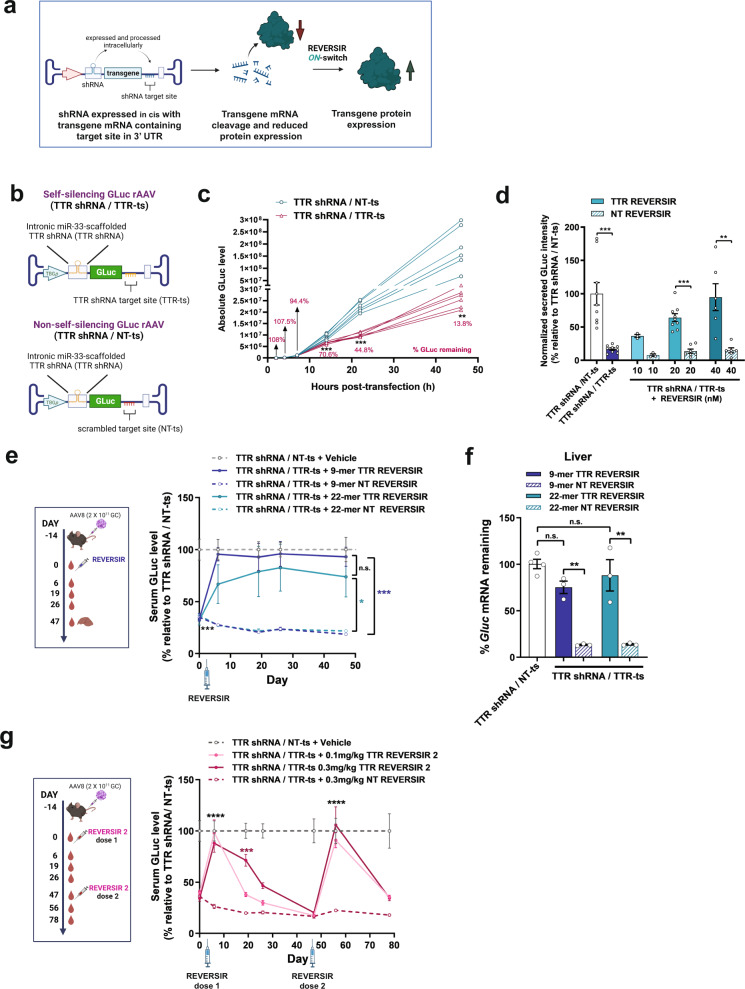
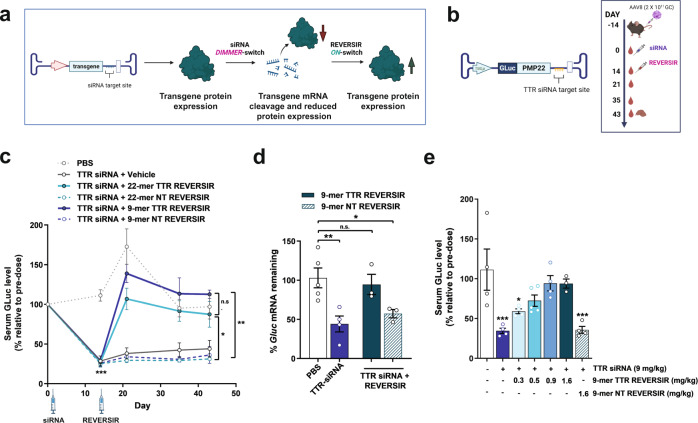
Adeno-associated virus (AAV)-based gene therapy could be facilitated by the development of molecular switches to control the magnitude and timing of expression of therapeutic transgenes. RNA interference (RNAi)-based approaches hold unique potential as a clinically proven modality to pharmacologically regulate AAV gene dosage in a sequence-specific manner. We present a generalizable RNAi-based rheostat wherein hepatocyte-directed AAV transgene expression is silenced using the clinically validated modality of chemically modified small interfering RNA (siRNA) conjugates or vectorized co-expression of short hairpin RNA (shRNA). For transgene induction, we employ REVERSIR technology, a synthetic high-affinity oligonucleotide complementary to the siRNA or shRNA guide strand to reverse RNAi activity and rapidly recover transgene expression. For potential clinical development, we report potent and specific siRNA sequences that may allow selective regulation of transgenes while minimizing unintended off-target effects. Our results establish a conceptual framework for RNAi-based regulatory switches with potential for infrequent dosing in clinical settings to dynamically modulate expression of virally-delivered gene therapies.


Conflict of interest statement

All authors were employees of Alnylam Pharmaceuticals with salary and/or stock options at the time the work was conducted. REVERSIR is a trademark of Alnylam Pharmaceuticals.

Figures

Fig. 1
Fig. 1. Transgene induction from shRNA-regulated self-silencing AAV vector using REVERSIR.
a Diagram illustrating AAV transgene self-silencing using intronically-encoded shRNA and induction of expression with exogenously-administered REVERSIR. b Viral genome schematics of AAV8 GLuc reporter vector with intronic TTR shRNA and complementary (TTR shRNA/TTR-ts) or scrambled 3’ UTR target site (TTR shRNA/NT-ts) c HepG2 cells were transfected with AAV plasmids and media was collected at each timepoint. Media was fully exchanged at every collection, with each line corresponding to accumulated GLuc in supernatant from a single well since prior timepoint (n = 6 wells per condition; two-way repeated measures ANOVA with Sidak’s correction). d Recovery of reporter expression with REVERSIR in HepG2 cells. AAV constructs in (b) were co-transfected with indicated concentrations of 22-mer TTR REVERSIR or NT REVERSIR, along with a Luc2 internal control plasmid. 48 h post-transfection, GLuc and Luc2 intensities were assayed in cell supernatant and lysate, respectively. GLuc/Luc2 ratios were computed and plotted relative to TTR shRNA/NT-ts condition set to 100%. Data analyzed by one way ANOVA with Sidak’s correction. (e–g) Mice were injected with 2 × 1011 genome copies (GC) of AAV vectors in (b) 2 weeks before molar equivalent dosing of 9-mer (0.1 mg/kg) or 22-mer (0.2 mg/kg) TTR or NT REVERSIR on Day 0 (D0). e Serum GLuc levels at indicated timepoints prior to and following REVERSIR treatment (n = 5 animals in PBS group; n = 3 animals for all other groups). Statistical analysis was performed using two-way repeated measures ANOVA followed by Tukey’s test. f qRT-PCR for Gluc transcript levels in liver tissue at terminal timepoint normalized to endogenous Gapdh control. Data were analyzed by one-way ANOVA with Tukey’s post hoc test. g Serum GLuc levels in mice administered with 0.1 mg/kg or 0.3 mg/kg 9-mer TTR REVERSIR 2 or NT REVERSIR on D0, followed by a second dose on D47 (n = 3). Data from the same TTR shRNA/NT-ts + vehicle group is shown in (e) and (g). All error bars represent s.e.m. *p < 0.05 **p < 0.01 ***p < 0.001 ****p < 0.0001. n.s., not significant as determined by indicated post-hoc test. Graphics were created using BioRender.com. Source data and statistics are provided in the Source Data file.
Fig. 2
Fig. 2. REVERSIR-mediated regulation of an erythropoietin transgene.
a Vector genome schematics for AAV encoding mouse EPO (mEPO) transgene under control of TTR shRNA with intact (self-silencing; TTR shRNA/TTR-ts) or scrambled (non-self-silencing; TTR shRNA/NT-ts) binding site in 3’ UTR. b Mice were transduced with 2 × 1011 GC of AAV8 vectors shown in (a) for two weeks and then subcutaneously injected with REVERSIR. Serum was collected for quantification of mEPO levels by ELISA at indicated days prior to and following REVERSIR administration. c Serum EPO concentrations in mice that received 0.1 mg/kg 9-mer TTR or NT REVERSIR, compared to vehicle control on D0 (n = 4 mice for vehicle groups and n = 3 mice for REVERSIR groups). Data were analyzed by two-way repeated measures ANOVA with Tukey’s post hoc test (***p < 0.001 relative to TTR shRNA/TTR-ts + NT REVERSIR control). d EPO concentrations following treatment with increasing doses of TTR REVERSIR 2 (0.01, 0.03, 0.1, or 0.3 mg/kg). Experiments in panels (c) and (d) were conducted in parallel and compared to the same vehicle conditions. An additional control was included in (d) in which mice transduced with the non-self-silencing vector were treated with TTR REVERSIR (n = 4 mice for vehicle and 0.03 mg/kg REVERSIR groups; n = 3 mice for 0.01 and 0.1 mg/kg REVERSIR groups; n = 2 mice for 0.1 and 0.3 mg/kg REVERSIR groups). Statistical testing was performed by using two-way repeated measures ANOVA followed by Tukey’s test for multiple comparisons (*p < 0.05 relative to TTR shRNA/TTR-ts + vehicle control). #, adjusted p = 0.049 at D3 compared to TTR shRNA/TTR-ts + vehicle condition by multiple unpaired t-test (one per row) corrected for multiple comparisons by Holm-Sidak method (alpha=0.05). All error bars represent s.e.m. AAV vector and experimental design illustrations were created with BioRender.com. Source data with detailed statistical analyses are provided as a Source Data file.
Fig. 3
Fig. 3. In vivo regulation of an AAV-expressed reporter transgene by exogenous delivery of siRNA and REVERSIR.
a Diagram depicting dual agent approach involving suppression of AAV transgene expression with siRNA and subsequent upregulation of protein expression by abrogation of siRNA activity with REVERSIR. b Mice were injected with 2 × 1011 GC of AAV encoding bicistronic expression of a GLuc reporter with a TTR siRNA binding site in the 3’ UTR. Mice were subcutaneously injected with vehicle or TTR siRNA at 9 mg/kg (D0). This was followed on D14 with a single molar equivalent dose of full-length 22-mer (3 mg/kg) or 9-mer TTR REVERSIR (1.6 mg/kg) and compared to NT REVERSIR control. c Serum GLuc levels normalized to pre-dose (D0) for each animal (n = 5 for PBS; n = 4 for vehicle and 22-mer TTR REVERSIR groups; n = 3 for 22-mer NT REVERSIR and both 9-mer REVERSIR groups). Data were analyzed by two-way repeated measures ANOVA followed by Tukey’s post hoc test. d Gluc transcript levels in liver tissue at D42 normalized to Gapdh control. e Serum GLuc levels at D21 in AAV-transduced mice that received TTR siRNA (9 mg/kg; D0), followed by increasing doses of 9-mer TTR REVERSIR (D14) or NT REVERSIR (n = 4 for PBS, TTR siRNA, 0.3 mg/kg REVERSIR, and NT REVERSIR groups; n = 5 for 0.5 mg/kg REVERSIR group; n = 3 for 1.6 mg/kg TTR REVERSIR group). Data were analyzed by one-way ANOVA followed by Holm-Sidak or Dunnett’s tests, respectively for (d) and (e). *p < 0.05 **p < 0.01 ***p < 0.001 n.s., not significant. Error bars represent s.e.m. Source data are provided as a Source Data file. Diagrams were created with BioRender.com.
Fig. 4
Fig. 4. In vitro characterization of on- and off-target activity of transgene regulator siRNA sequences.
a On-target silencing efficacy (solid blue line) of three lead transgene regulator siRNA (TR-siRNA) sequences as assayed by co-transfection of serially titrated doses of siRNA with dual luciferase sensors containing a perfectly matched binding site in the 3’ UTR of Renilla luciferase (RLuc). Seed-mediated off-target repression was similarly assessed by dose-response activity of siRNA in the presence of luciferase reporters bearing either 1 (green dashed line) or 4 tandem (gray dashed line) seed-matched target sites. RLuc/FLuc ratios were normalized to the mock-transfected control (no siRNA) condition set at 100% and plotted as mean±s.e.m. Data were analyzed using ordinary one-way ANOVA with Bonferroni’s test for multiple comparisons (*p < 0.05 **p < 0.01 ***p < 0.001). b MA plots depicting differential gene expression analysis of RNA-seq data obtained from transfection of TR-siRNAs and a Tmprss6-targeting siRNA control in Hep3B cells (top; 10 nM dose harvested at 24 h) and primary mouse hepatocytes (bottom; 50 nM dose harvested at 48 h) (n = 4 biological replicates per condition). Dots represent individual mRNAs, average normalized read counts across replicates, and log2 fold change relative to no siRNA controls. ‘Red’-colored dots represent genes with significant differential expression (false discovery rate <0.05) but no canonical seed-matched sites within their 3’ UTRs (8-mer, 7mer-m8, and 7mer-A1). ‘Blue’-colored dots indicate genes with significant differential expression and canonical seed-matched sites within their 3’ UTRs. ‘Dark gray’ dots denote genes that contain canonical 3’ UTR seed-matched binding sites but are not significantly differentially expressed. The circled dot represents on-target knockdown. c Rat toxicity evaluation of TR-siRNAs by measurement of serum alanine aminotransferase (ALT) and alkaline phosphatase (ALP) at necropsy (24 h after last dose of siRNA). n = 4 males (6–8 weeks old) per group; qw weekly dosing. Statistical analysis was performed by ordinary one-way ANOVA [ALT: F(6, 21) = 0.79, p = 0.59; ALP: F(6, 21) = 1.46, p = 0.24] followed by Dunnett’s multiple comparisons test (p > 0.1 for all doses compared to saline control). All error bars represent s.e.m. Source data are provided as a Source Data file.

References

    1. Wang D, Tai PWL, Gao G. Adeno-associated virus vector as a platform for gene therapy delivery. Nat. Rev. Drug Disco. 2019;18:358–378. doi: 10.1038/s41573-019-0012-9. - DOI - PMC - PubMed
    1. Rangarajan S, et al. AAV5-Factor VIII Gene Transfer in Severe Hemophilia A. N. Engl. J. Med. 2017;377:2519–2530. doi: 10.1056/NEJMoa1708483. - DOI - PubMed
    1. Tang F, Wong H, Ng CM. Rational Clinical Dose Selection of Adeno-Associated Virus-Mediated Gene Therapy Based on Allometric Principles. Clin. Pharm. Ther. 2021;110:803–807. doi: 10.1002/cpt.2269. - DOI - PubMed
    1. Domenger C, Grimm D. Next-generation AAV vectors-do not judge a virus (only) by its cover. Hum. Mol. Genet. 2019;28:R3–R14. doi: 10.1093/hmg/ddz148. - DOI - PubMed
    1. Agarwal S, High-dose AAV. gene therapy deaths. Nat. Biotechnol. 2020;38:910. doi: 10.1038/s41587-020-0642-9. - DOI - PubMed

Substances