. 2023 Jun;37(6):1311-1323.
doi: 10.1038/s41375-023-01885-1. Epub 2023 Apr 8.

A novel patient-derived 3D model recapitulates mantle cell lymphoma lymph node signaling, immune profile and in vivo ibrutinib responses

Affiliations

A novel patient-derived 3D model recapitulates mantle cell lymphoma lymph node signaling, immune profile and in vivo ibrutinib responses

Ferran Araujo-Ayala et al. Leukemia. 2023 Jun.

Abstract

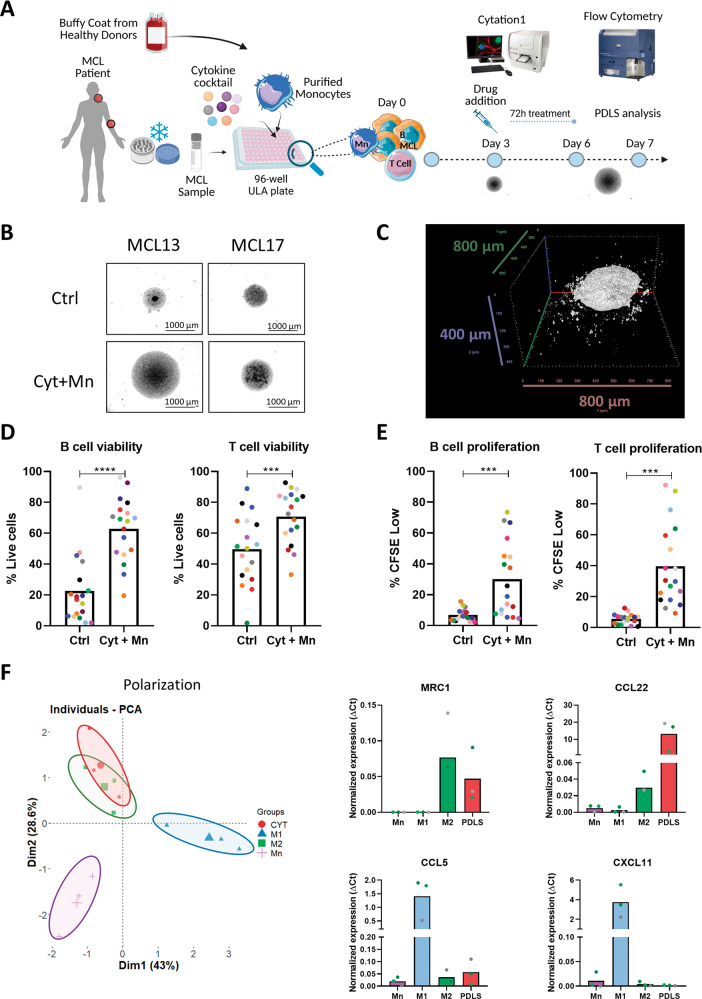
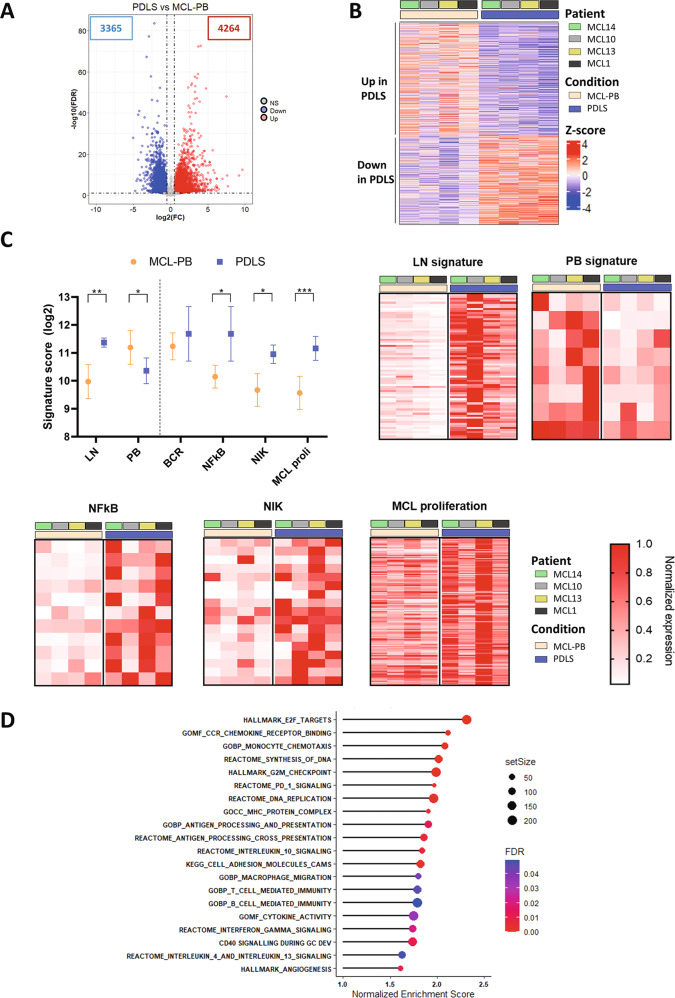
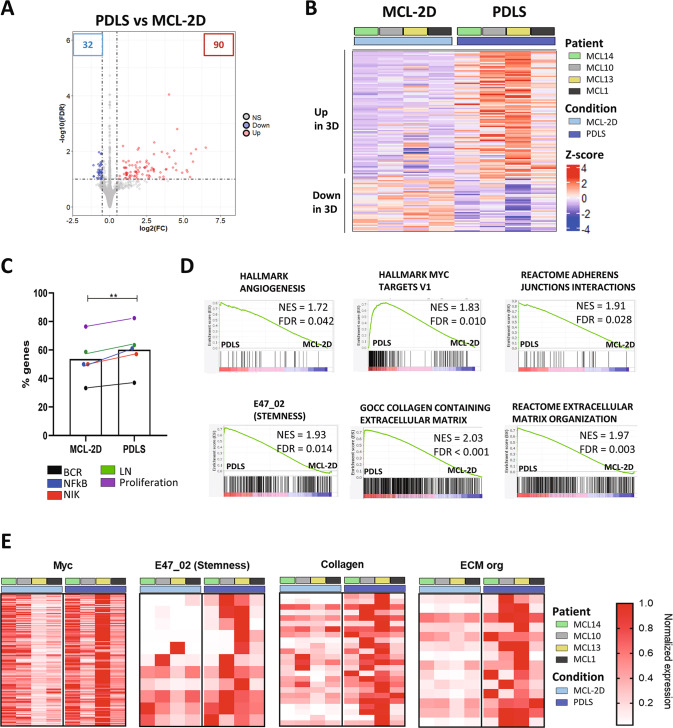
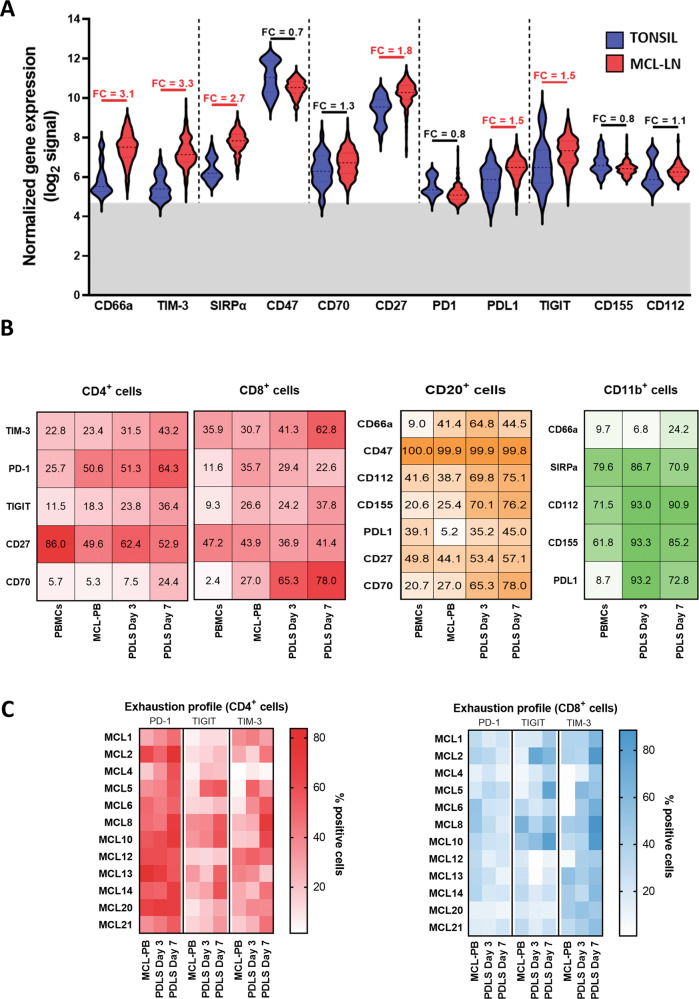
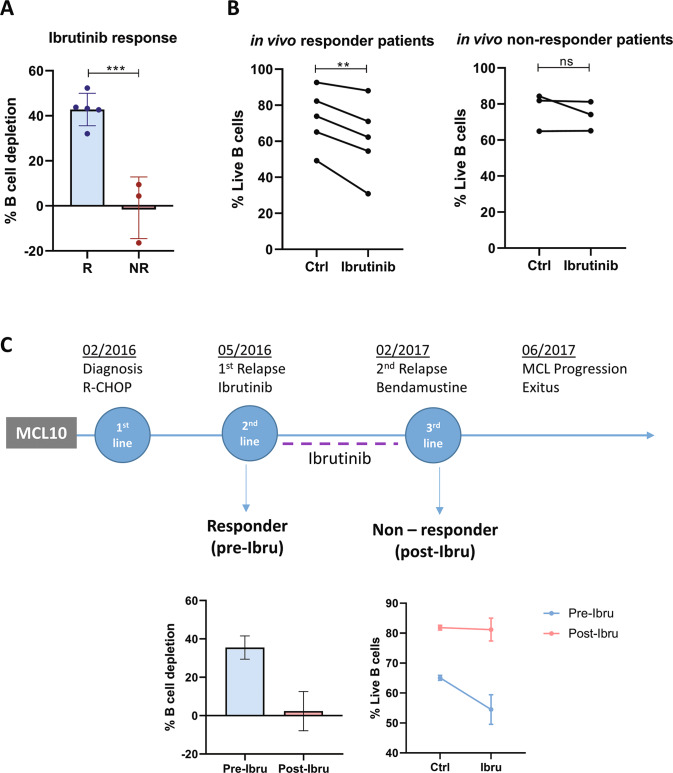
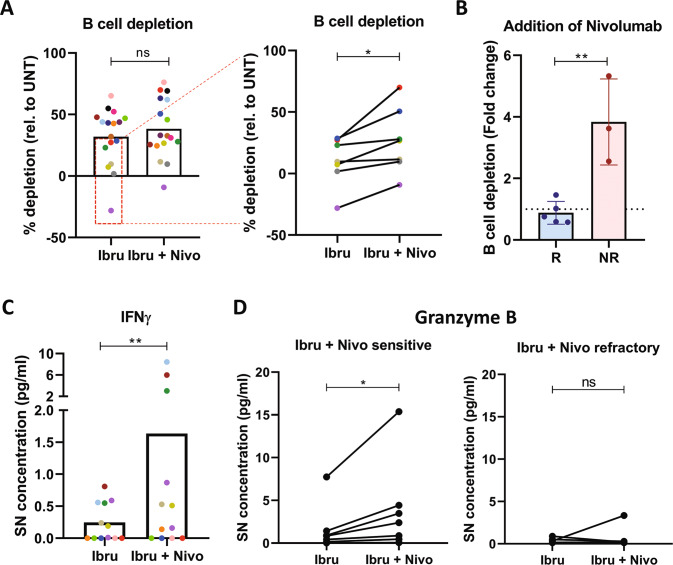
Mantle cell lymphoma (MCL), a rare and aggressive B-cell non-Hodgkin lymphoma, mainly develops in the lymph node (LN) and creates a protective and immunosuppressive niche that facilitates tumor survival, proliferation and chemoresistance. To capture disease heterogeneity and tumor microenvironment (TME) cues, we have developed the first patient-derived MCL spheroids (MCL-PDLS) that recapitulate tumor oncogenic pathways and immune microenvironment in a multiplexed system that allows easy drug screening, including immunotherapies. MCL spheroids, integrated by tumor B cells, monocytes and autologous T-cells self-organize in disc-shaped structures, where B and T-cells maintain viability and proliferate, and monocytes differentiate into M2-like macrophages. RNA-seq analysis demonstrated that tumor cells recapitulate hallmarks of MCL-LN (proliferation, NF-kB and BCR), with T cells exhibiting an exhaustion profile (PD1, TIM-3 and TIGIT). MCL-PDLS reproduces in vivo responses to ibrutinib and demonstrates that combination of ibrutinib with nivolumab (anti-PD1) may be effective in ibrutinib-resistant cases by engaging an immune response with increased interferon gamma and granzyme B release. In conclusion, MCL-PDLS recapitulates specific MCL-LN features and in vivo responses to ibrutinib, representing a robust tool to study MCL interaction with the immune TME and to perform drug screening in a patient-derived system, advancing toward personalized therapeutic approaches.


Conflict of interest statement

MN, RM, PB-L and J-ML are employees of Imactiv3D. The rest of the authors declare no conflict of interest.

Figures

Fig. 1
Fig. 1. MCL-PDLS as a novel 3D model to culture MCL samples ex vivo.
A Representative scheme showing the workflow for MCL-PDLS generation. Created with BioRender.com. B Brightfield images (magnification ×40) captured in the Cytation 1 of PDLS generated with cytokines (Cyt) and monocytes (Mn) stimuli compared to non-stimulated PDLS control (Ctrl) after 7 days of culture. C 3D reconstruction of a representative PDLS (MCL 1) from an image obtained by SPIM microscopy. D Cell viability in tumor B cells and autologous T cells from PDLS determined by percentage of negative LIVE/DEAD fixable Aqua staining (n = 18) after 7 days of culture. E Cell proliferation in B cells and T cells, calculated as percentage of CFSE low cells, after 7 days of culture (n = 18). F PCA analysis using normalized expression values of six genes related to macrophage polarization obtained by RT-qPCR in macrophages isolated from MCL-PDLS and 2D-differentiated macrophages polarized to M1 or M2 phenotype as references. Undifferentiated monocytes were used as a control. MRC1 and CCL22 are used as M2 markers while CCL5 and CXCL11 are used as M1 markers.
Fig. 2
Fig. 2. MCL-PDLS transcriptome recapitulates lymph node hallmarks.
A Volcano plot representing the differentially expressed genes (DEG) comparing PDLS after 7 days of culture with the original MCL peripheral blood (MCL-PB) sample. DEG were obtained by a paired (n = 4) DESeq2 analysis (FDR < 0.1 and absolute log2FC > 0.5). B Heatmap of DEG for the individual patients (n = 4). C Signature score of MCL hallmark pathways as described by Saba and Rosenwald [12, 34]. Values were calculated as the geometric mean of the normalized counts for the genes involved in each pathway. For each significantly upregulated gene set, the leading genes are represented in a heatmap. D Bubble plot representing the most significant and representative GSEA pathways upregulated in MCL-PDLS compared to MCL-PB.
Fig. 3
Fig. 3. PDLS transcriptome compared to MCL-2D.
A Volcano plot representing the differentially expressed genes (DEG) between MCL-PDLS after 7 days of culture to 2D-MCL culture with monocytes and cytokines. DEG were obtained by a paired (n = 4) DESeq2 analysis (FDR < 0.1 and absolute log2FC > 0.5). B Heatmap of DEG for the individual patients (n = 4). C Percentage of genes described in each pathway (as in Fig. 2) [12, 34] which are upregulated in the PDLS or in MCL-2D. D GSEA plots representing significantly enriched pathways (FDR < 0.05) in the PDLS compared to 2D-MCL. E Heatmaps of leading genes of the indicated gene sets in (D).
Fig. 4
Fig. 4. Evolution of the immune profile in the MCL-PDLS.
A Differential gene expression analysis from microarray data obtained from public repositories (detailed in Supplementary Methods) showed upregulation of several immune regulators in MCL-LN (n = 199) compared to a normal tonsil (n = 30). In red those comparatives that are statistically significant (p value <0.001 and absolute FC > 1.5). B Percentage of positive cells assessed by flow cytometry for the immune regulators represented in (A) in B, T cells and monocytes. Data are represented as mean values after thawing (MCL-PB or monocytes) or in the PDLS after 3 and 7 days of culture. PBMCs from healthy donors were included as reference. C Expression levels of immune exhaustion markers in CD4+ and CD8+ T cells in each individual patient in the same experimental conditions as in (B). Data are represented as percentage of positive cells.
Fig. 5
Fig. 5. MCL-PDLS reproduces in vivo response to ibrutinib.
A Tumor B-cell depletion after 72 h of ibrutinib treatment compared to untreated condition in PDLS generated from MCL patients who in vivo responded to ibrutinib (R) or patients who did not respond to the drug (NR). B B-cell viability in untreated (Ctrl) or after in vitro ibrutinib treatment (72 h) in PDLS from in vivo responder or non-responder patients. C Clinical case of MCL10 including timeline with the different lines of treatment. Graphs showed B-cell depletion and viability of PDLS after 72 h of treatment with ibrutinib refereed to untreated control.
Fig. 6
Fig. 6. Ibrutinib and nivolumab combination is effective in ibrutinib-resistant patients by activating the immune system.
A B-cell depletion of ibrutinib and nivolumab combination (Ibru + Nivo) compared to ibrutinib monotherapy (Ibru) (n = 17), with a significant benefit in most resistant patients (n = 7). B Effect of adding nivolumab to ibrutinib treatment in in vivo responder (R) or non-responder (NR) patients, represented as the fold change of B-cell depletion induced by the combination compared to Ibrutinib monotherapy. C Interferon gamma (IFNγ) concentration in PDLS supernatants comparing ibrutinib monotherapy or in combination with Nivolumab in MCL-PDLS. D Granzyme B secretion comparing ibrutinib monotherapy with ibrutinib and nivolumab combo, in sensitive or resistant patients to the combination. Cytometric Bead Array (CBA) analysis of cell culture supernatants was used in (C) and (D) (n = 12).

References

    1. Fernàndez V, Salamero O, Espinet B, Solé F, Royo C, Navarro A, et al. Genomic and gene expression profiling defines indolent forms of mantle cell lymphoma. Cancer Res. 2010;70:1408–18. doi: 10.1158/0008-5472.CAN-09-3419. - DOI - PubMed
    1. Navarro A, Clot G, Royo C, Jares P, Hadzidimitriou A, Agathangelidis A, et al. Molecular subsets of mantle cell lymphoma defined by the IGHV mutational status and SOX11 expression have distinct biologic and clinical features. Cancer Res. 2012;72:5307–16. doi: 10.1158/0008-5472.CAN-12-1615. - DOI - PMC - PubMed
    1. Royo C, Navarro A, Clot G, Salaverria I, Giné E, Jares P, et al. Non-nodal type of mantle cell lymphoma is a specific biological and clinical subgroup of the disease. Leukemia. 2012;26:1895–8. doi: 10.1038/leu.2012.72. - DOI - PMC - PubMed
    1. Nadeu F, Martin-Garcia D, Clot G, Díaz-Navarro A, Duran-Ferrer M, Navarro A, et al. Genomic and epigenomic insights into the origin, pathogenesis, and clinical behavior of mantle cell lymphoma subtypes. Blood. 2020;136:1419–32. doi: 10.1182/blood.2020005289. - DOI - PMC - PubMed
    1. Beà S, Valdés-Mas R, Navarro A, Salaverria I, Martín-Garcia D, Jares P, et al. Landscape of somatic mutations and clonal evolution in mantle cell lymphoma. Proc Natl Acad Sci USA. 2013;110:18250–5. doi: 10.1073/pnas.1314608110. - DOI - PMC - PubMed

Publication types