. 2023 May;42(21):1751-1762.
doi: 10.1038/s41388-023-02684-9. Epub 2023 Apr 8.

Molecular characterization stratifies VQ myeloma cells into two clusters with distinct risk signatures and drug responses

Affiliations

Molecular characterization stratifies VQ myeloma cells into two clusters with distinct risk signatures and drug responses

Evan Flietner et al. Oncogene. 2023 May.

Abstract

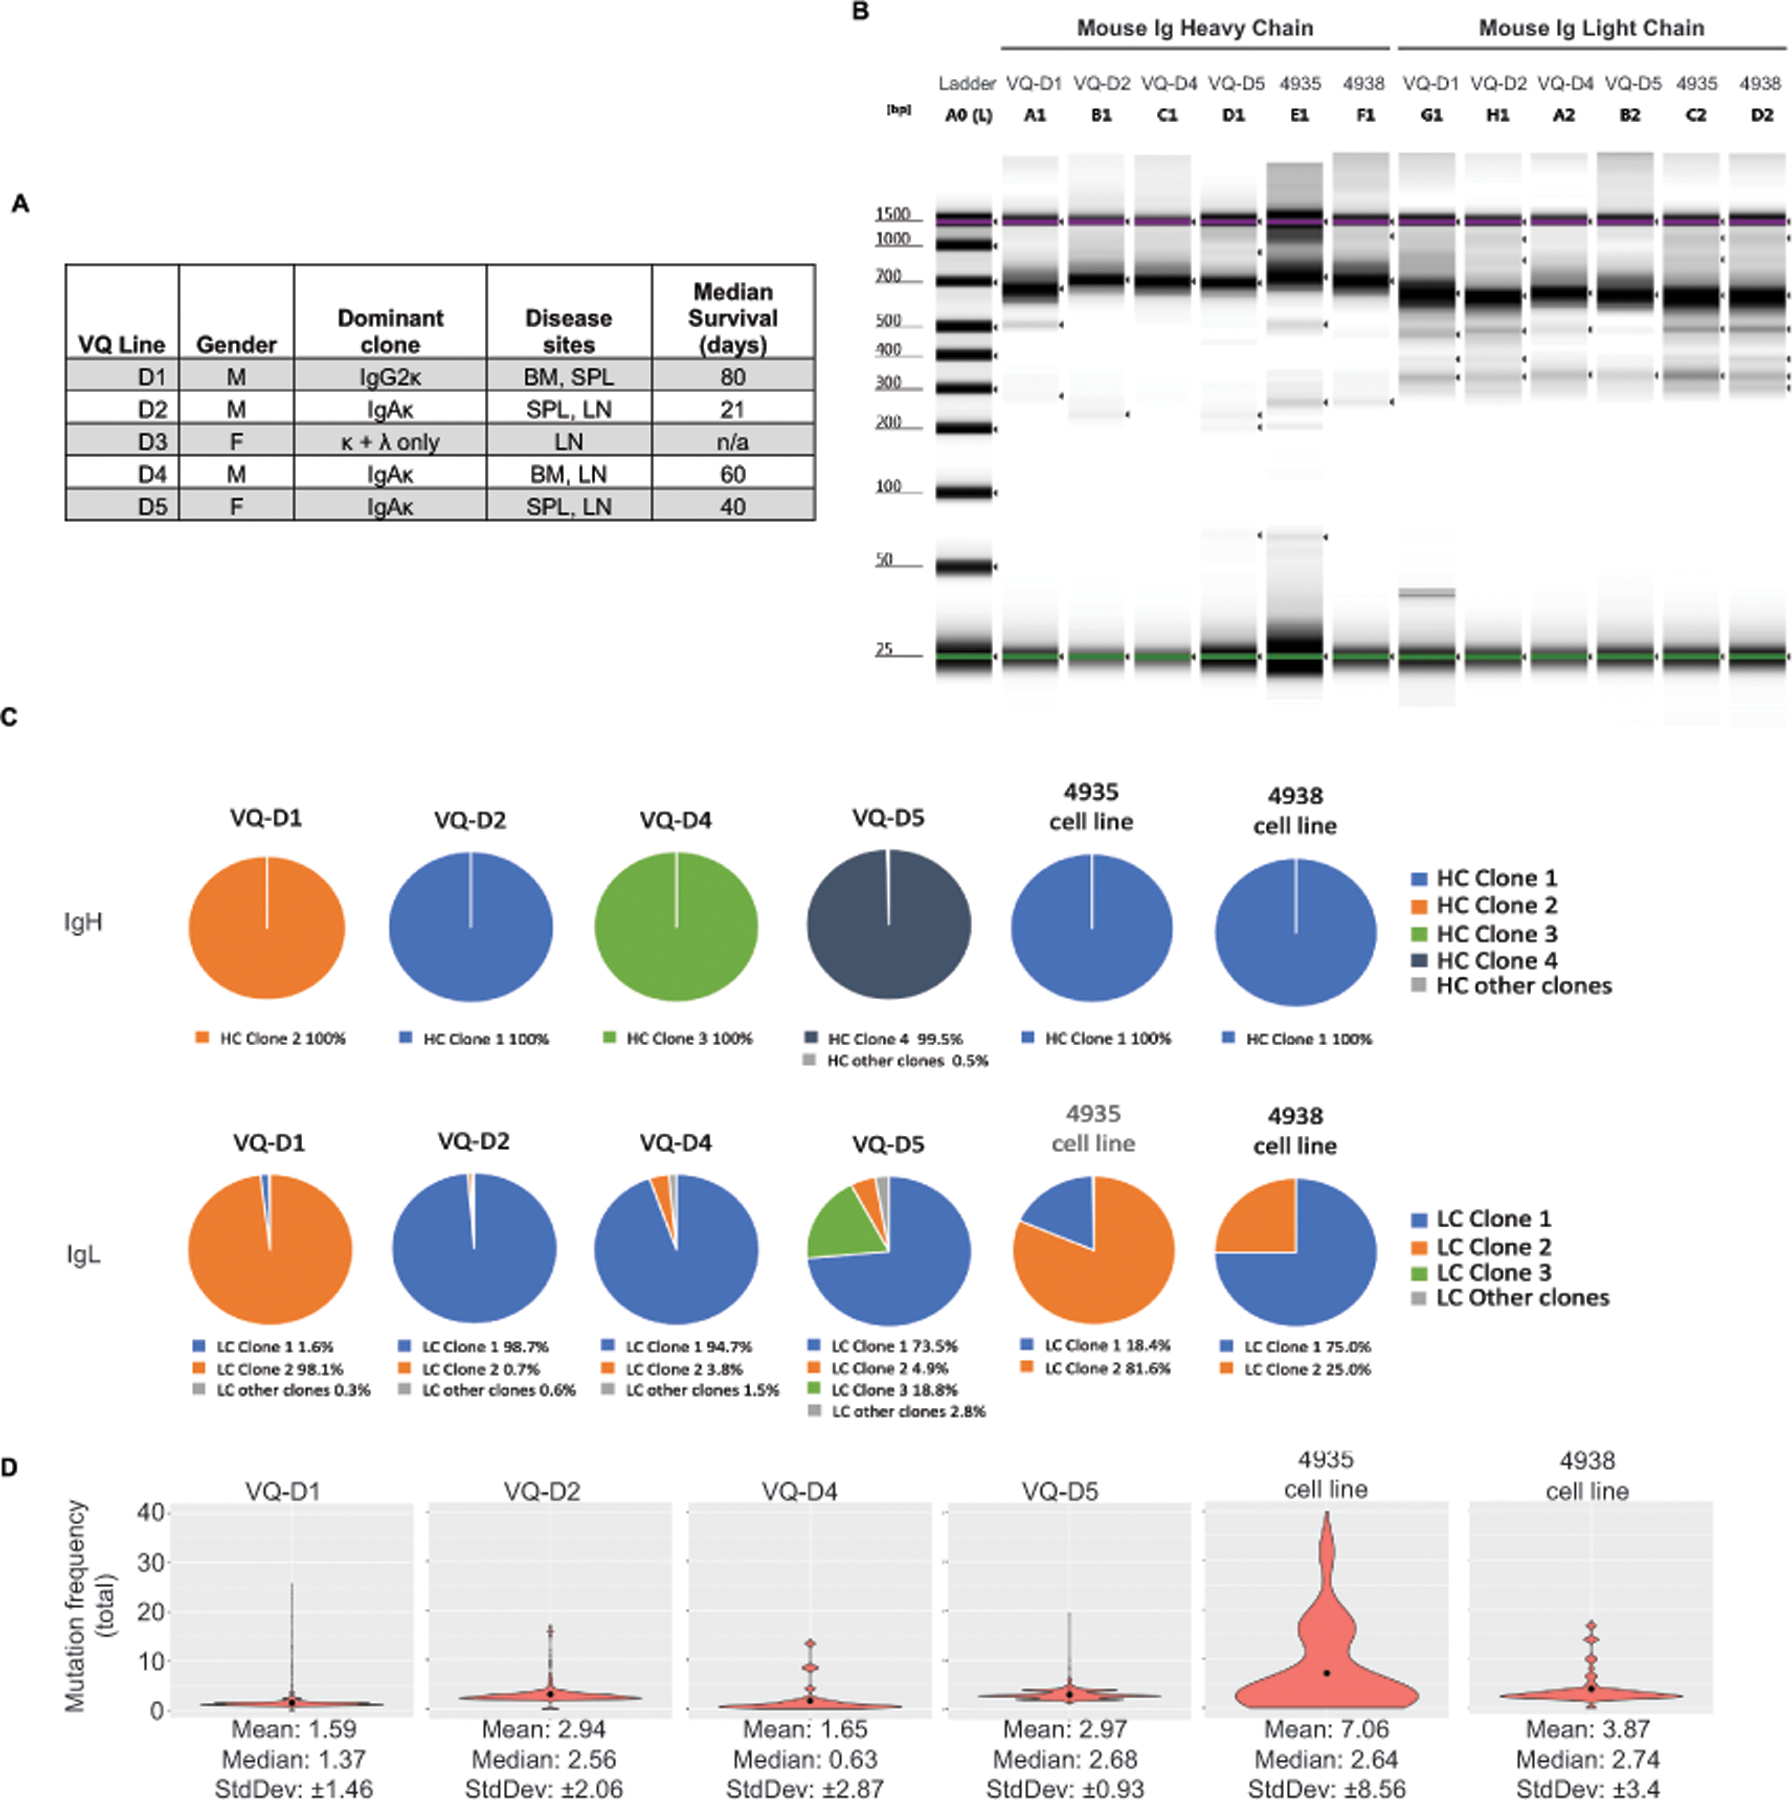
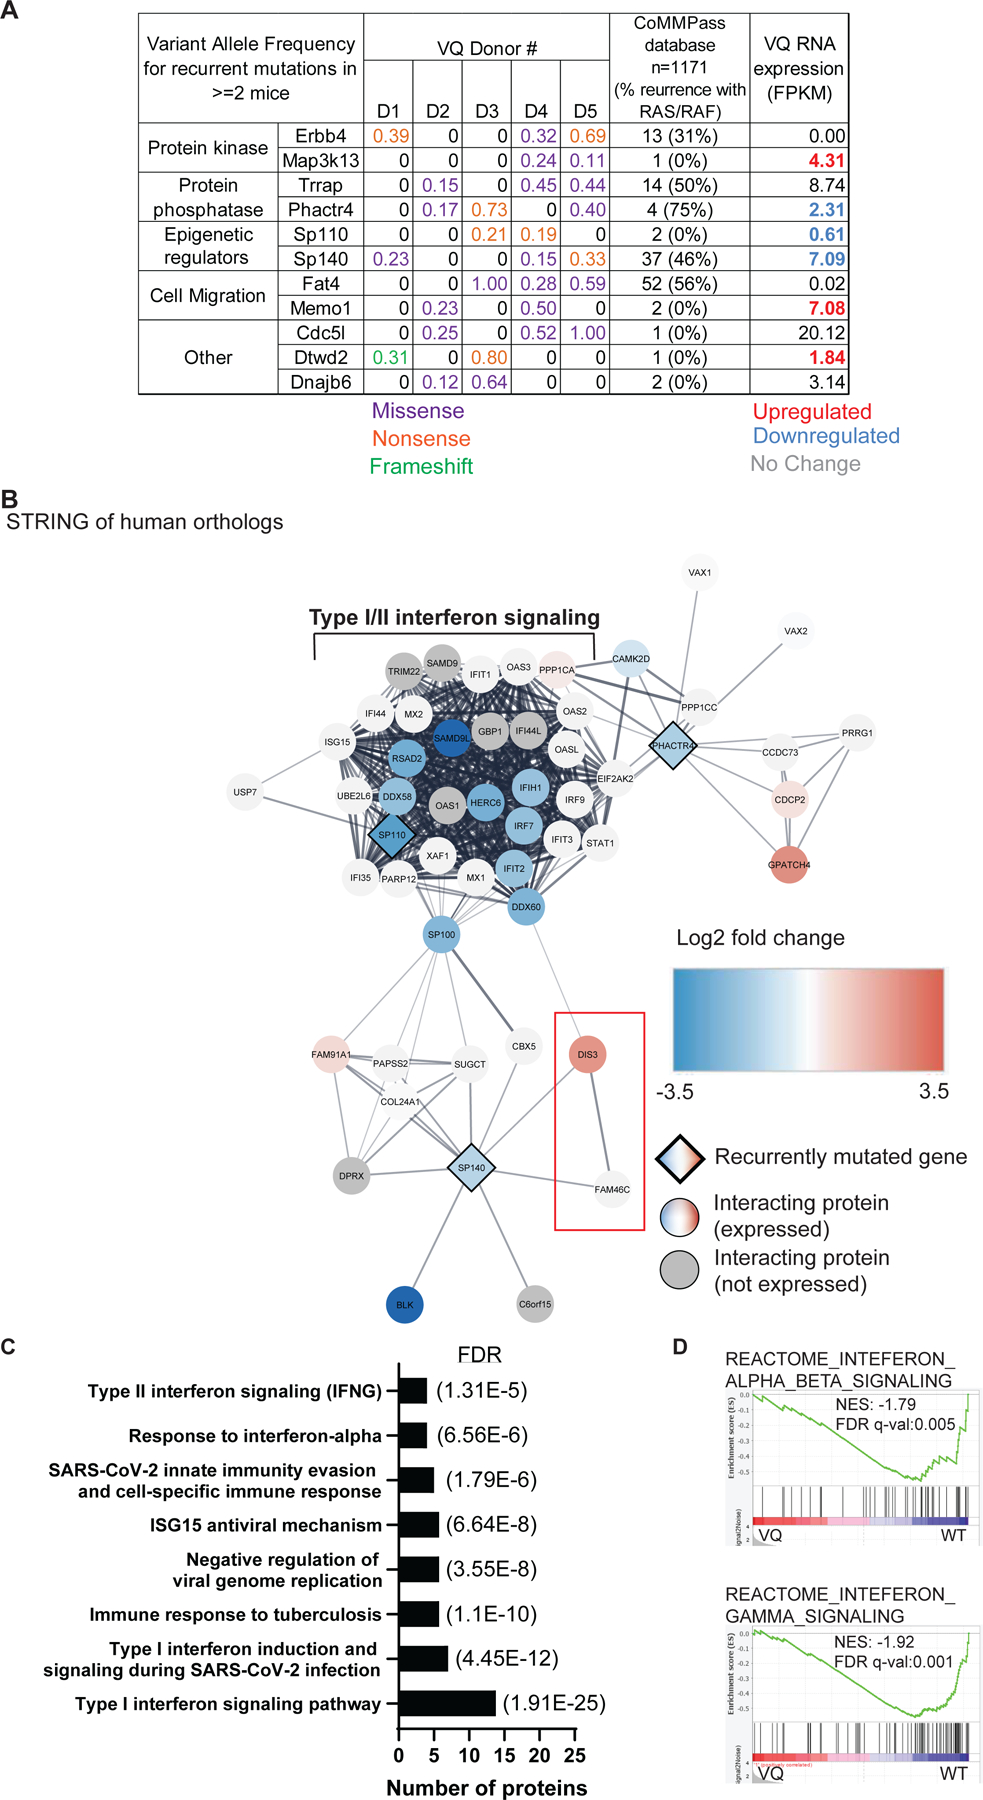
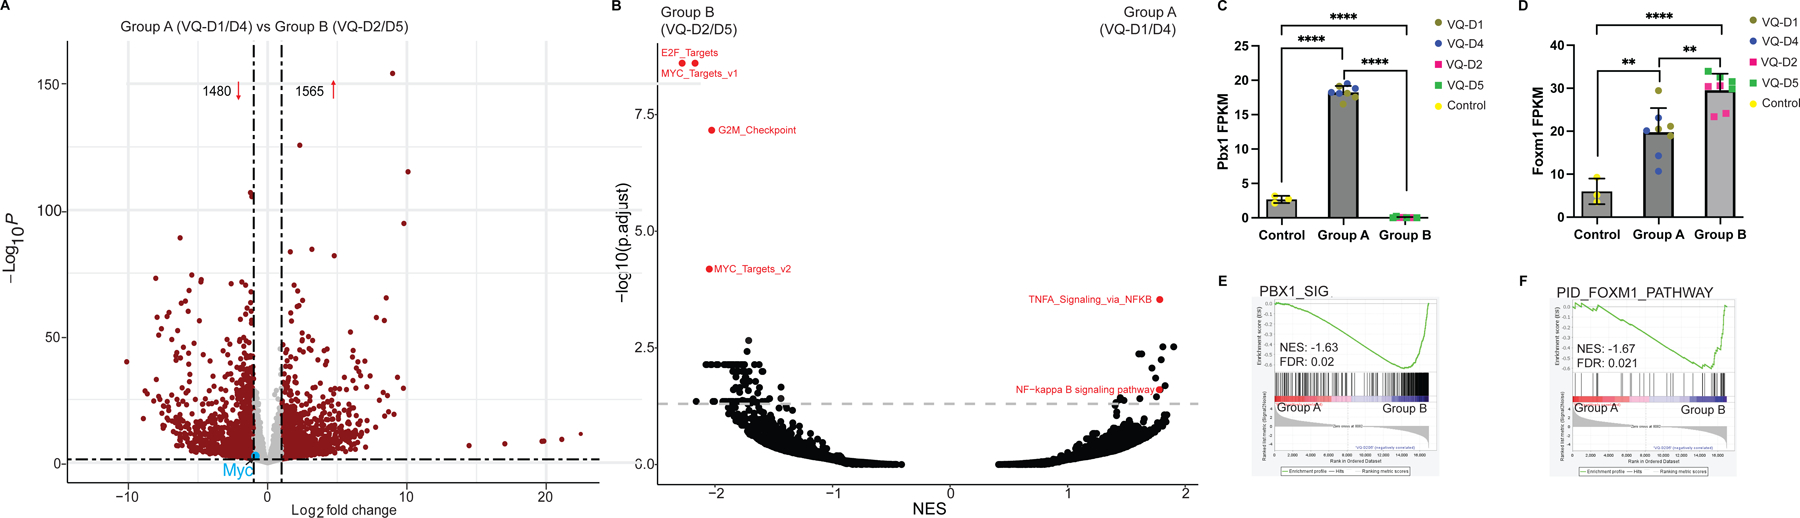
Multiple myeloma (MM) is a cancer of malignant plasma cells in the bone marrow and extramedullary sites. We previously characterized a VQ model for human high-risk MM. The various VQ lines display different disease phenotypes and survival rates, suggesting significant intra-model variation. Here, we use whole-exome sequencing and copy number variation (CNV) analysis coupled with RNA-Seq to stratify the VQ lines into corresponding clusters: Group A cells had monosomy chromosome (chr) 5 and overexpressed genes and pathways associated with sensitivity to bortezomib (Btz) treatment in human MM patients. By contrast, Group B VQ cells carried recurrent amplification (Amp) of chr3 and displayed high-risk MM features, including downregulation of Fam46c, upregulation of cancer growth pathways associated with functional high-risk MM, and expression of Amp1q and high-risk UAMS-70 and EMC-92 gene signatures. Consistently, in sharp contrast to Group A VQ cells that showed short-term response to Btz, Group B VQ cells were de novo resistant to Btz in vivo. Our study highlights Group B VQ lines as highly representative of the human MM subset with ultrahigh risk.


Conflict of interest statement

Competing Interests statement:

We declare that no conflict of interest exists.

Competing Interests Statement:

We declare no competing financial interests.

Figures

Figure 1.
Figure 1.. B cell receptor repertoire analysis shows dominant clonality and low somatic hypermutation (SHM) rates in primary VQ cells and VQ cell lines.
(A) Table summarizing previously established characteristics of VQ donor lines. (B-D) B cell receptor heavy-chain and light-chain repertoire analysis was carried out as described in Methods. (B) Tapestation image showing immunoglobulin heavy chain and light chain library amplification for samples in panels C and D. (C) Pie charts depicting clonal frequency for immunoglobulin heavy chain (IgH) sequences (top) and immunoglobulin light chain sequences (bottom) sequences from primary VQ cells (VQ-D1, D2, D4, and D5) and from VQ-D2 derived cell lines (4935 and 4938). (D) Violin plots showing mean (black dots) and distribution of the total somatic hypermutation frequencies across B-cell IgH sequences from primary VQ cells (VQ-D1, D2, D4, and D5) and from VQ-D2 derived cell lines (4935 and 4938).
Figure 2.
Figure 2.. Whole exome sequencing identifies recurrently mutated genes in VQ myeloma cells.
Five paired tail DNA (non-leukemia control) and genomic DNA from VQ CD138+ B220plasma cells were subjected to whole exome sequencing as described in Materials and Methods. (A) Recurrently mutated genes (mutated in ≥ 2/4 mice) and their variant allele frequencies (VAF) in VQ cells, frequency of mutation in human orthologs as determined from a cohort of 1,171 MM patient samples from the CoMMPass database, and mRNA expression (as determined by Fragments Per Kilobase of gene per Million mapped reads FPKM) in VQ cells are shown. (B) Cytoscape-generated STRING network of recurrently mutated genes with decreased RNA expression, as well as 40 closest interacting proteins as determined by STRING analysis. Recurrently mutated genes are represented by diamonds. Interacting proteins are denoted by circles. Genes with differential expression are color-coded. (C) Select list of pathways enriched in genes highlighted in panel B. (D) GSEA of Reactome gene sets for interferon alpha/beta signaling (top) and interferon gamma signaling (bottom) between VQ and control plasma cells. NES, normalized enrichment score. FDR, false discovery rate.
Figure 3.
Figure 3.. Copy number variation (CNV) analysis stratifies VQ cells based on recurrent amplification of chromosome 3 and monosomy chromosome 5.
(A-B) CNV analysis was performed using the whole exome sequencing data as described in Materials and Methods. Orange dots indicate significant changes in log2 copy ratio for a given call segment in plasma cells compared to non-leukemia control samples. Location and name of tumor suppressors and oncogenes related to myeloma pathogenesis are shown in red. CNV plots are grouped according to recurrent CNV status. (C-F) Transcript levels of Nras (C), Fam46c (D), Cdk6 and Cdk4 (E), and Mmset/Whsc1 (F) are shown in CD138+ B220 cells from control and VQ recipient mice. FPKM, Fragments Per Kilobase of transcript per Million mapped reads. One-way analysis of variance with Tukey’s post-test was performed. Tissue of origin for individual samples is denoted by legend. (G-H) CD45.1 recipient mice were sub-lethally irradiated and injected with bone marrow cells from moribund VQ-D1 donor mouse or splenocytes from moribund VQ-D2 donor mouse. Six weeks (VQ-D1) or two weeks (VQ-D2) post-transplant, mice were treated with vehicle or trametinib. (G) Serum protein electrophoresis was performed to quantify the γ-globulin/Albumin (G/A) ratios in VQ-D1 and VQ-D2 recipient mice at day 21 of treatment. Two-sided t-test was performed. (H) Kaplan-Meier survival curves were plotted against days after treatment. Log-rank test was performed. Note: VQ-D1 results are combined from historical [24, 25] and new data. ns, not significant. *, p<0.05. **, p<0.01. ***, p<0.001. ****, p<0.0001.
Figure 4.
Figure 4.. RNA-Seq analysis reveals two distinct transcriptional clusters of VQ myeloma.
Bulk RNA-Seq analysis was performed using flow sorted CD138+ B220− CD45.2+ cells from bone marrow (BM) of control mice (n=3) and BM, spleen (SPL), lymph node (LN), or liver (Liv) of multiple VQ-D1, VQ-D2, VQ-D4, and VQ-D5 recipients. (A) Clustered heat map of RNA-seq gene count data. Samples are color-coded by tissue sites and VQ lines as indicated. (B) tSNE analysis of gene counts data of VQ myeloma samples. Samples are color-coded by VQ lines as in panel A. Tissue of origin for individual samples is denoted by legend.
Figure 5.
Figure 5.. VQ Group B myeloma cells have increased expression of cancer growth pathways and Amp1q-associated PBX1-FOXM1 gene signatures.
(A) Volcano plot of differentially expressed genes (red dots) in Group A (VQ-D1/D4) vs Group B (VQ-D2/D5). (B) Overview of gene set enrichment analysis between Group A (VQ-D1/D4) and Group B (VQ-D2/D5) myeloma cells. Relevant pathways are highlighted in red. (C, D) Transcript levels of Pbx1 (C) and Foxm1 (D) are shown in control and VQ Group A and B CD138+ B220 cells. (E, F) GSEA plots comparing Group A to Group B for (E) PBX1 and (F) FOXM1 gene signatures. NES, normalized enrichment score; FDR, false discovery rate; p. adj., adjusted P-value. **, p <0.01; ****, p <0.0001.
Figure 6.
Figure 6.. High-risk multiple myeloma gene signatures are enriched in VQ Group B compared to VQ Group A and t-Vk12653 Vĸ*Myc cells.
(A, B) GSEA plots comparing the upregulated genes in UAMS-70 gene signature between Group A (VQ-D1/D4) and Group B (VQ-D2/D5) MM cells (A) as well as between t-Vk12653 and Group B (VQ-D2/D5) cells (B). (C) EMC-92 risk scores calculated using clinical risk algorithm (see Materials and Methods) for control plasma cells, t- Vk12653 cells, and Group A and B VQ cells. Two-sided t-test with Holm Bonferroni Correction was performed. Samples are color-coded and tissues of origin for individual samples are denoted by legend. FDR, false discovery rate; NES, normalized enrichment score; ns, not significant. **, p <0.01.
Figure 7.
Figure 7.. Group B and Group A VQ cells display distinct responses to bortezomib in vivo.
(A) Gene set enrichment analysis (GSEA) of KEGG_ NF-kappa B signaling pathway and Hallmark_TNFA signaling via NFKB between Group A (VQ-D1/D4) and Group B (VQ-D2/D5) myeloma cells. (B) Transcript levels of NF-ĸB related genes Tnfaip3, CD74, and Il2rg in CD138+ B220 cells from Group A and B VQ myeloma mice. VQ donor of origin is color-coded as indicated. Results are presented as mean + SD. Two-sided t-Test was performed. FPKM, Fragments Per Kilobase of transcript per Million mapped reads. (C) GSEA of KEGG_Proteasome pathway between Group A (VQ-D1/D4) and Group B (VQ-D2/D5) myeloma cells. (D) Transcript levels of proteasome pathway genes Psmb6, Psmb7, and Psmb5, in CD138+ B220 cells from control and Group A and B VQ myeloma mice. These genes encode bortezomib-targeted β1, β2, and β5 subunit correspondingly. VQ donor of origin is color-coded as indicated. Results are presented as mean + SD. Two-sided t-Test was performed. (E, F) Btz dose-response curves in VQ MM 4935 (E) and 4938 (F) cell lines expressing shControl or shPsmb7. Results are presented as mean + SD. Two-sided t-Test was performed. (G, H) CD45.1 recipient mice were sub-lethally irradiated and injected with bone marrow cells from moribund VQ-D1 donor mouse or splenocytes from moribund VQ-D2 donor mouse. Six weeks (VQ-D1) or two weeks (VQ-D2) posttransplant, mice were treated with vehicle or bortezomib as described in Materials and Methods. (G) Serum protein electrophoresis was performed to quantify the γ-globulin/Albumin (G/A) ratios in VQ-D2 recipient mice at day 21 of treatment. Two-sided t-Test was performed. (H) Kaplan-Meier survival curves were plotted against days after treatment. Log-rank test was performed. Note: VQ-D1 results are taken from historical data [25]. FDR, false discovery rate; NES, normalized enrichment score; ns, not significant; p. adj., adjusted P-value. *, p <0.05; **, p <0.01; ***, p <0.001; ****, p <0.0001.

Similar articles

Cited by

References

    1. Palumbo A, Anderson K. Multiple myeloma. N Engl J Med 2011; 364: 1046–1060. - PubMed
    1. Walker BA, Wardell CP, Chiecchio L, Smith EM, Boyd KD, Neri A et al. Aberrant global methylation patterns affect the molecular pathogenesis and prognosis of multiple myeloma. Blood 2011; 117: 553–562. - PubMed
    1. Caro J, Al Hadidi S, Usmani S, Yee AJ, Raje N, Davies FE. How to Treat High-Risk Myeloma at Diagnosis and Relapse. Am Soc Clin Oncol Educ Book 2021; 41: 291–309. - PubMed
    1. Solimando AG, Da Via MC, Cicco S, Leone P, Di Lernia G, Giannico D et al. High-Risk Multiple Myeloma: Integrated Clinical and Omics Approach Dissects the Neoplastic Clone and the Tumor Microenvironment. J Clin Med 2019; 8. - PMC - PubMed
    1. Mikhael JR, Dingli D, Roy V, Reeder CB, Buadi FK, Hayman SR et al. Management of newly diagnosed symptomatic multiple myeloma: updated Mayo Stratification of Myeloma and Risk-Adapted Therapy (mSMART) consensus guidelines 2013. Mayo Clin Proc 2013; 88: 360–376. - PubMed

Publication types

MeSH terms