. 2023 May;43(5):562-581.
doi: 10.1002/cac2.12420. Epub 2023 Apr 8.

High baseline tumor burden-associated macrophages promote an immunosuppressive microenvironment and reduce the efficacy of immune checkpoint inhibitors through the IGFBP2-STAT3-PD-L1 pathway

Affiliations

High baseline tumor burden-associated macrophages promote an immunosuppressive microenvironment and reduce the efficacy of immune checkpoint inhibitors through the IGFBP2-STAT3-PD-L1 pathway

Zhaowei Wen et al. Cancer Commun (Lond). 2023 May.

Abstract

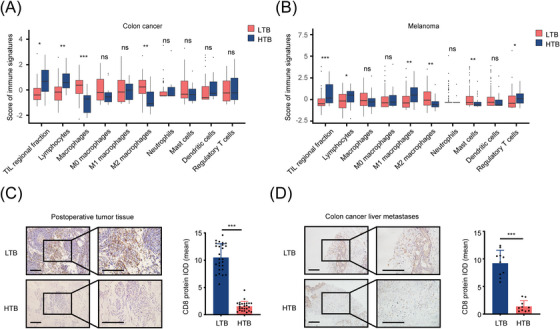
Background: Several clinical studies have uncovered a negative correlation between baseline tumor burden and the efficacy of immune checkpoint inhibitor (ICI) treatment. This study aimed to uncover the specific mechanisms underlying the difference in sensitivity to ICI treatment between tumors with high (HTB) and low (LTB) tumor burden.

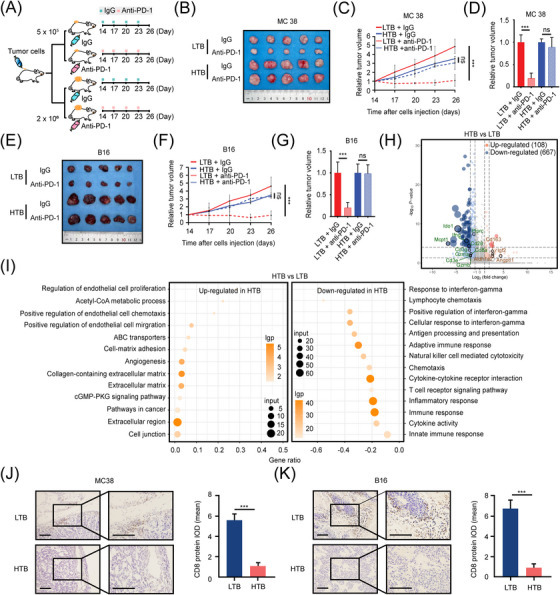
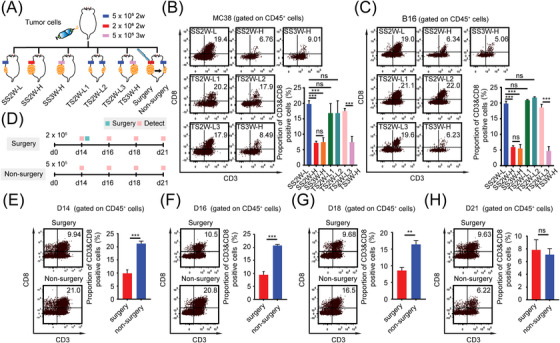
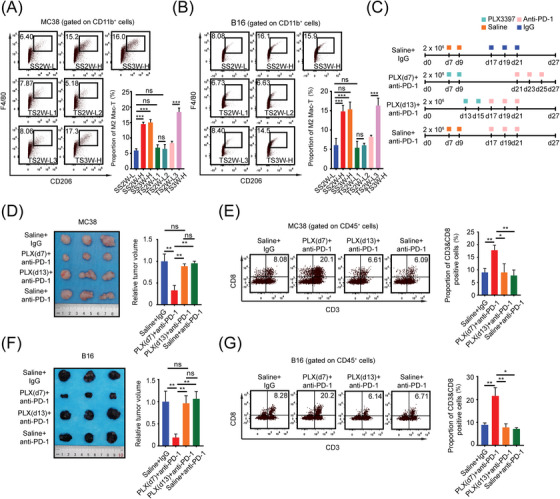
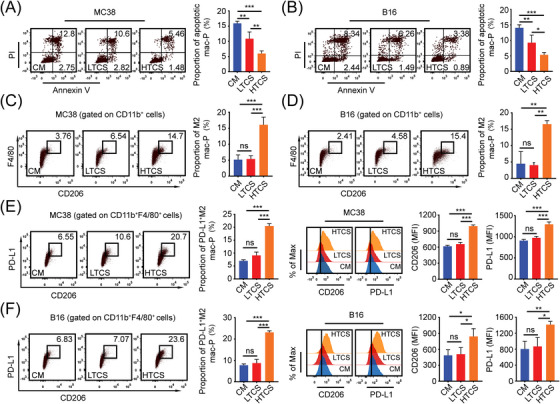
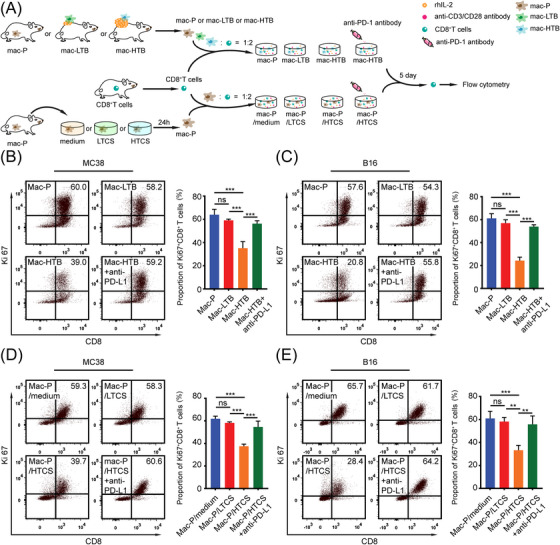
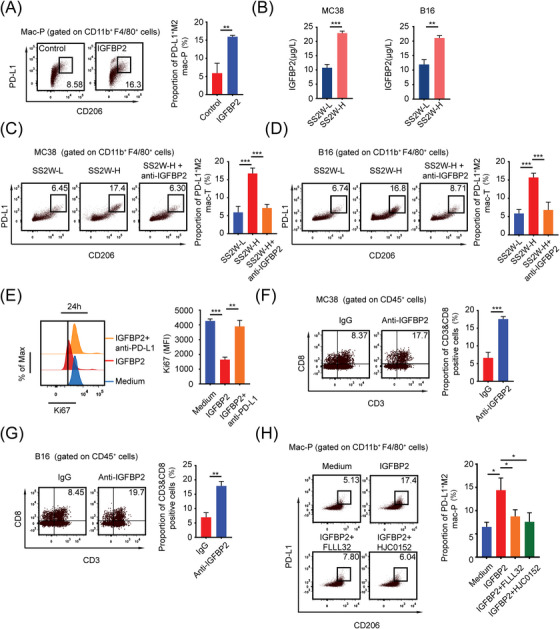
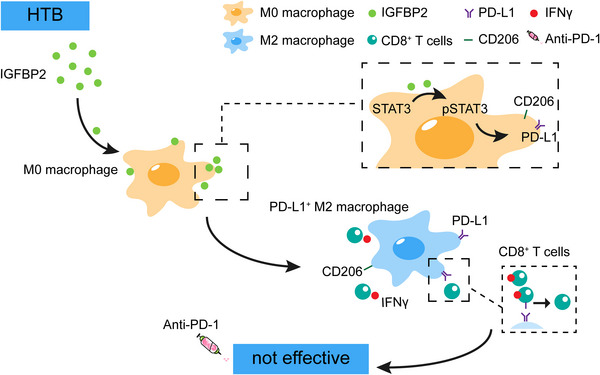
Methods: For in vivo studies, several mouse models of subcutaneous tumors were established, and transcriptome sequencing, immunohistochemistry, and flow cytometry assays were used to detect the immune status in these subcutaneous tumors. For in vitro experiments, co-culture models, cytokine antibody arrays, western blotting, flow cytometry, and enzyme-linked immunosorbent assays were used to explore the underlying molecular mechanisms RESULTS: We found that MC38 or B16 subcutaneous tumors from the HTB group did not show any response to anti-programmed cell death protein-1 (PD-1) therapy. Through flow cytometry assays, we found that the infiltration with CD8+ T cells was significantly decreased whereas M2-like macrophages were enriched in subcutaneous tumors of HTB groups compared with those of LTB group. These changes were not affected by the initial number of injected tumor cells or tumor age, nor could they be reversed by surgical tumor reduction. Intraperitoneal colony-stimulating factor 1 receptor (CSF-1R) inhibitor PLX3397 injection at different time points of tumor growth only had an effect when administered in the early tumor stage to maintain the "heat" of the tumor microenvironment during the process of tumor growth, thereby achieving a response to ICI treatment when the tumor grew to a large size. Mechanistically, we found that insulin-like growth factor binding protein 2 (IGFBP2) expression levels were significantly elevated in HTB tumor tissues. IGFBP2 promoted the programmed death-ligand 1 (PD-L1) expression in M2-like macrophages by activating signal transducer and activator of transcription 3 (STAT3), and PD-L1+ M2-like macrophages exerted an immunosuppressive effect by inhibiting the proliferation and activation of CD8+ T cells in a PD-L1-dependent fashion.

Conclusions: This study suggested that the low efficacy of ICI treatment in HTB tumors is mainly attributed to the intratumoral accumulation of PD-L1+ M2-like macrophages via the IGFBP2-STAT3-PD-L1 signaling pathway and their substantial inhibitory effects on T cell proliferation and activation.

Keywords: CD8+ T cell; IGFBP2; PD-L1; STAT3; immune checkpoint inhibitor; macrophage; tumor burden; tumor immune microenvironment.


Conflict of interest statement

The authors declare that they have no competing interests.

Figures

FIGURE 1
FIGURE 1
HTB is associated with the decreased amount of CD8+ T cells in TME, (A‐B) Box plots show the scores of immune signatures in the TCGA‐COAD (A) and TCGA‐SKCM (B) cohorts. Boxes represent 25%‐75% of values, lines in boxes represent median values, whiskers represent 1.5 interquartile ranges, and black dots represent outliers, (C) IHC staining showed the amount of CD8+ T cells in colon cancer postoperative tissues (LTB, n = 26; HTB, n = 25; scale bar = 100 μm), (D) IHC staining revealed the population of CD8+ T cells in the needle biopsy samples of liver metastases from patients with colon cancer (LTB, n = 10; HTB, n = 10; scale bar = 100 μm). ns, not significant; *, P < 0.05; **, P < 0.01; ***, P < 0.001. Abbreviations: HTB, high tumor burden; TME, tumor microenvironment; LTB, low tumor burden; TCGA, The Cancer Genome Atlas; IHC, immunohistochemistry; IOD, integrated option density.
FIGURE 2
FIGURE 2
HTB attenuates the efficacy of ICIs and may transform TME. (A) Schematic diagram of LTB and HTB animal model construction for anti‐PD‐1 treatment. Mice were injected with IgG (n = 5) or anti‐PD‐1 antibody (10 mg/kg, intraperitoneal injection, n = 5) every three days from day 14, (B) Subcutaneous tumor of MC38 group mice on day 26, (C) Relative tumor growth curve of MC38 group mice (n = 5), (D) Relative subcutaneous tumor volume of MC38 group mice on day 26, (E) Subcutaneous tumor of B16 group mice on day 26 (n = 5), (F) Relative tumor growth curve of B16 group mice, (G) Relative subcutaneous tumor volume of B16 group mice on day 26, (H) There are 775 genes significantly changed in HTB colon cancer compared to LTB colon cancer. The results were determined by RNA‐seq and shown by the volcano plot. 108 genes were highly expressed in HTB group, and 667 genes were low expressed, (I) GO Enrichment analysis showed that the immune relevant biological process is strongly correlated with tumor burden, (J) The population of CD8+ T cells in MC38 subcutaneous tumor is less in HTB group than in LTB group (scale bar = 100 μm), (K) The amount of CD8+ T cells in B16 subcutaneous tumor is less in HTB group than in LTB group (scale bar = 100 μm). ns, not significant; ***, P < 0.001. Abbreviations: HTB, high tumor burden; ICI, immune checkpoint inhibitor; lgp, ‐log10(p‐value); TME, tumor microenvironment; LTB, low tumor burden; PD‐1, programmed cell death protein 1; RNA‐seq, RNA sequencing; GO, gene ontology.
FIGURE 3
FIGURE 3
The HTB‐related “immune‐desert” phenotype is neither caused by tumor age nor by the morphological factor of tumor size, (A) Schematic diagram of various tumor burden animal model construction. MC38 cells or B16 cells were used to construct SS2W‐L (5 × 10⁵ cells, subcutaneous growth for 2 weeks), SS2W‐H (2.0 × 10⁶ cells, subcutaneous growth for 2 weeks), SS3W‐H (5 × 10⁵ cells, subcutaneous growth for 3 weeks), TS2W‐L1 & TS2W‐L2 (TS2W‐L1: 5 × 10⁵ cells, subcutaneous growth for 2 weeks on left side. TS2W‐L2: 5 × 10⁵ cells, subcutaneous growth for 2 weeks on right side), TS2W‐L3 & TS3W‐H (TS2W‐L3: 5 × 10⁵ cells, subcutaneous growth for 2 weeks on left side. TS3W‐H: 5 × 10⁵ cells, subcutaneous growth for 3 weeks on right side), Surgery & Non‐surgery (Surgery: 2.0 × 10⁶ cells, subcutaneous growth for 2 weeks, tumor reduction surgery was performed on day 14. Non‐surgery: 2.0 × 10⁶ cells, subcutaneous growth for 2 weeks, without tumor reduction surgery on day 14.) mice models, (B) Proportion of CD3+ CD8+ T cell in indicated MC38 subcutaneous tumors group detected by flow cytometry (n = 3), (C) Proportion of CD3+ CD8+ T cell in indicated B16 subcutaneous tumors group detected by flow cytometry (n = 3), (D) Schematic diagram of surgery mice model construction. MC38 cells were injected subcutaneously on the left (2.0 × 10⁶ cells) and right (5 × 10⁵ cells) sides of the same mouse. In order to make the tumor volume on both sides equal, tumor reduction surgery was performed on the left subcutaneous tumor on day 14. The intratumoral quantity of CD8+ T cells on days 14 (before surgery), 16, 18, and 21 were detected by flow cytometry (n = 3), (E) Proportion of CD3+ CD8+ T cell in subcutaneous tumor on day 14 detected by flow cytometry (n = 3), (F) Proportion of CD3+ CD8+ T cell in subcutaneous tumor on day 16 detected by flow cytometry (n = 3), (G) Proportion of CD3+ CD8+ T cell in subcutaneous tumor on day 18 detected by flow cytometry (n = 3), (H) Proportion of CD3+ CD8+ T cell in subcutaneous tumor on day 21 detected by flow cytometry (n = 3). ns, not significant; *, P < 0.05; **, P < 0.01; ***, P < 0.001. Abbreviations: HTB, high tumor burden; LTB, low tumor burden; SS, single side were injected subcutaneously; TS, two side were injected subcutaneously.
FIGURE 4
FIGURE 4
M2‐like macrophages accumulation fosters the “immune‐desert” phenotype and impedes the anti‐PD‐1 response in high‐burden tumors, (A) Proportion of M2‐like macrophages in each MC38 subcutaneous tumors group of Figure 3A detected by flow cytometry (n = 3), (B) Proportion of M2‐like macrophages in each B16 subcutaneous tumors group of Figure 3A detected by flow cytometry (n = 3), (C) Schematic diagram of mice treated with PLX3397 (40 mg/kg) and anti‐PD‐1 antibody (10 mg/kg), (D) Subcutaneous tumor and relative tumor volume of each MC38 group on day 27 (n = 3), (E) Before ICI treatment began, proportion of CD3+ CD8+ T cell in MC38 subcutaneous tumors of 4 groups were detected by flow cytometry, (F) Subcutaneous tumor and relative tumor volume of each B16 group on day 27 (n = 3), (G) Before ICI treatment began, proportion of CD3+ CD8+ T cell in B16 subcutaneous tumors of 4 groups were detected by flow cytometry. ns, not significant; *, P < 0.05;, **, P < 0.01; ***, P < 0.001. Abbreviations: HTB, high tumor burden; TME, tumor microenvironment; LTB, low tumor burden; PLX, PLX3397; PD‐1, programmed cell death protein 1.
FIGURE 5
FIGURE 5
HTB promotes the formation of PD‐L1+ M2 macrophages, (A) Flow cytometry revealed the proportion of apoptotic Mac‐Ps after exposure to control medium (CM, 50% complete medium + 50% serum free medium) or LTB MC38 subcutaneous tumor tissue culture supernatants (LTCS) or HTB MC38 subcutaneous tumor tissue culture supernatants (HTCS) for 24 hours (n = 3), (B) Flow cytometry revealed the proportion of apoptotic Mac‐Ps after exposure to control medium (CM) or LTB B16 subcutaneous tumor tissue culture supernatants (LTCS) or HTB B16 subcutaneous tumor tissue culture supernatants (HTCS) for 24 h (n = 3), (C) Flow cytometry revealed the proportion of M2 Mac‐Ps after exposure to CM or MC38 subcutaneous tumor tissue culture supernatants for 24 h (n = 3), (D) Flow cytometry revealed the proportion of M2 Mac‐Ps after exposure to CM or B16 subcutaneous tumor tissue culture supernatants for 24 h (n = 3), (E) Flow cytometry revealed the proportion of PD‐L1+ M2 Mac‐Ps after exposure to CM or MC38 subcutaneous tumor tissue culture supernatants for 24 h (n = 3), (F) Flow cytometry revealed the proportion of PD‐L1+ M2 Mac‐Ps after exposure to CM or B16 subcutaneous tumor tissue culture supernatants for 24 h (n = 3). ns, not significant; *, P < 0.05; **, P < 0.01; ***, P < 0.001. Abbreviations: LTB, low tumor burden; HTB, high tumor burden; PD‐L1, programmed death‐ligand 1; mac‐P, peritoneal macrophage; CM, control medium; LTCS, low tumor burden subcutaneous tumor tissue culture supernatants (50% complete medium + 50% MC38 or B16 low tumor burden subcutaneous tumor tissue culture supernatants); HTCS, high tumor burden subcutaneous tumor tissue culture supernatants (50% complete medium + 50% MC38 or B16 high tumor burden subcutaneous tumor tissue culture supernatants).
FIGURE 6
FIGURE 6
HTB‐associated PD‐L1+ M2‐like macrophages inhibited CD8+ T cells through PD‐1/PD‐L1, (A) Schematic diagram of co‐cultured system of macrophages and T cells. In the first model, we co‐cultured CD8+ T cells with control macrophages (mac‐Ps, from tumor free mice), LTB MC38 subcutaneous tumor‐infiltrating macrophages (mac‐LTB), and HTB MC38 subcutaneous tumor‐infiltrating macrophages (mac‐HTB), respectively. In the second model, the mac‐Ps would first be exposed to the control medium, LTCS, or HTCS for 24 h and then co‐cultured with CD8+ T cells as described for the first model. Anti‐PD‐L1 was added to supernatants of mac‐HTB & CD8+ T cell and HTCS‐exposed mac‐Ps & CD8+ T cell co‐culture systems, (B) Purified peripheral CD8+ T cells were co‐cultured with control macrophages (mac‐Ps) or mac‐LTB or mac‐HTB 2:1 for 5 days with or without anti‐PD‐L1 antibody (5 μg/mL). Ki‐67+ CD8+ T cells were detected by flow cytometry (n = 3), (C) Purified peripheral CD8+ T cells were co‐cultured with mac‐Ps or mac‐LTB or mac‐HTB from B16 subcutaneous tumor 2:1 for 5 days with or without anti‐PD‐L1 antibody (5 μg/mL). Ki‐67+ CD8+ T cells were detected by flow cytometry (n = 3), (D) Purified peripheral CD8+ T cells were co‐cultured with mac‐Ps which stimulated with medium (50% complete medium + 50% serum free medium) or MC38 subcutaneous tumor tissue culture supernatants 2:1 for 5 days with or without anti‐PD‐L1 antibody (5 μg/mL). Ki‐67+ CD8+ T cells were detected by flow cytometry (n = 3), (E) Purified peripheral CD8+ T cells were co‐cultured with mac‐Ps which stimulated with medium or B16 subcutaneous tumor tissue culture supernatants 2:1 for 5 days with or without anti‐PD‐L1 antibody (5 μg/mL). Ki‐67+ CD8+ T cells were detected by flow cytometry (n = 3). ns, not significant; **, P < 0.01; ***, P < 0.001. Abbreviations: LTB, low tumor burden; HTB, high tumor burden; PD‐1, programmed cell death protein 1; PD‐L1, programmed death‐ligand 1; mac‐P, peritoneal macrophage; mac‐T, tumor‐infiltrating macrophage; mac‐LTB, macrophage from low tumor burden subcutaneous tumor; mac‐HTB, macrophage from high tumor burden subcutaneous tumor; LTCS, low tumor burden subcutaneous tumor tissue culture supernatants (50% complete medium + 50% MC38 or B16 low tumor burden subcutaneous tumor tissue culture supernatants); HTCS, high tumor burden subcutaneous tumor tissue culture supernatants (50% complete medium + 50% MC38 or B16 high tumor burden subcutaneous tumor tissue culture supernatants); rhIL‐2, recombinant human interleukin‐2.
FIGURE 7
FIGURE 7
HTB induces PD‐L1+ M2‐like macrophages through IGFBP2‐STAT3 axis, (A) Mac‐Ps were stimulated with or without IGFBP2 (10 ng/mL) for 24 h. PD‐L1+ M2 mac‐Ps were detected by flow cytometry (n = 3), (B) ELISA detected IGFBP2 content between SS2W‐L and SS2W‐H MC38 or B16 subcutaneous tumor conditioned medium (n = 3), (C) Flow cytometry revealed that IGFBP2‐neutralizing antibody (anti‐IGFBP2, 10 mg/kg, intraperitoneal injection on day 7) blocked M2‐like polarization of intratumoral macrophages in HTB MC38 subcutaneous tumors in vivo (n = 3), (D) Flow cytometry revealed that IGFBP2‐neutralizing antibody (10 mg/kg, intraperitoneal injection on day 7) blocked M2‐like polarization of intratumoral macrophages in HTB B16 subcutaneous tumors in vivo (n = 3), (E) Mac‐Ps were preactivated by IGFBP2 for 24 h, co‐cultured with CD8+ T cells with or without anti‐PD‐L1 antibody (5 μg/mL). Flow cytometry revealed that IGFBP2‐induced mac‐Ps inhibit CD8+ T cells through PD‐1/PD‐L1 (n = 3), (F) Flow cytometry revealed that anti‐IGFBP2 injection at an early tumor age (day 7) promoted the infiltration of intratumoral CD8+ T cells when MC38 subcutaneous tumors grew into HTB (n = 3), (G) Flow cytometry revealed that anti‐IGFBP2 injection at an early tumor age (day 7) promoted the infiltration of intratumoral CD8+ T cells when B16 subcutaneous tumors grew into HTB (n = 3), (H) Flow cytometry revealed that IGFBP2 induces PD‐L1+ M2 mac‐Ps through STAT3. Mac‐Ps were stimulated with complete medium or IGFBP2 (10 ng/mL) or IGFBP2 & FLLL32 (5 μmol/L) or IGFBP2 & HJC0152 (5 μmol/L) for 24 hours. *, P < 0.05; **, P < 0.01; ***, P < 0.001. Abbreviations: LTB, low tumor burden; HTB, high tumor burden; mac‐P, peritoneal macrophage; mac‐T, tumor‐infiltrating macrophage; PD‐L1, programmed death‐ligand 1; IGFBP2, insulin‐like growth factor binding protein 2; PD‐1, programmed cell death 1; STAT3, signal transducer and activator of transcription 3.
FIGURE 8
FIGURE 8
Working model of this study, HTB‐associated macrophages promote an immunosuppressive microenvironment and restrain the efficacy of ICIs through IGFBP2‐STAT3‐PD‐L1 signaling pathway. Abbreviations: LTB, low tumor burden; HTB, high tumor burden; IGFBP2, insulin‐like growth factor binding protein 2; STAT3, signal transducer and activator of transcription 3; PD‐L1, programmed death‐ligand 1; IFNγ, interferon gamma; ICI, immune checkpoint inhibitor.

References

    1. Wang Y, Wang M, Wu HX, Xu RH. Advancing to the era of cancer immunotherapy. Cancer Commun (Lond). 2021;41(9):803–29. - PMC - PubMed
    1. Ribas A, Wolchok JD. Cancer immunotherapy using checkpoint blockade. Science. 2018;359(6382):1350–5. - PMC - PubMed
    1. Yang X, Wang B, Cao X. Transcriptional suppression of CD8(+) T cell exhaustion for improving T cell immunotherapy. Cancer Commun (Lond). 2021;41(11):1228–31. - PMC - PubMed
    1. Joseph RW, Elassaiss‐Schaap J, Kefford R, Hwu WJ, Wolchok JD, Joshua AM, et al. Baseline Tumor Size Is an Independent Prognostic Factor for Overall Survival in Patients with Melanoma Treated with Pembrolizumab. Clin Cancer Res. 2018;24(20):4960–7. - PMC - PubMed
    1. Hopkins AM, Kichenadasse G, McKinnon RA, Rowland A, Sorich MJ. Baseline tumor size and survival outcomes in lung cancer patients treated with immune checkpoint inhibitors. Semin Oncol. 2019;46(4‐5):380–4. - PubMed

Publication types

MeSH terms

Substances