

Spatiotemporal dynamics and recurrence of chikungunya virus in Brazil: an epidemiological study
- PMID: 37031687
- PMCID: PMC10281060
- DOI: 10.1016/S2666-5247(23)00033-2
Spatiotemporal dynamics and recurrence of chikungunya virus in Brazil: an epidemiological study
Abstract
Background: Chikungunya virus (CHIKV) is an Aedes mosquito-borne virus that has caused large epidemics linked to acute, chronic, and severe clinical outcomes. Currently, Brazil has the highest number of chikungunya cases in the Americas. We aimed to investigate the spatiotemporal dynamics and recurrence pattern of chikungunya in Brazil since its introduction in 2013.
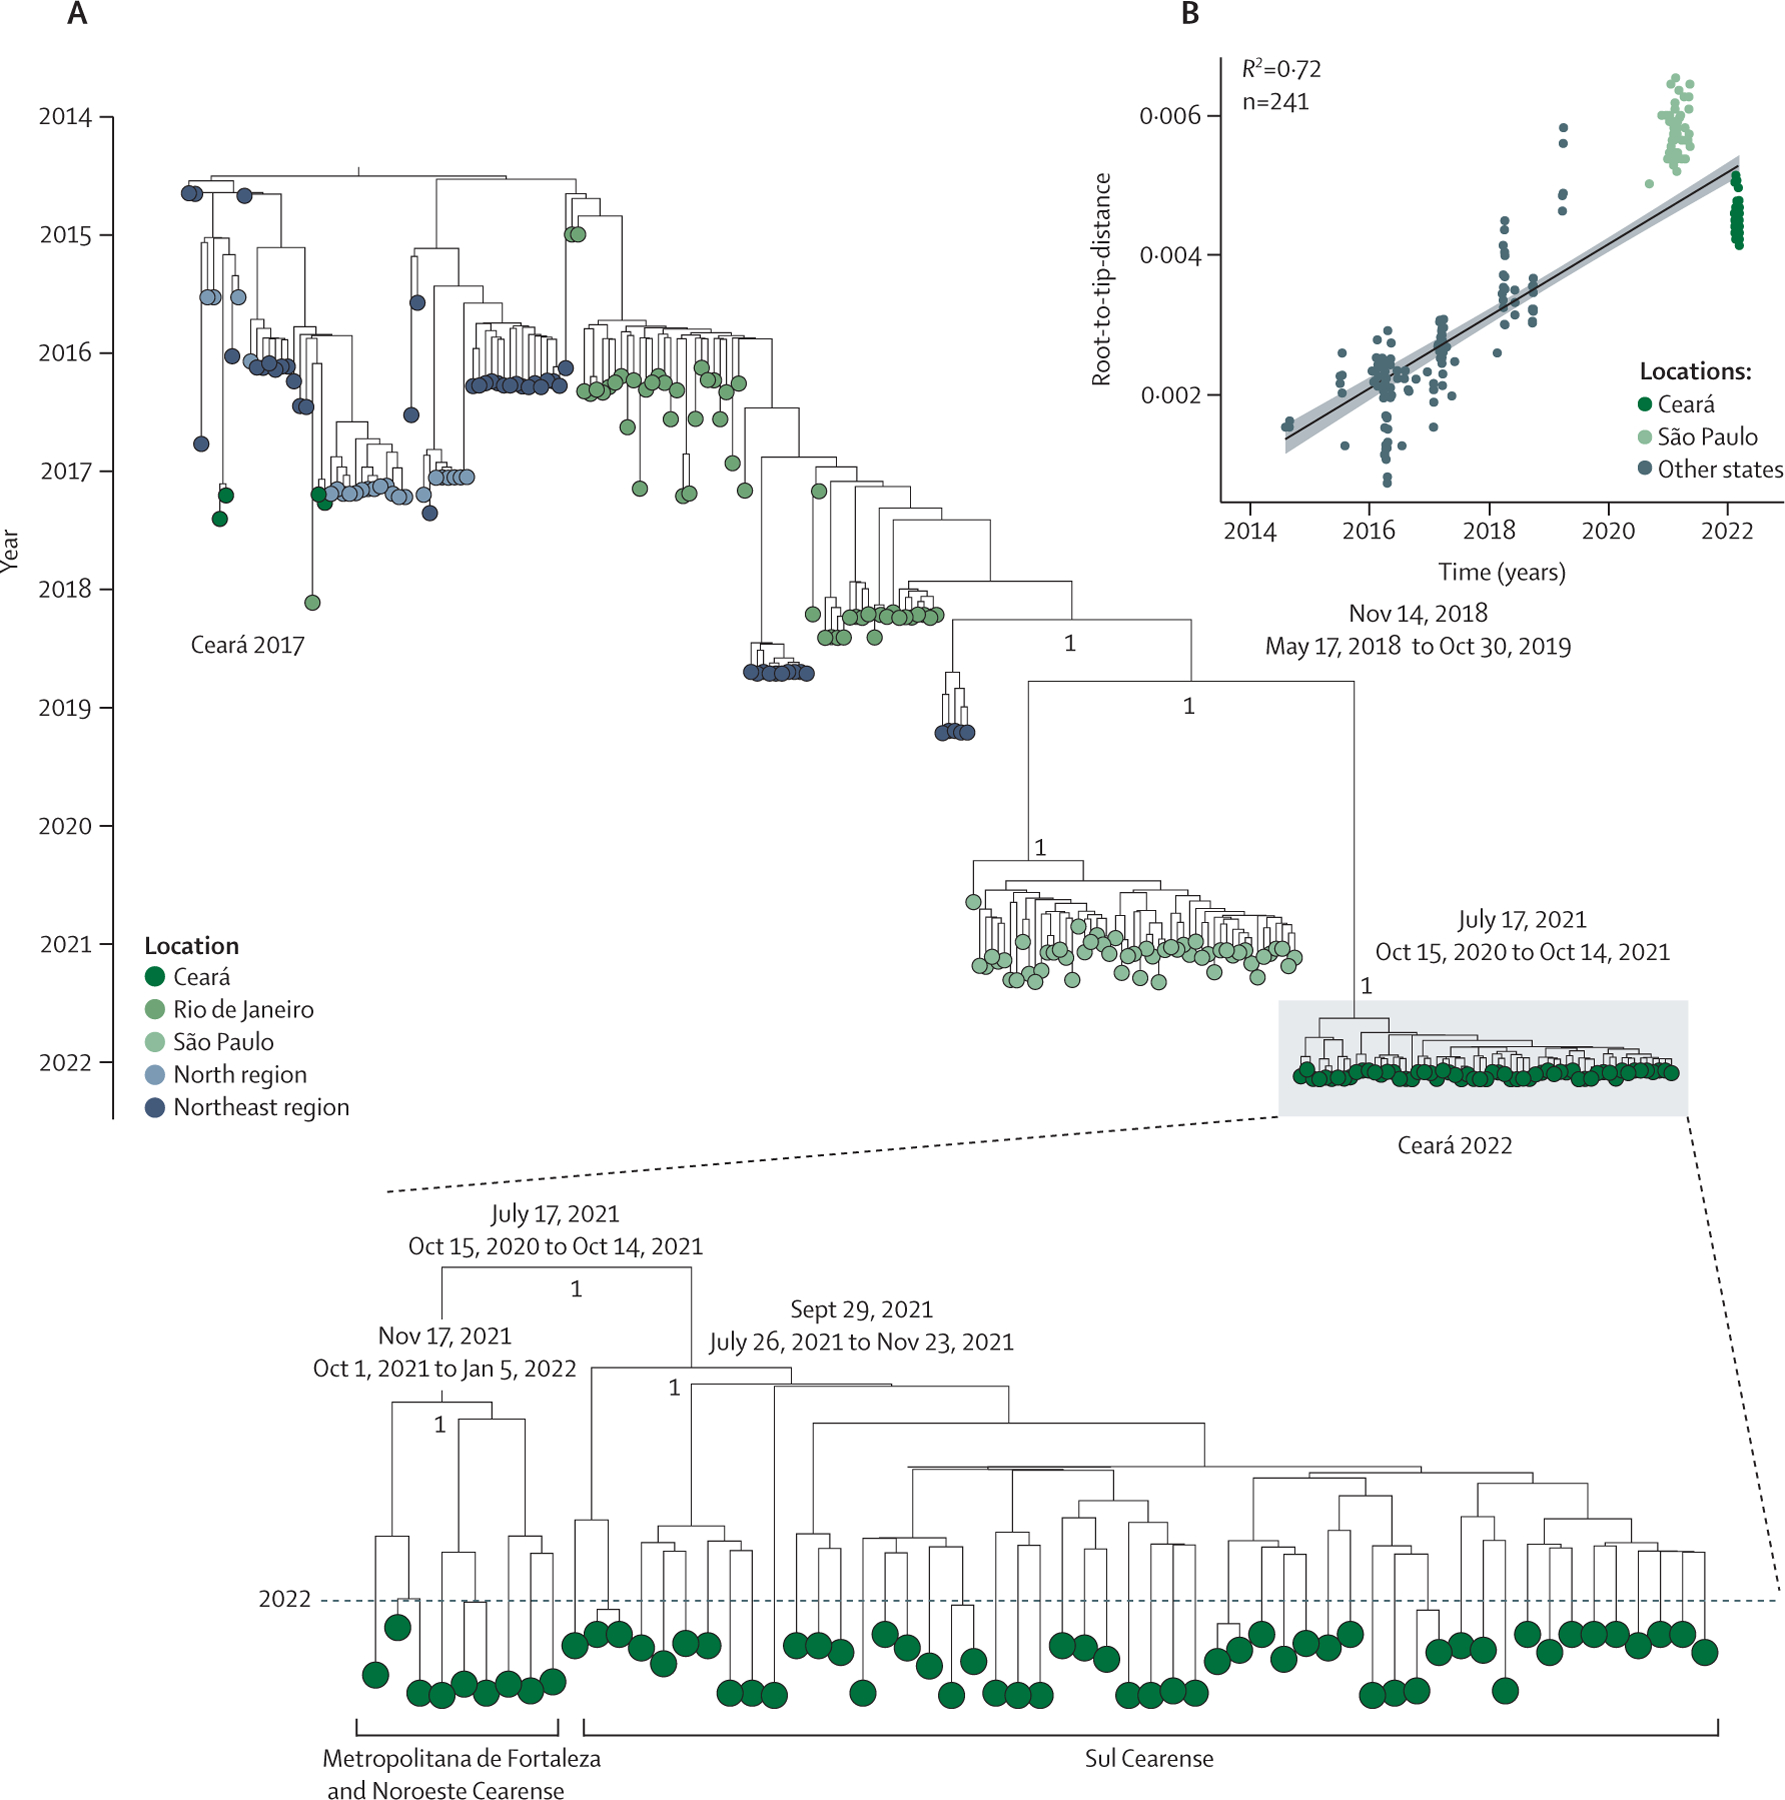
Methods: In this epidemiological study, we used CHIKV genomic sequencing data, CHIKV vector information, and aggregate clinical data on chikungunya cases from Brazil. The genomic data comprised 241 Brazilian CHIKV genome sequences from GenBank (n=180) and the 2022 CHIKV outbreak in Ceará state (n=61). The vector data (Breteau index and House index) were obtained from the Brazilian Ministry of Health for all 184 municipalities in Ceará state and 116 municipalities in Tocantins state in 2022. Epidemiological data on laboratory-confirmed cases of chikungunya between 2013 and 2022 were obtained from the Brazilian Ministry of Health and Laboratory of Public Health of Ceará. We assessed the spatiotemporal dynamics of chikungunya in Brazil via time series, mapping, age-sex distribution, cumulative case-fatality, linear correlation, logistic regression, and phylogenetic analyses.
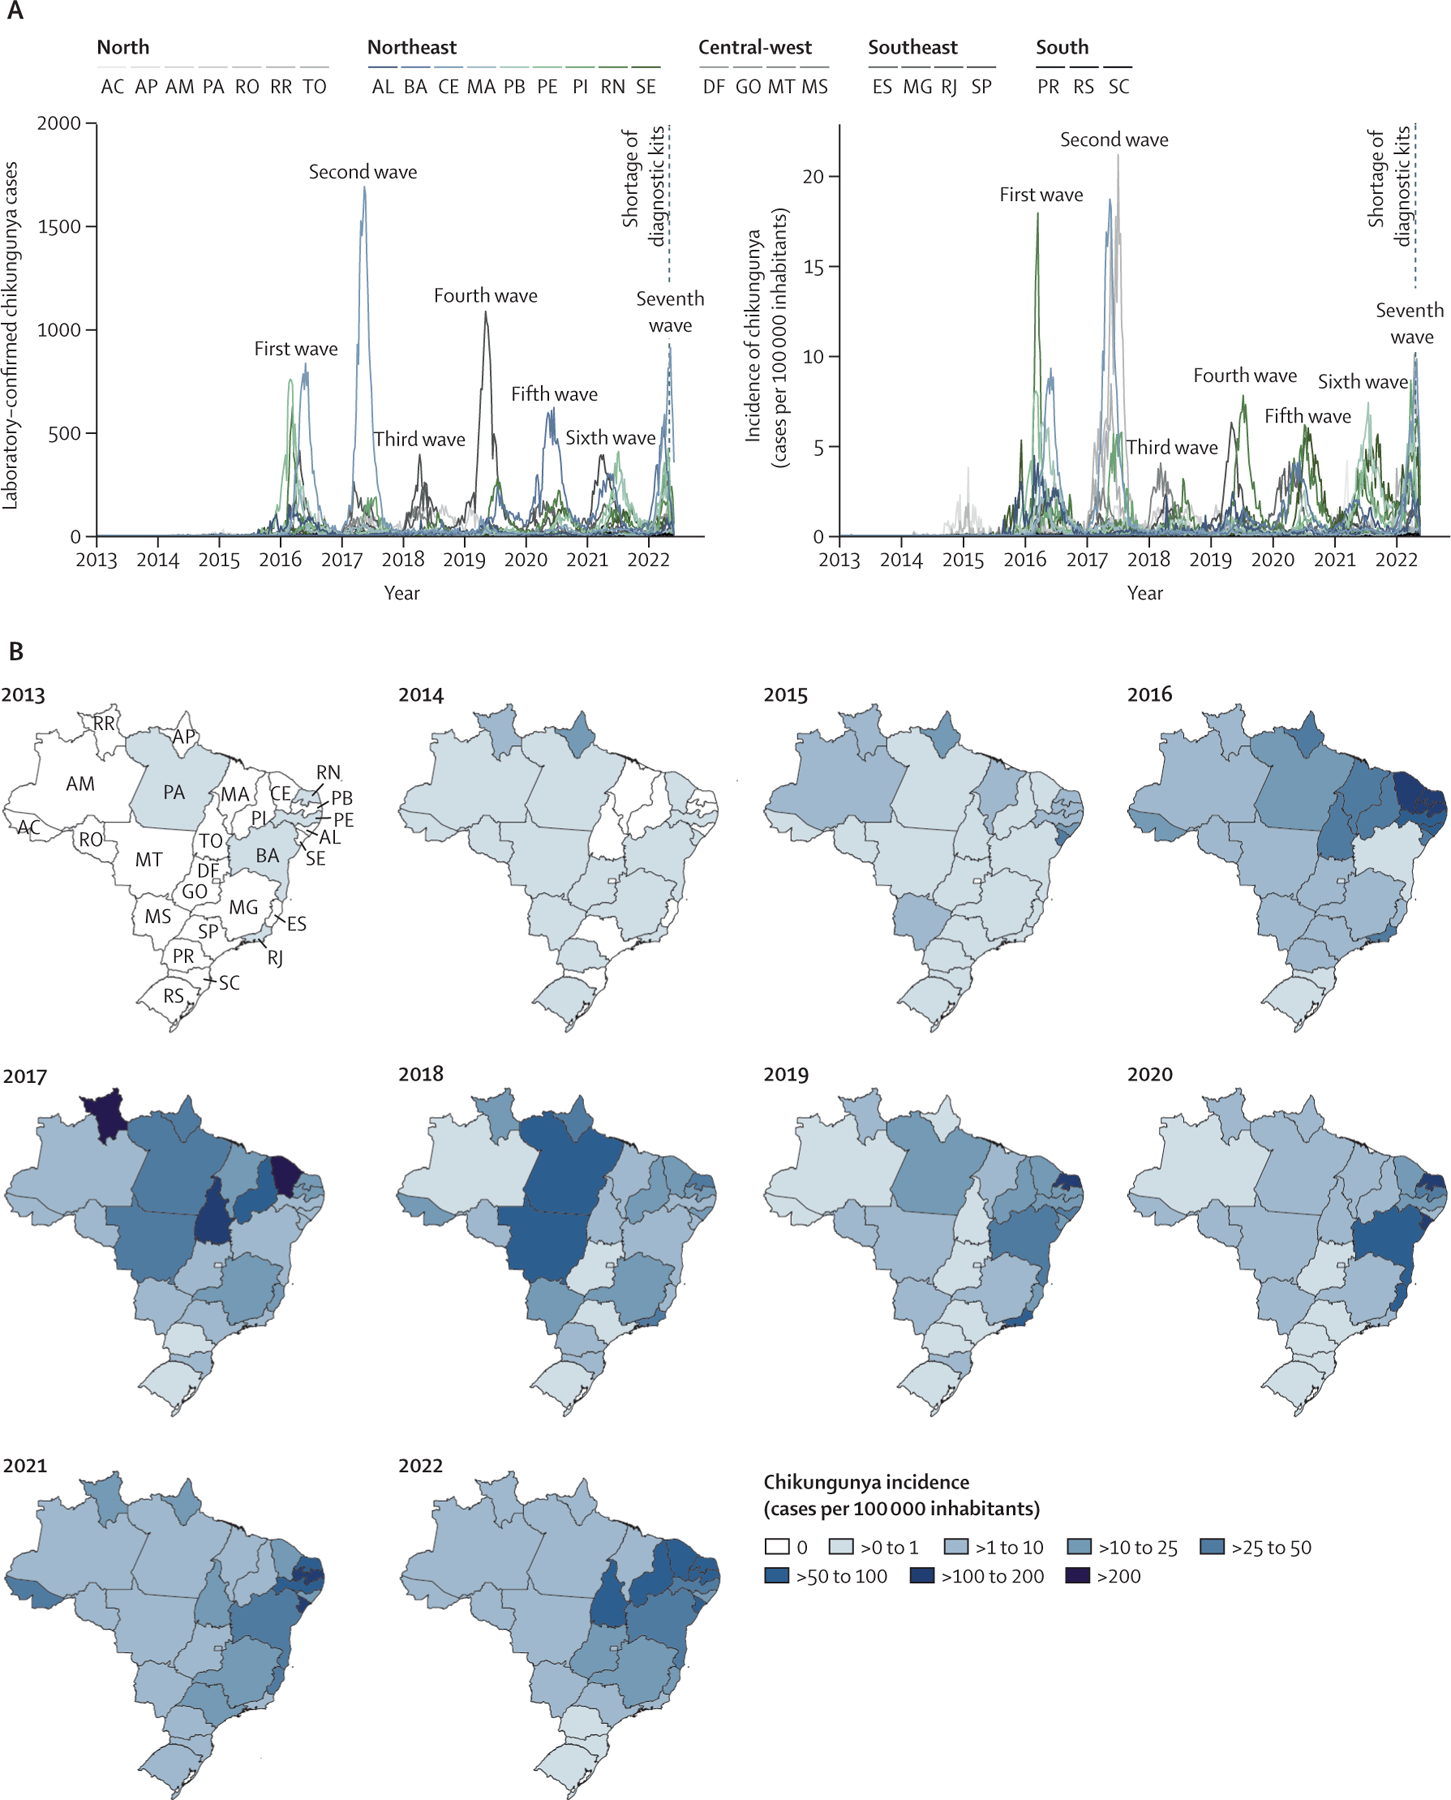
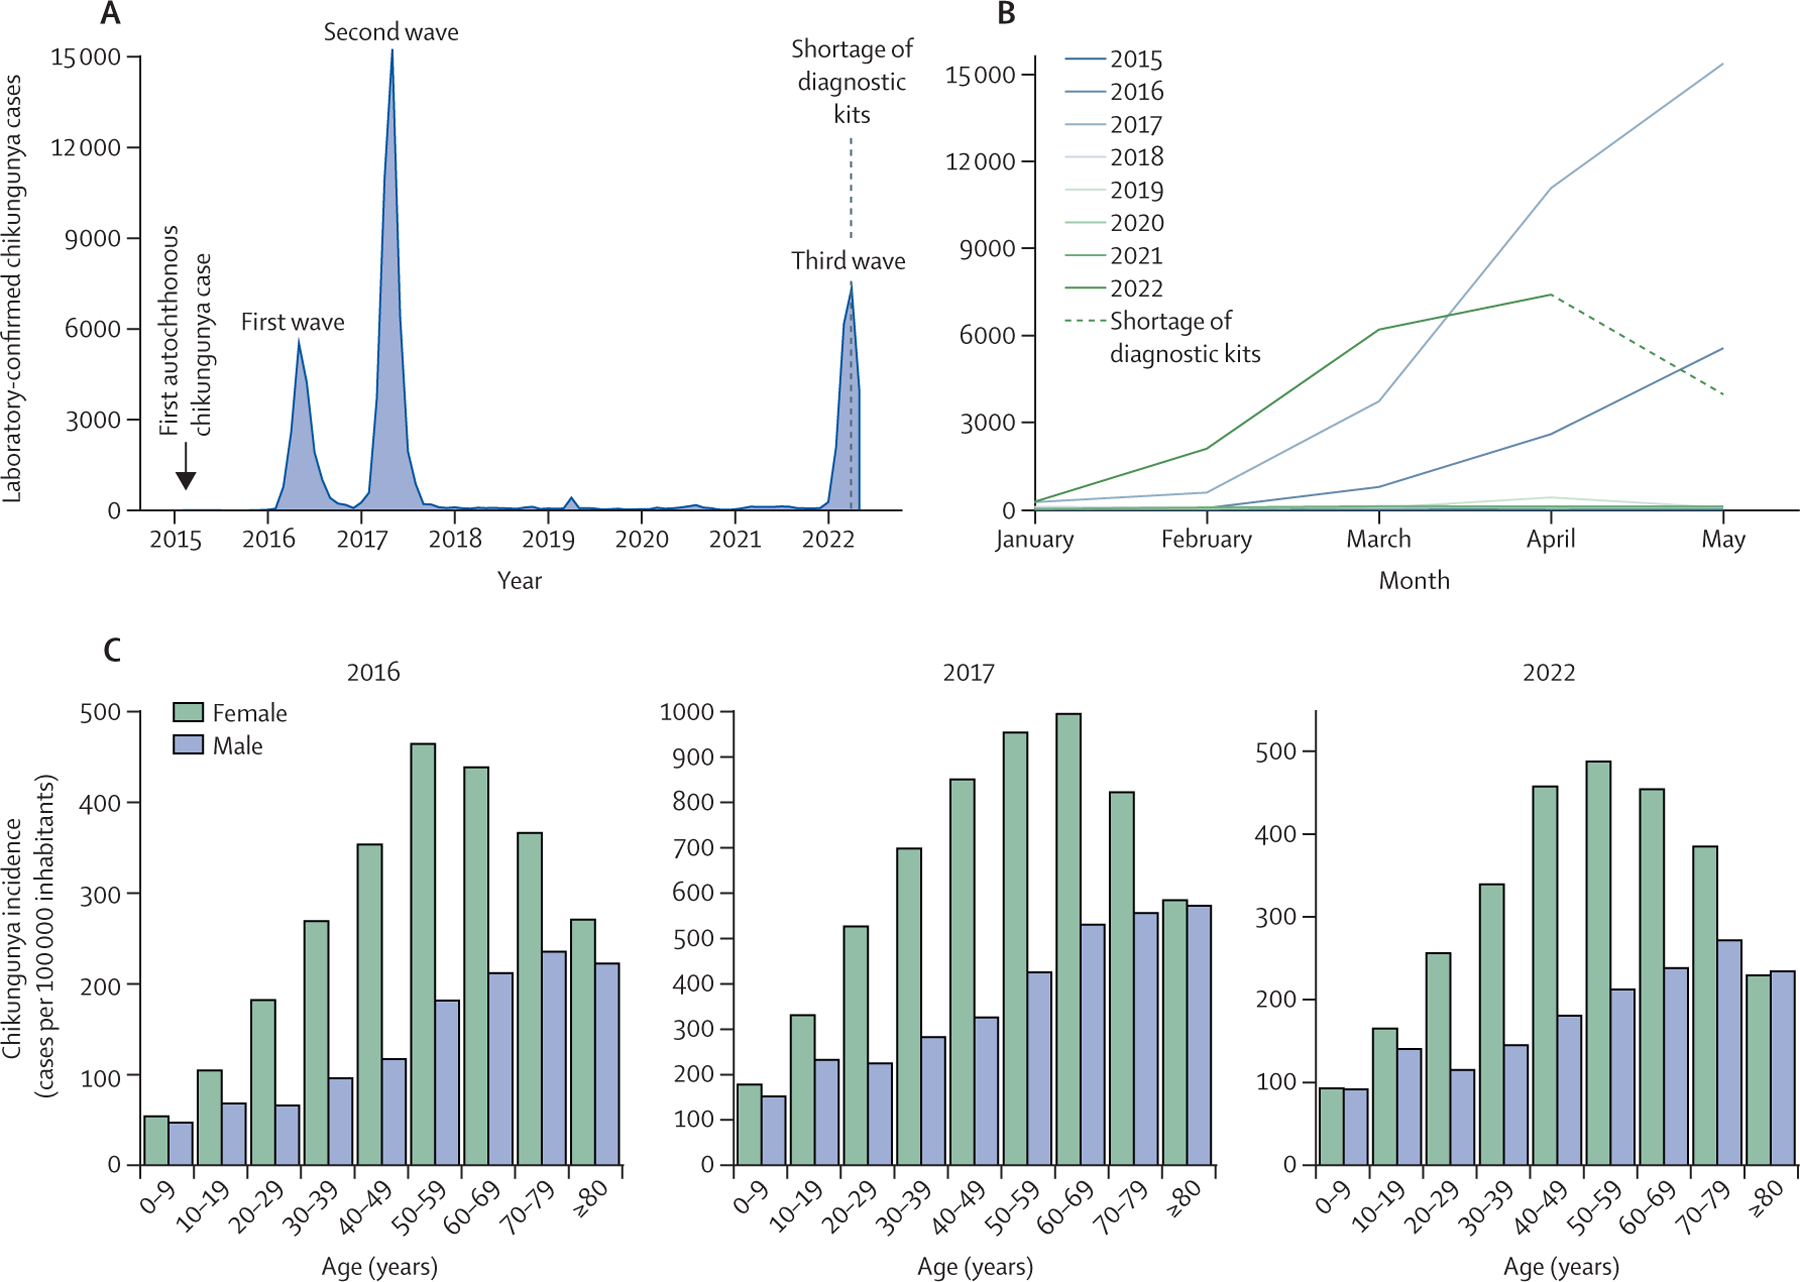
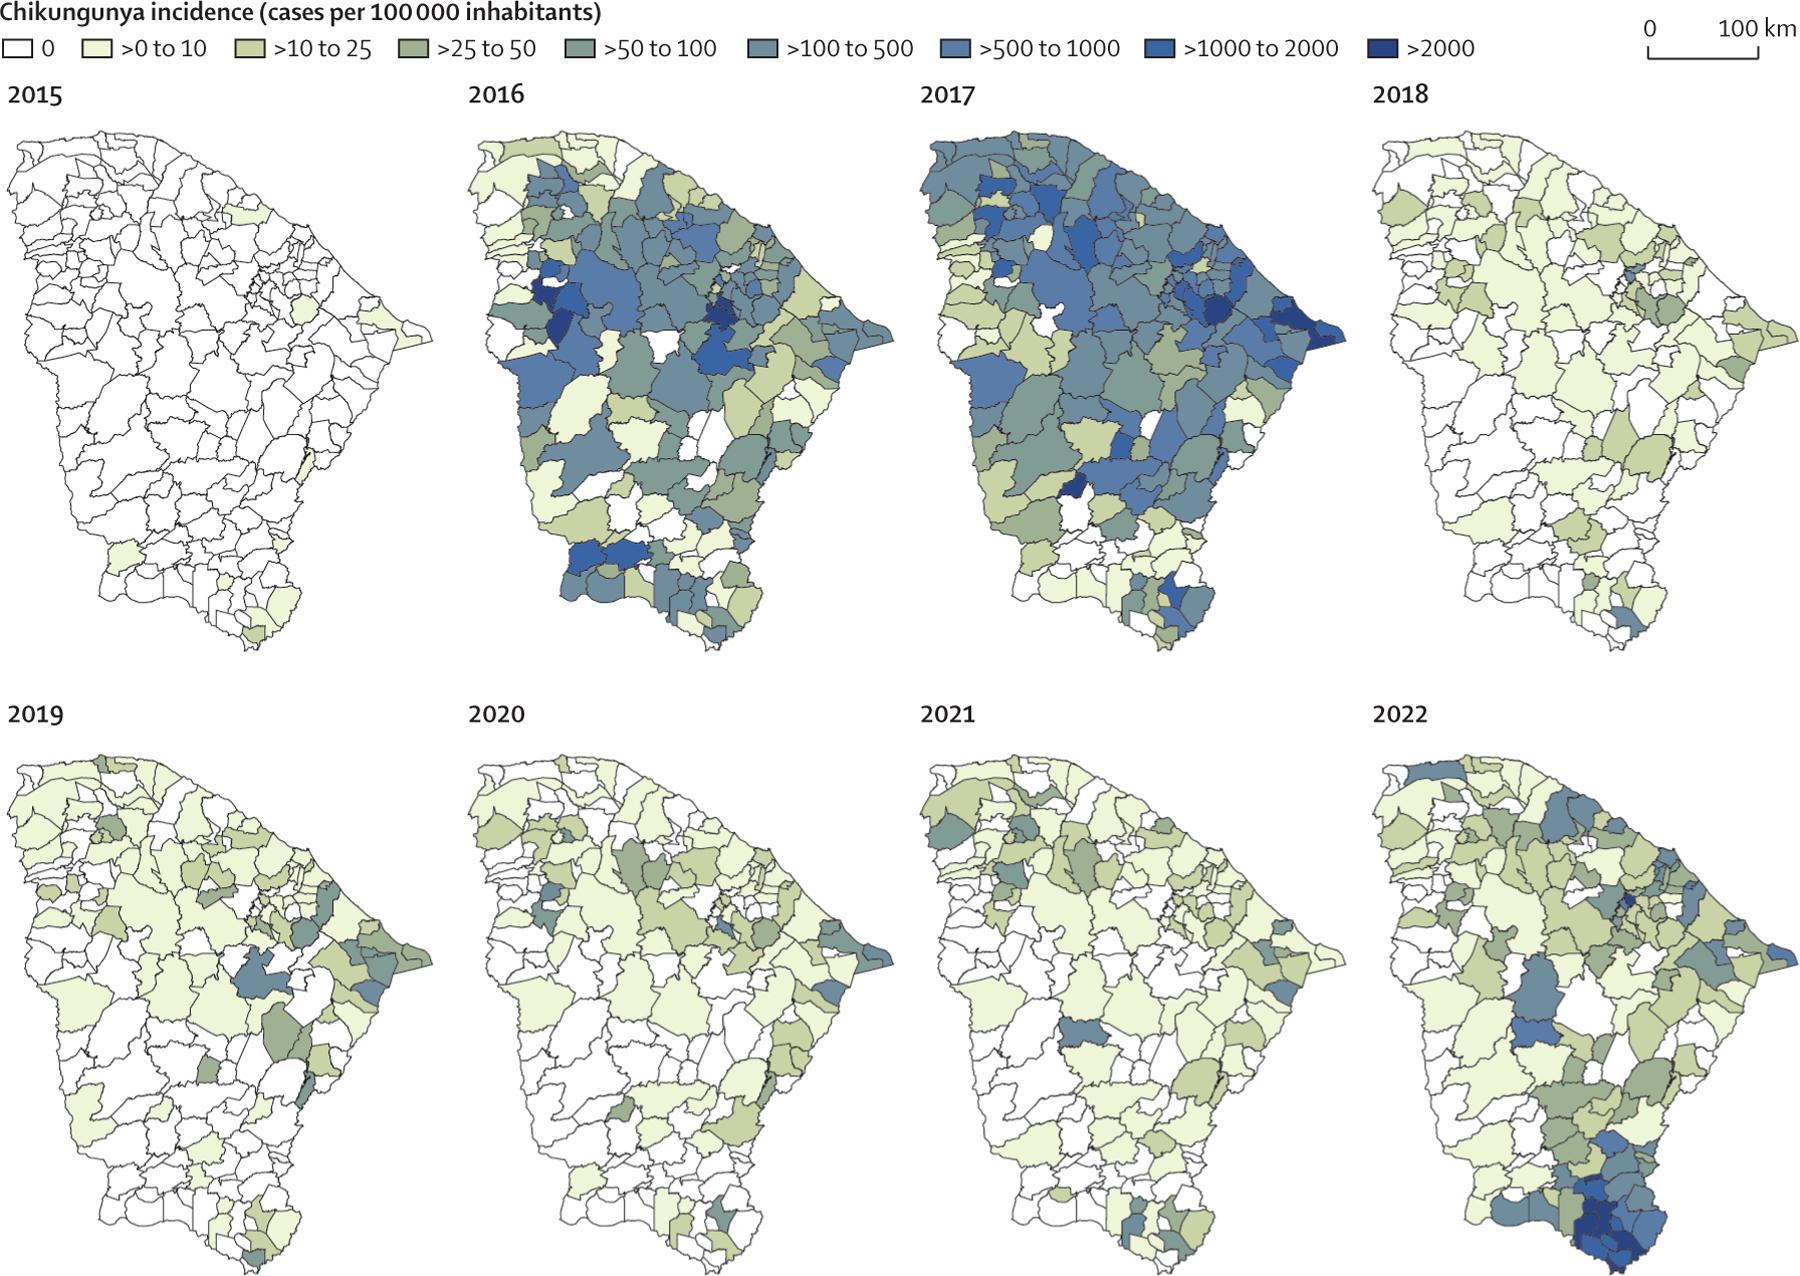
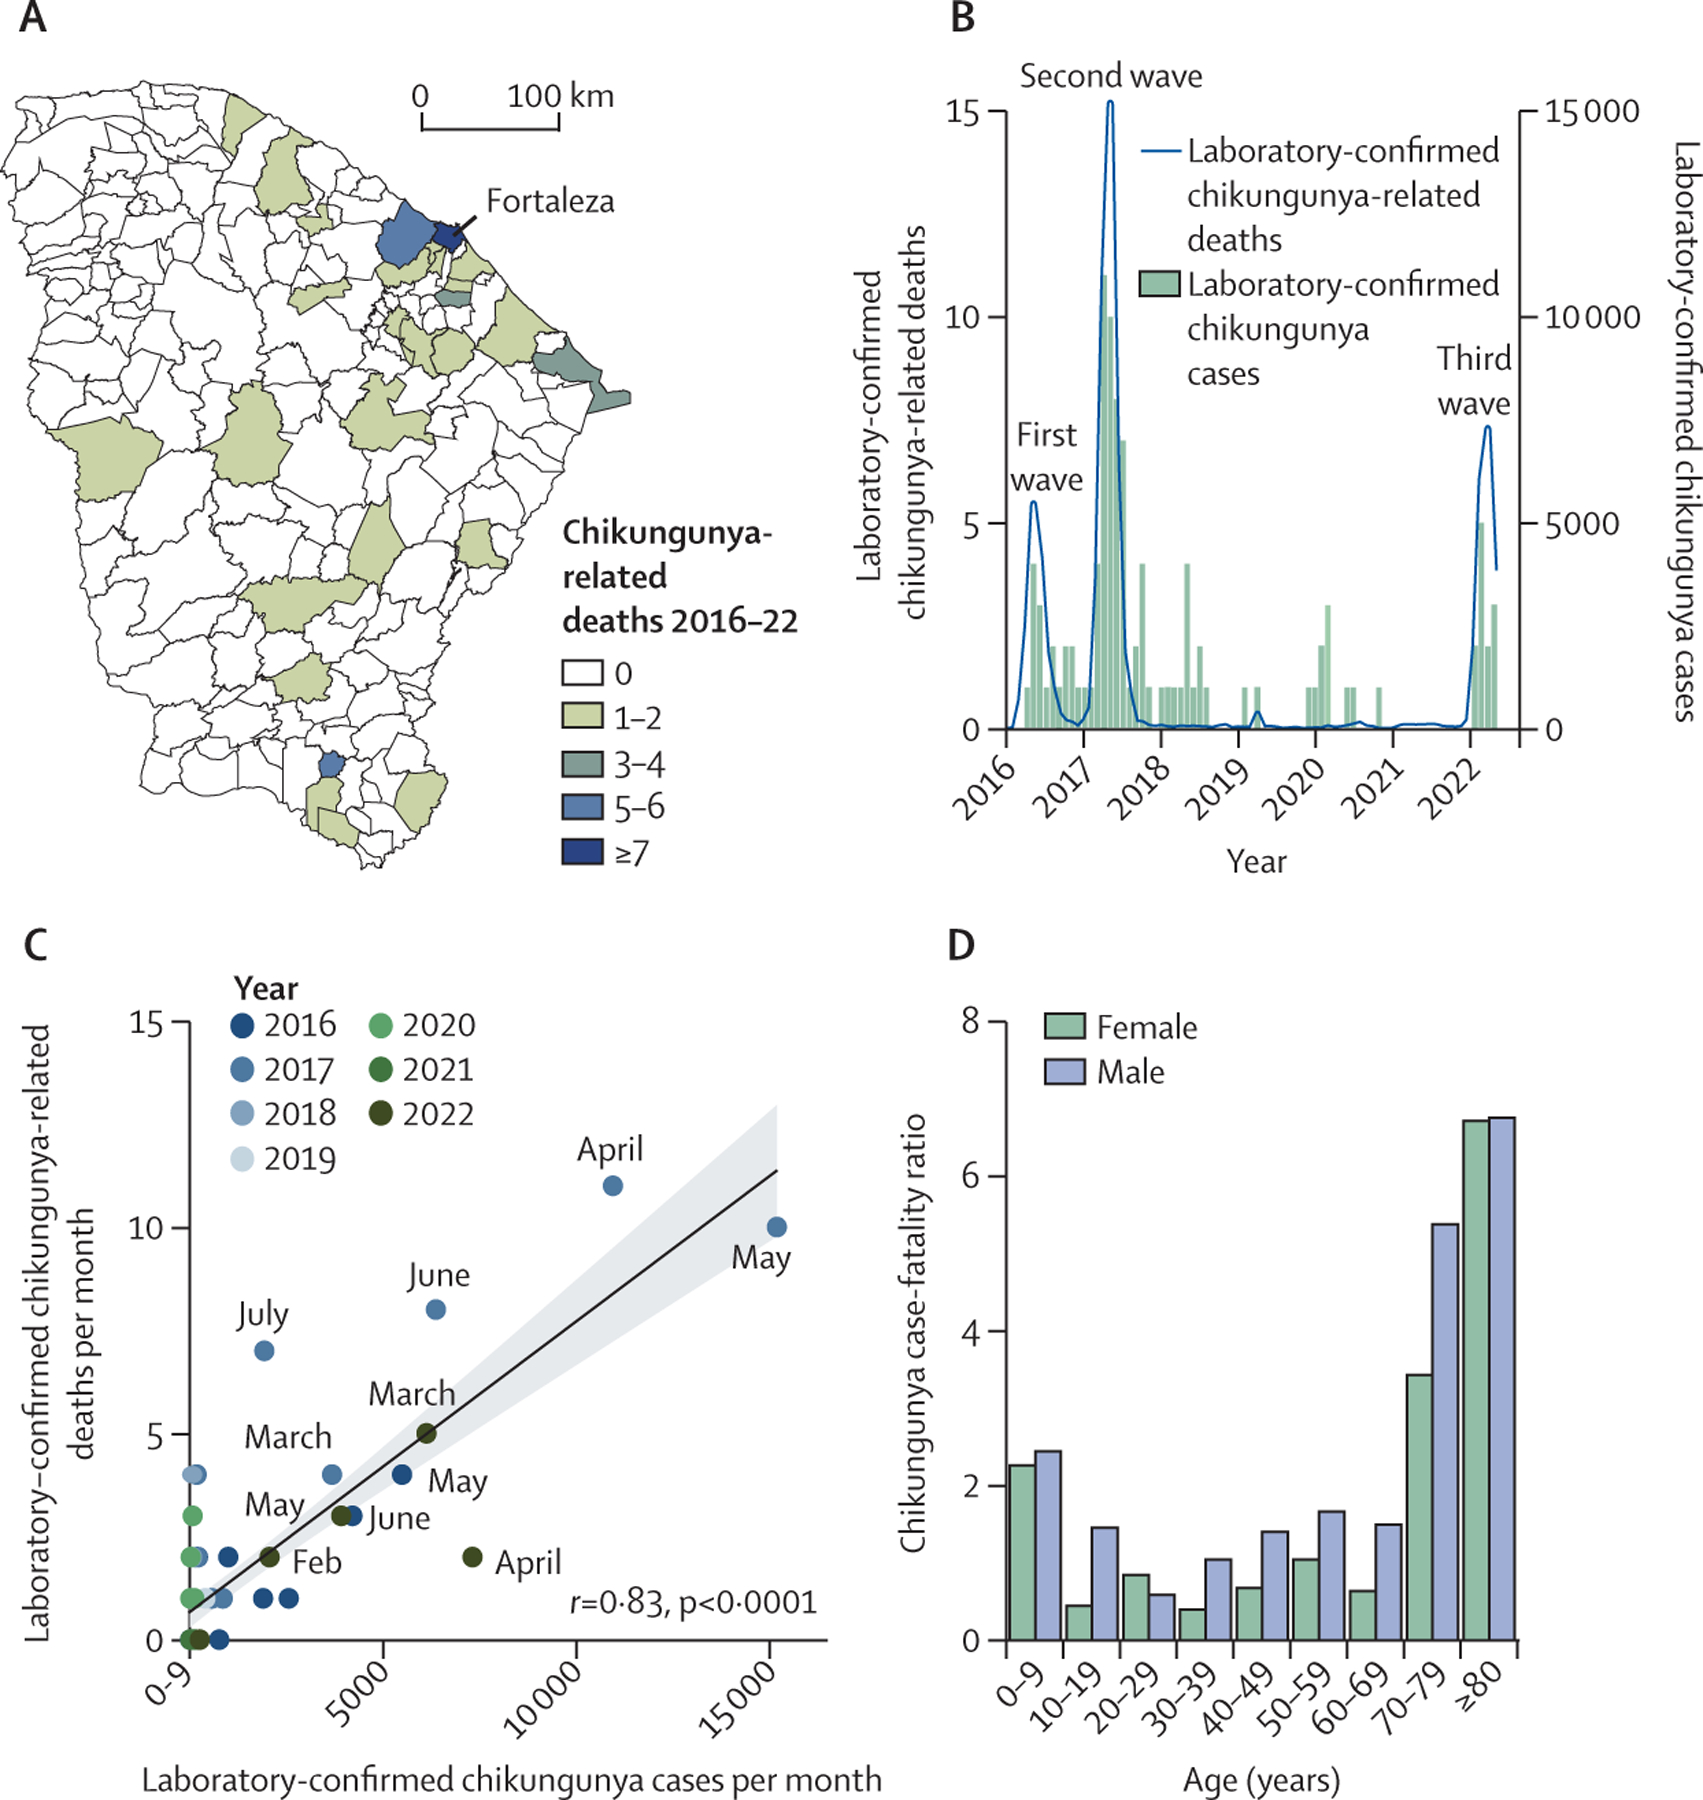
Findings: Between March 3, 2013, and June 4, 2022, 253 545 laboratory-confirmed chikungunya cases were reported in 3316 (59·5%) of 5570 municipalities, mainly distributed in seven epidemic waves from 2016 to 2022. To date, Ceará in the northeast has been the most affected state, with 77 418 cases during the two largest epidemic waves in 2016 and 2017 and the third wave in 2022. From 2016 to 2022 in Ceará, the odds of being CHIKV-positive were higher in females than in males (odds ratio 0·87, 95% CI 0·85-0·89, p<0·0001), and the cumulative case-fatality ratio was 1·3 deaths per 1000 cases. Chikungunya recurrences in the states of Ceará, Tocantins (recurrence in 2022), and Pernambuco (recurrence in 2021) were limited to municipalities with few or no previously reported cases in the previous epidemic waves. The recurrence of chikungunya in Ceará in 2022 was associated with a new East-Central-South-African lineage. Population density metrics of the main CHIKV vector in Brazil, Aedes aegypti, were not correlated spatially with locations of chikungunya recurrence in Ceará and Tocantins.
Interpretation: Spatial heterogeneity of CHIKV spread and population immunity might explain the recurrence pattern of chikungunya in Brazil. These results can be used to inform public health interventions to prevent future chikungunya epidemic waves in urban settings.
Funding: Global Virus Network, Burroughs Wellcome Fund, Wellcome Trust, US National Institutes of Health, São Paulo Research Foundation, Brazil Ministry of Education, UK Medical Research Council, Brazilian National Council for Scientific and Technological Development, and UK Royal Society.
Translation: For the Portuguese translation of the abstract see Supplementary Materials section.
Copyright © 2023 The Author(s). Published by Elsevier Ltd. This is an Open Access article under the CC BY 4.0 license. Published by Elsevier Ltd.. All rights reserved.
Conflict of interest statement
Declaration of interests We declare no competing interests.
Figures
Comment in
-
Introduction of chikungunya virus in coastal northeast Brazil.Lancet Microbe. 2023 Oct;4(10):e764. doi: 10.1016/S2666-5247(23)00176-3. Epub 2023 Jun 26. Lancet Microbe. 2023. PMID: 37385284 No abstract available.
References
Publication types
MeSH terms
Grants and funding
LinkOut - more resources
Full Text Sources
Medical
