. 2023 Jul 3;192(3):2336-2355.
doi: 10.1093/plphys/kiad205.

Modulating auxin response stabilizes tomato fruit set

Affiliations

Modulating auxin response stabilizes tomato fruit set

Alon Israeli et al. Plant Physiol. .

Erratum in

Abstract

Fruit formation depends on successful fertilization and is highly sensitive to weather fluctuations that affect pollination. Auxin promotes fruit initiation and growth following fertilization. Class A auxin response factors (Class A ARFs) repress transcription in the absence of auxin and activate transcription in its presence. Here, we explore how multiple members of the ARF family regulate fruit set and fruit growth in tomato (Solanum lycopersicum) and Arabidopsis thaliana, and test whether reduction of SlARF activity improves yield stability in fluctuating temperatures. We found that several tomato Slarf mutant combinations produced seedless parthenocarpic fruits, most notably mutants deficient in SlARF8A and SlARF8B genes. Arabidopsis Atarf8 mutants deficient in the orthologous gene had less complete parthenocarpy than did tomato Slarf8a Slarf8b mutants. Conversely, Atarf6 Atarf8 double mutants had reduced fruit growth after fertilization. AtARF6 and AtARF8 likely switch from repression to activation of fruit growth in response to a fertilization-induced auxin increase in gynoecia. Tomato plants with reduced SlARF8A and SlARF8B gene dosage had substantially higher yield than the wild type under controlled or ambient hot and cold growth conditions. In field trials, partial reduction in the SlARF8 dose increased yield under extreme temperature with minimal pleiotropic effects. The stable yield of the mutant plants resulted from a combination of early onset of fruit set, more fruit-bearing branches and more flowers setting fruits. Thus, ARF8 proteins mediate the control of fruit set, and relieving this control with Slarf8 mutations may be utilized in breeding to increase yield stability in tomato and other crops.


Conflict of interest statement

Conflict of interest statement. NO and AI are inventors in a Provisional patent application No. 63/267,407, INCREASING YIELD STABILITY IN PLANTS that includes data described in this paper.

Figures

Figure 1.
Figure 1.
Fruit phenotypes of Slarf8a Slarfb mutants. A to D) Representative photographs of cut, self-fertilized fruits of the indicated genotypes. Slarf8ab—Slarf8a Slarf8b. Individual images were digitally extracted for comparison. Scale bar: 2 cm. E) Quantification of the fruit diameter of cut, self-fertilized fruits of the indicated genotypes; n = number of fruits quantified. P-values represent differences from the wild type, as determined by the Dunnett test. Lower and upper whiskers indicate the minimum and maximum values, respectively; lower, middle, and upper horizontal lines indicate the first quartile, median, and third quartile, respectively; X indicates the mean. F) Quantification of the percentage of seed bearing (orange) and seedless (green) fruits from the indicated genotypes; n = number of fruits analyzed. G to J) Representative photographs of fruits of the indicated genotypes with or without pollination (±P, respectively), showing the fertilization-independent fruit set of Slarf8a Slarf8b (Slarf8ab). H) The senescent remains of an unpollinated wild-type flower. Individual images were digitally extracted for comparison. Scale bar: 2 cm. K) Quantification of the percentage of fruit set in the indicated genotypes and treatments. Slarf8ab—Slarf8a Slarf8b. −p, unpollinated; +p, pollinated; n = number of flowers analyzed.
Figure 2.
Figure 2.
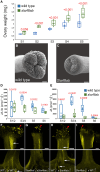
Phenotypes of Slarf8a Slarf8b)Slarf8ab) flowers. A) Ovary weight of the indicated genotypes and stages of ovary development. The flower-bud stages were classified in sequential developmental stages according to bud and gynoecia size, opening of the sepals, color of the petals, and opening of the flowers. Bars represent the Se of at least 3 biological replicates. Statistically significant differences according to the Student t-test are indicated. Scanning Electron Microscope image of the stigma from wild type B) and Slarf8a Slarf8b (Slarf8ab, C) flowers. Scale bar: 100 μm. D, E) Jasmonate levels in developing gynoecia. Gynoecia of the respective stages were extracted, and levels of jasmonic acid (JA) and JA-isoleucine (JA-Ile) were determined. Bars represent the Se of at least 3 biological replicates. Statistically significant differences according to the Student t-test are indicated. In A), D), and E), lower and upper whiskers indicate the minimum and maximum values, respectively; lower, middle, and upper horizontal lines indicate the first quartile, median, and third quartile, respectively; X indicates the mean. F to I) In vivo pollen tube growth assay. Confocal laser scanning microscope images showing pollen and pollen tubes stained by aniline blue in the gynoecia of the indicated genotypes. Each pollination was repeated with 5 to 6 flowers, all showing the same result. Red arrowheads indicate pollen grains on the stigma, white arrows show staining of callose indicative for pollen tubes within the style. The female parent is listed first in the crosses. Note that pollen tube growth was detectable in WT ovaries only. Scale bar: 100 µm.
Figure 3.
Figure 3.
Fruits of Arabidopsis Atarf6 and Atarf8 mutant combinations. A) Fruit appearance 11 d after emasculation of flowers of indicated genotypes. B) Fruit lengths (blue) and widths (green) of the indicated genotypes; n = number of plants quantified. Letters above data indicate statistically distinguishable classes by Tukey–Kramer multiple comparison statistical test, P < 0.05. Length and width data were analyzed separately, and statistical groups are indicated by uppercase letters for length data and lowercase letters for width data. Supplemental Table S2 shows data from a separate experiment with a larger set of genotypes. Lower and upper whiskers indicate the minimum and maximum values, respectively; lower, middle, and upper horizontal lines indicate the first quartile, median, and third quartile, respectively; X indicates the mean. C, D) Unpollinated arf6-2 arf8-3 fruits without emasculation. The gynoecium was not pollinated because arf6-2 arf8-3 mutant stamen filaments are short and the anthers are indehiscent. Shown is the same fruit before C) and after D) manually removing the outer organs of the 14th flower down from the youngest open flower. E) Wild-type mature fruit about 2.5 wk after natural self-pollination, opened gently to reveal seeds. F, G)  arf6-2 arf8-3 mature fruit 17 d after manual pollination with wild-type pollen. The same fruit is shown before F) and after G) opening to reveal seeds. Fruit length H) or width I) versus seed number for wild-type and arf6-2 arf8-3 mutants. Scale bar: 1 mm A, C, D, F, G) or 2 mm E). Additional genotypes and statistical analysis of the data in H) and I) are presented in Supplemental Fig. S8 and Tables S2, S3.
Figure 4.
Figure 4.
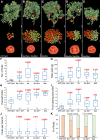
Effect of mutations in Slarf8 genes on yield of plants grown in controlled hot conditions. Plants were grown in a controlled greenhouse under 34 °C day/28 °C night temperatures. A to E) Mature plants at the end of the experiment, fruits of a single representative plant and a representative cut fruit from plants of each of the indicated genotypes. Individual images were digitally extracted for comparison. Scale bar: 10 cm (whole plants), 2 cm (fruits). Quantification of the total number of fruits F), total yield in grams G), harvest index: total yield/plant weight H), number of fruit-bearing branches per plant I), and the number of fruits per fruit-bearing branch J) in the indicated genotypes; n = number of quantified plants or inflorescences. P-values represent differences from the wild type, as determined by the Dunnett test. Lower and upper whiskers indicate the minimum and maximum values, respectively; lower, middle, and upper horizontal lines indicate the first quartile, median, and third quartile, respectively; X indicates the mean. K) Quantification of the percentage of natural parthenocarpy of fruits from the indicated genotypes. The orange color represents fruits with seeds and the green color represents parthenocarpic, seedless fruits; n = number of fruits analyzed. Genotypes are abbreviated as follows: 8a—Slarf8a; 8a 8b/+—Slarf8a Slarf8b/+; 8ab—Slarf8a Slarf8b.
Figure 5.
Figure 5.
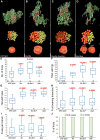
Effect of mutations in Slarf8 genes on yield of plants grown in controlled cold conditions. Plants were grown in a controlled greenhouse under 16 °C day/10 °C night temperatures. A to D) Mature plants at the end of the experiment, fruits of a single representative plant, and a representative cut fruits from the indicated genotypes. Individual images were digitally extracted for comparison. Scale bar: 10 cm (whole plants), 2 cm (fruits). Quantification of the total number of fruits E), total yield in grams F), harvest index: total yield/plant weight G), number of fruit-bearing branches per plant H), and the number of fruits per fruit-bearing branch I) in the indicated genotypes; n = number of plants or inflorescences quantified. P-values represent differences from the wild type, as determined by the Dunnett test. Lower and upper whiskers indicate the minimum and maximum values, respectively; lower, middle, and upper horizontal lines indicate the first quartile, median, and third quartile, respectively; X indicates the mean. J) Quantification of the percentage of natural parthenocarpy in the indicated genotypes. The orange color represents fruits with seeds, and the green color represents parthenocarpic, seedless fruits; n = number of fruits quantified. Genotype abbreviation is as in Fig. 4.
Figure 6.
Figure 6.
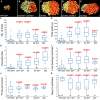
Effect of mutations in Slarf8 genes on yield of plants grown in ambient heat-stress conditions. Plants were grown in a net-house in the soil in the summer under field conditions, with no temperature control, during which they experienced several hours of temperature above 40 °C every day for several weeks. A to E) Fruits of a single representative plant of the indicated genotypes. Individual images were digitally extracted for comparison. Scale bar: 2 cm. Quantification of the total number of fruits F), total yield in grams G), harvest index: total yield/plant weight H), number of fruit-bearing branches per plant I), number of fruits per fruit-bearing branch J), and days to anthesis of the first flower K) in the indicated genotypes; n = number of plants or inflorescences quantified. P-values represent differences from the wild type, as determined by the Dunnett test. Lower and upper whiskers indicate the minimum and maximum values, respectively; lower, middle, and upper horizontal lines indicate the first quartile, median, and third quartile, respectively; X indicates the mean. Genotype abbreviation is as in Fig. 4.
Figure 7.
Figure 7.
Increased and earlier fruit set in Slarf8 mutants. Number of flowers per inflorescence A) and number of fruits on the same inflorescences B) of the indicated genotypes; n = number of inflorescences quantified. P-values represent differences from the wild type, as determined by the Dunnett test. Quantification of the total number of fruits per plant in the indicated genotypes and time points under heat conditions in the controlled heat C) and controlled cold D) experiments. Number of plants for each genotype (n = C, D): wild type: 17, 7 to 14; Slarf8a/+ Slarf8b/+: 9; Slarf8a: 8, Slarf8a 8b/+: 14, 4 to 12; and Slarf8ab: 11, 6 to 19. P-values indicate differences from the wild type, as determined by the Dunnett test. Lower and upper whiskers indicate the minimum and maximum values, respectively; lower, middle, and upper horizontal lines indicate the first quartile, median, and third quartile, respectively; X indicates the mean.

References

    1. Abad M, Monteiro AA. The use of auxins for the production of greenhouse tomatoes in mild-winter conditions: a review. Sci Hortic. 1989:38(3–4):167–192. 10.1016/0304-4238(89)90064-2 - DOI
    1. Acciarri N, Restaino F, Vitelli G, Perrone D, Zottini M, Pandolfini T, Spena A, Rotino G. Genetically modified parthenocarpic eggplants: improved fruit productivity under both greenhouse and open field cultivation. BMC Biotechnol. 2002:2(1):1–7. 10.1186/1472-6750-2-4 - DOI - PMC - PubMed
    1. Alsamir M, Mahmood T, Trethowan R, Ahmad N. An overview of heat stress in tomato (Solanum lycopersicum L.). Saudi J Biol Sci. 2021:28(3):1654–1663. 10.1016/j.sjbs.2020.11.088 - DOI - PMC - PubMed
    1. Andersen SU, Buechel S, Zhao Z, Ljung K, Novák O, Busch W, Schuster C, Lohmanna JU. Requirement of B2-type cyclin-dependent kinases for meristem integrity in Arabidopsis thaliana. Plant Cell. 2008:20(1):88–100. 10.1105/tpc.107.054676 - DOI - PMC - PubMed
    1. Ariizumi T, Shinozaki Y, Ezura H. Genes that influence yield in tomato. Breed Sci. 2013:63(1):3–13. 10.1270/jsbbs.63.3 - DOI - PMC - PubMed

Publication types

MeSH terms

LinkOut - more resources