. 2023 Dec;43(12):2527-2548.
doi: 10.1111/risa.14138. Epub 2023 Apr 9.

Source attribution of campylobacteriosis in Australia, 2017-2019

Affiliations

Source attribution of campylobacteriosis in Australia, 2017-2019

Angus McLure et al. Risk Anal. 2023 Dec.

Abstract

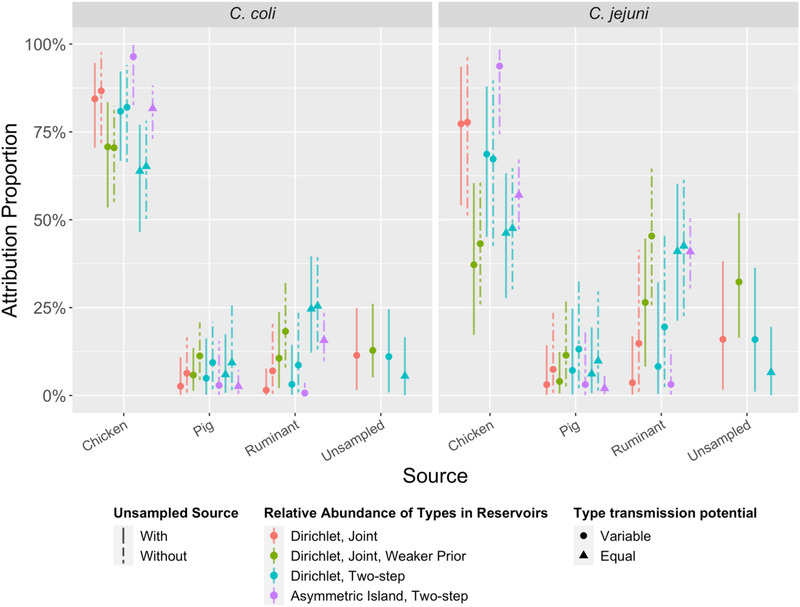
Campylobacter jejuni and Campylobacter coli infections are the leading cause of foodborne gastroenteritis in high-income countries. Campylobacter colonizes a variety of warm-blooded hosts that are reservoirs for human campylobacteriosis. The proportions of Australian cases attributable to different animal reservoirs are unknown but can be estimated by comparing the frequency of different sequence types in cases and reservoirs. Campylobacter isolates were obtained from notified human cases and raw meat and offal from the major livestock in Australia between 2017 and 2019. Isolates were typed using multi-locus sequence genotyping. We used Bayesian source attribution models including the asymmetric island model, the modified Hald model, and their generalizations. Some models included an "unsampled" source to estimate the proportion of cases attributable to wild, feral, or domestic animal reservoirs not sampled in our study. Model fits were compared using the Watanabe-Akaike information criterion. We included 612 food and 710 human case isolates. The best fitting models attributed >80% of Campylobacter cases to chickens, with a greater proportion of C. coli (>84%) than C. jejuni (>77%). The best fitting model that included an unsampled source attributed 14% (95% credible interval [CrI]: 0.3%-32%) to the unsampled source and only 2% to ruminants (95% CrI: 0.3%-12%) and 2% to pigs (95% CrI: 0.2%-11%) The best fitting model that did not include an unsampled source attributed 12% to ruminants (95% CrI: 1.3%-33%) and 6% to pigs (95% CrI: 1.1%-19%). Chickens were the leading source of human Campylobacter infections in Australia in 2017-2019 and should remain the focus of interventions to reduce burden.

Keywords: Bayesian analysis; Campylobacter; source attribution.


Figures

FIGURE 1
FIGURE 1
Source attribution proportions of C. jejuni and C. coli cases to three sampled sources (chicken, pig, and ruminant) in 10 models (M1–M10, left to right). Four models (M1, M3, M5, M8) also include a fourth, “unsampled source.” The asymmetric island model is intrinsically unable to accommodate an unsampled source. See Table 1 for the list of assumptions for each model.
FIGURE 2
FIGURE 2
Posterior median and 95% credible intervals for type transmission potential (relative ability of a sequence type to transmit from a source and lead to a reported campylobacteriosis case) of the 15 most common C. coli and C. jejuni multi‐locus sequence types (STs) in human cases for four models. STs have been ordered by posterior median type transmission potential in model M1. Note the x‐axis is on a log scale, with wider limits for M7 (asymmetric island model). See Table 1 for details of the four models.
FIGURE A1
FIGURE A1
Venn diagram summarizing the number of multi‐locus sequence types (STs) found in cases and sources, or combinations of cases and sources. For instance, 66 STs were found only in cases, 26 STs were found in chicken and cases but not in pigs or ruminants, and 8 STs (representing 32% [423/1322] of study isolates) were found in cases and all sources.
FIGURE A2
FIGURE A2
Source attribution proportions of four selected multi‐locus sequence types (STs) to three sampled sources in 10 models (M1–M10, left to right). Four models (M1, M3, M5, and M8) also include a fourth, “unsampled source.” See Table 1 for more details about the models. ST50 (C. jejuni) was the most observed type in cases, ruminants, and pigs and the fifth most common type in chickens. ST48 (C. jejuni) was fourth most common type in humans, but rare or absent in all sources. ST827 (C. coli) was the second most common type in chickens, and found in the other sources, but relatively uncommon in cases. ST2398 (C. jejuni) was more common in cases than ST827, but not detected in any sources. Estimates of relative abundance of these types in the respective sources can be found in Tables A3 and A4. Estimates of the transmission potential of the four types can be found in Table A6.
FIGURE A3
FIGURE A3
Percent difference in source attribution proportions between urban and rural populations (urban cases as references) for eight models (M1, M2, M5–M10). See Table 1 for model details. Vertical bars are 95% credible intervals (CrI). Note that all CrIs include 0% (no difference).
FIGURE A4
FIGURE A4
The observed proportion of cases due to the five most common multi‐locus sequence types (STs) from C. coli and C. jejuni (black horizontal lines) compared to predictions (colored points and vertical 95% credible intervals) under 10 source attribution models (M1–M10, left to right). Note that for some STs, the credible intervals for M10 (asymmetric island model) are so narrow that they are not visible.
FIGURE A5
FIGURE A5
Estimates of relative attributable proportion (RAP) of campylobacteriosis under 10 source attribution models (M1–M10, left to right). RAP was calculated by dividing attribution proportion by the annual Australian consumption of meat products derived from that source and normalized against a reference source (chicken). All models indicated pig meat poses less risk (lower RAP) than chicken. Note the y‐axis is on a log scale, and that the “unsampled source” is omitted due to lack of respective consumption statistics or appropriate equivalent exposure measure.

References

    1. Australian Bureau of Agricultural and Resource Economics and Sciences . (2020). Agricultural commodity statistics. https://www.agriculture.gov.au/abares/research‐topics/agricultural‐outlo...
    1. Bolton, D. J. (2015). Campylobacter virulence and survival factors. Food Microbiology, 48, 99–108. - PubMed
    1. Boysen, L. , Rosenquist, H. , Larsson, J. T. , Nielsen, E. M. , Sørensen, G. , Nordentoft, S. , & Hald, T. (2014). Source attribution of human campylobacteriosis in Denmark. Epidemiology and Infection, 142(8), 1599–1608. 10.1017/s0950268813002719 - DOI - PMC - PubMed
    1. Clark, K. , Karsch‐Mizrachi, I. , Lipman, D. J. , Ostell, J. , & Sayers, E. W. (2016). GenBank. Nucleic Acids Research, 44(D1), D67–D72. 10.1093/nar/gkv1276 - DOI - PMC - PubMed
    1. Cribb, D. M. , Varrone, L. , Wallace, R. L. , Mclure, A. T. , Smith, J. J. , Stafford, R. J. , Bulach, D. M. , Selvey, L. A. , Firestone, S. M. , French, N. P. , Valcanis, M. , Fearnley, E. J. , Sloan‐Gardner, T. , Graham, T. , Glass, K. , & Kirk, M. D. (2022). Risk factors for campylobacteriosis in Australia: Outcomes of a 2018–2019 case‐control study. 10.21203/rs.3.rs-1387051/v1 - DOI - PMC - PubMed