. 2023 Apr 9;20(1):92.
doi: 10.1186/s12974-023-02769-y.

Pharmacological modulation of TSPO in microglia/macrophages and neurons in a chronic neurodegenerative model of prion disease

Collaborators, Affiliations

Pharmacological modulation of TSPO in microglia/macrophages and neurons in a chronic neurodegenerative model of prion disease

Marta Vicente-Rodríguez et al. J Neuroinflammation. .

Abstract

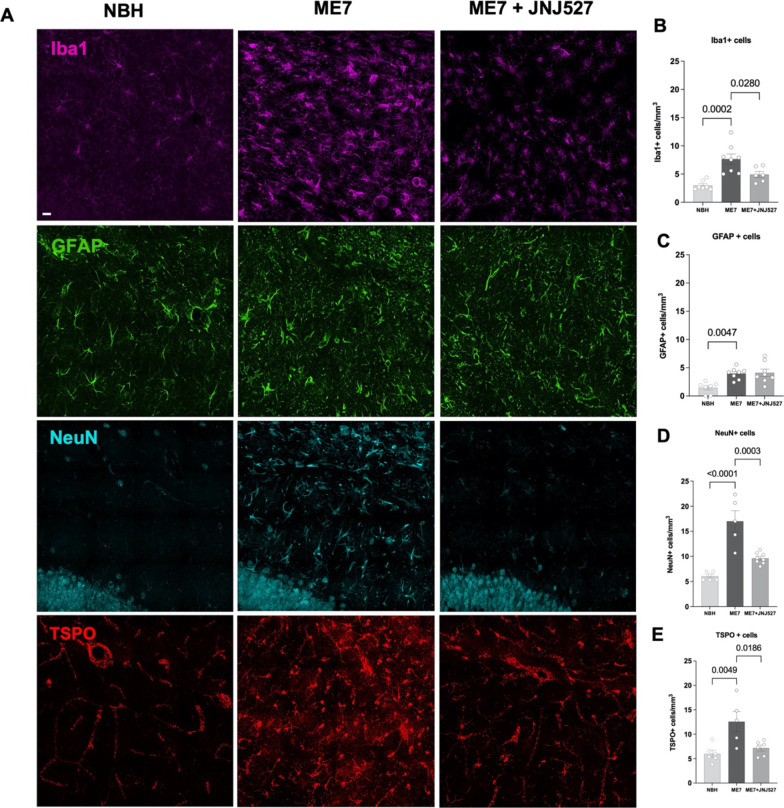
Neuroinflammation is an important component of many neurodegenerative diseases, whether as a primary cause or a secondary outcome. For that reason, either as diagnostic tools or to monitor progression and/or pharmacological interventions, there is a need for robust biomarkers of neuroinflammation in the brain. Mitochondrial TSPO (18 kDa Translocator protein) is one of few available biomarkers of neuroinflammation for which there are clinically available PET imaging agents. In this study, we further characterised neuroinflammation in a mouse model of prion-induced chronic neurodegeneration (ME7) including a pharmacological intervention via a CSF1R inhibitor. This was achieved by autoradiographic binding of the second-generation TSPO tracer, [3H]PBR28, along with a more comprehensive examination of the cellular contributors to the TSPO signal changes by immunohistochemistry. We observed regional increases of TSPO in the ME7 mouse brains, particularly in the hippocampus, cortex and thalamus. This increased TSPO signal was detected in the cells of microglia/macrophage lineage as well as in astrocytes, endothelial cells and neurons. Importantly, we show that the selective CSF1R inhibitor, JNJ-40346527 (JNJ527), attenuated the disease-dependent increase in TSPO signal, particularly in the dentate gyrus of the hippocampus, where JNJ527 attenuated the number of Iba1+ microglia and neurons, but not GFAP+ astrocytes or endothelial cells. These findings suggest that [3H]PBR28 quantitative autoradiography in combination with immunohistochemistry are important translational tools for detecting and quantifying neuroinflammation, and its treatments, in neurodegenerative disease. Furthermore, we demonstrate that although TSPO overexpression in the ME7 brains was driven by various cell types, the therapeutic effect of the CSF1R inhibitor was primarily to modulate TSPO expression in microglia and neurons, which identifies an important route of biological action of this particular CSF1R inhibitor and provides an example of a cell-specific effect of this type of therapeutic agent on the neuroinflammatory process.

Keywords: Astrocytes; CSF1R; ME7; Microglia; Neuroinflammation; Neurons; Prion disease; TSPO.


Conflict of interest statement

The authors declare that there are no conflicts of financial and non-financial interests with respect to the conducted research, authorship and publication of this work.

Figures

Fig. 1
Fig. 1
[3H]PBR28 binding in ME7-prion mice and pharmacological attenuation by JNJ527. A Representative autoradiographs of [3H]PBR28 in NBH (normal brain homogenate), ME7 and ME7 + JNJ527 mice brains (upper panels represent total signal and lower panels represent non-specific signal). B Mean signal intensity binding of [3H]PBR28 for cortex, hippocampus and thalamus from the three treatment groups. Each dot represents an individual mouse’s data from an average of two consecutive sections from each region of interest. Bars represent mean ± standard error of the mean. For ROI placement examples see Additional file 1: Fig. S2A. Statistical differences: significant effect of treatment group (F (2, 20) = 40.14, p < 0.0001) and ROI (F (1.998, 39.96) = 11.90, p < 0.0001) with no significant group × ROI interaction (F (4, 40) = 2.227, p = 0.0833). Data were analysed with a mixed-effects model ANOVA with ROI as within-subject factor and treatment group as between-subject factor followed by post hoc Sidak tests (n = 7–8/group)
Fig. 2
Fig. 2
TSPO regional brain expression in ME7-prion mice and pharmacological attenuation by JNJ527. A Representative TSPO immunohistochemistry images of NBH, ME7 and ME7 + JNJ527 mouse brains. B Quantification of percentage area occupied by TSPO staining in brain regions from the three treatment groups. Each single dot represents an individual mouse’s data from the average of 3–4 sections from each region of interest per animal. Bars show mean ± standard error of the mean. For ROI placement examples see Additional file 1: Fig. S2B. Statistical differences: significant effect of treatment group in the cortical (F (2, 20) = 8.110, p = 0.0026), thalamic (F (2,19) = 15.72, p < 0.0001), and hippocampal regions [CA1 (F (2, 20) = 14.63, p = 0.0001), CA3 (F (2, 20) = 8.509, p = 0.0021) and the dentate gyrus (F (2, 20) = 16.30, p < 0.0001)] (Table 1). Data were analysed with a one-way ANOVA followed by post hoc Tukey tests (n = 7–8/group)
Fig. 3
Fig. 3
Microglia/macrophages, astrocytes, neurons and TSPO in the dentate gyrus of the hippocampus in NBH, ME7, ME7 + JNJ527 mice. A Confocal photomicrographs from dentate gyrus-immunostained sections. Microglia/macrophages, Iba1 (purple), astrocytes, GFAP (green), neurones, NeuN (cyan) and TSPO (red). B Cell counts expressed as Iba1+ cells, C GFAP+ cells, D NeuN+ cells, E TSPO+ cells from the three treatment groups (NBH, ME7 prion infected mice, and ME7+ treatment with JNJ527). Scale bar = 20 μm. Each single dot represents an individual mouse’s data from one section from each region of interest from an ROI in the dentate gyrus placed as in Additional file 1: Fig. S2B. Error bars represent mean ± standard error of the mean. Statistical differences: significant effect of treatment group on the number of Iba1+ cells (F (2, 18) = 2.606, p = 0.0003), GFAP+ cells (F (2,20) = 1.096, p = 0.0017) and NeuN+ cells (F (2, 16) = 8.395, p < 0.0001). Data were analysed with a one-way ANOVA followed by post hoc Tukey tests (n = 7–8/group)
Fig. 4
Fig. 4
TSPO expression in microglia, astrocytes, neurons and endothelium in the dentate gyrus of the hippocampus in the ME7−prion mice. A, D Confocal photomicrographs from dentate gyrus-immunostained sections from NBH, ME7, ME7 + JNJ527 mice. A Microglia/macrophages, Iba1 (cyan), astrocytes, GFAP (green), and TSPO (red). D Neurons, NeuN (green), endothelial cells, CD31 (purple) and TSPO (red). Scale bar = 20 μm for top panels A and D. Magnifications at 50 μm showing TSPO (red) in astrocytic cells (green) and in microglia/macrophages (cyan) (bottom panel A) and TSPO (red) in neuronal cells (green) and in the vascular endothelium (purple) (bottom panel D) with their confocal lateral views showing co-localization of TSPO in the different cell types. Nuclear counterstaining was performed with DAPI (blue). For panel A: white arrowsheads: cells positive for GFAP and TSPO; empty arrowheads: cells positive for Iba1 and TSPO and for panel D: white arrowsheads: cells positive for NeuN and TSPO; empty arrowheads: cells positive for CD31 and TSPO. B Cell counts expressed as TSPO+Iba1+, C cell counts expressed as TSPO+GFAP+ cells, E cell counts expressed as TSPO+NeuN+, F area expressed as TSPO+CD31+ area and G representation of TSPO+Iba1+, TSPO+GFAP+ and TSPO+NeuN+ cells from the dentate gyrus from the three treatment groups. Each single dot represents an individual mouse’s data from one selected section from each region of interest from an ROI in the dentate gyrus placed as shown in Additional file 1: Fig. S2B. Error bars represent mean ± standard error of the mean. Statistical differences: significant differences in the number of TSPO+Iba1+ cells (F (2, 19) = 16.34, p < 0.0001), TSPO+GFAP+ cells (F (2, 20) = 10.84, p = 0.0012) and TSPO+NeuN+ cells (F (2, 16) = 34.55, p < 0.0001) but not in the TSPO+CD31+ area (F (2, 15) = 2.099, p = 0.1571). Data were analysed with a one-way ANOVA followed by post hoc Tukey tests (n = 7–8/group)

References

    1. Kwon HS, Koh S-H. Neuroinflammation in neurodegenerative disorders: the roles of microglia and astrocytes. Transl Neurodegener. 2020;9:42. doi: 10.1186/s40035-020-00221-2. - DOI - PMC - PubMed
    1. Banati RB, Middleton RJ, Chan R, Hatty CR, Wai-Ying Kam W, Quin C, et al. Positron emission tomography and functional characterization of a complete PBR/TSPO knockout. Nat Commun. 2014;5:5452. doi: 10.1038/ncomms6452. - DOI - PMC - PubMed
    1. Middleton RJ, Liu G-J, Banati RB. Guwiyang Wurra–‘Fire Mouse’: a global gene knockout model for TSPO/PBR drug development, loss-of-function and mechanisms of compensation studies. Biochem Soc Trans. 2015;43:553–558. doi: 10.1042/BST20150039. - DOI - PubMed
    1. Tu LN, Morohaku K, Manna PR, Pelton SH, Butler WR, Stocco DM, et al. Peripheral benzodiazepine receptor/translocator protein global knock-out mice are viable with no effects on steroid hormone biosynthesis. J Biol Chem. 2014;289:27444–27454. doi: 10.1074/jbc.M114.578286. - DOI - PMC - PubMed
    1. Wang H, Zhai K, Xue Y, Yang J, Yang Q, Fu Y, et al. Global deletion of TSPO does not affect the viability and gene expression profile. PLoS ONE. 2016;11:8–10. - PMC - PubMed