

An integrated analysis of air pollution and meteorological conditions in Jakarta
- PMID: 37032334
- PMCID: PMC10083178
- DOI: 10.1038/s41598-023-32817-9
An integrated analysis of air pollution and meteorological conditions in Jakarta
Abstract
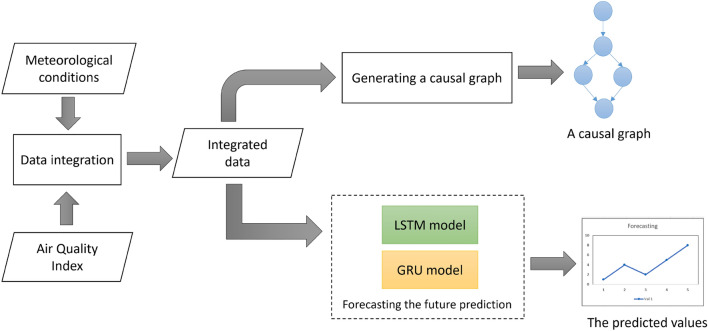
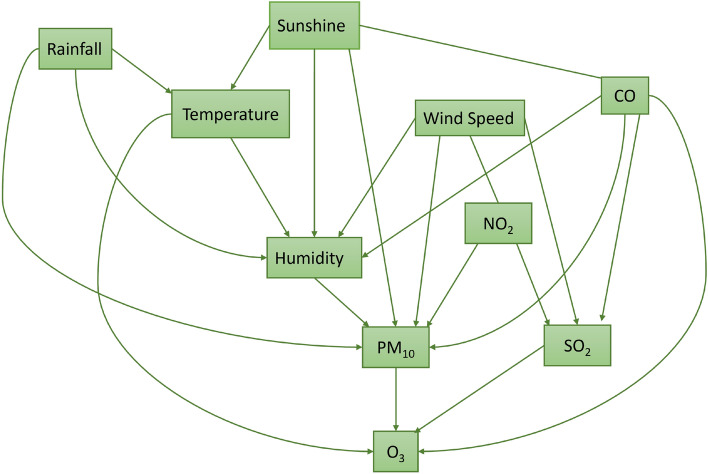
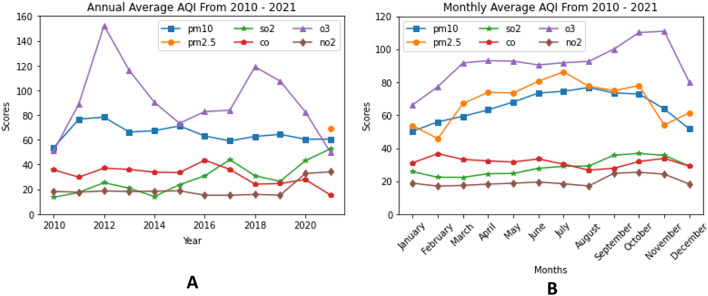
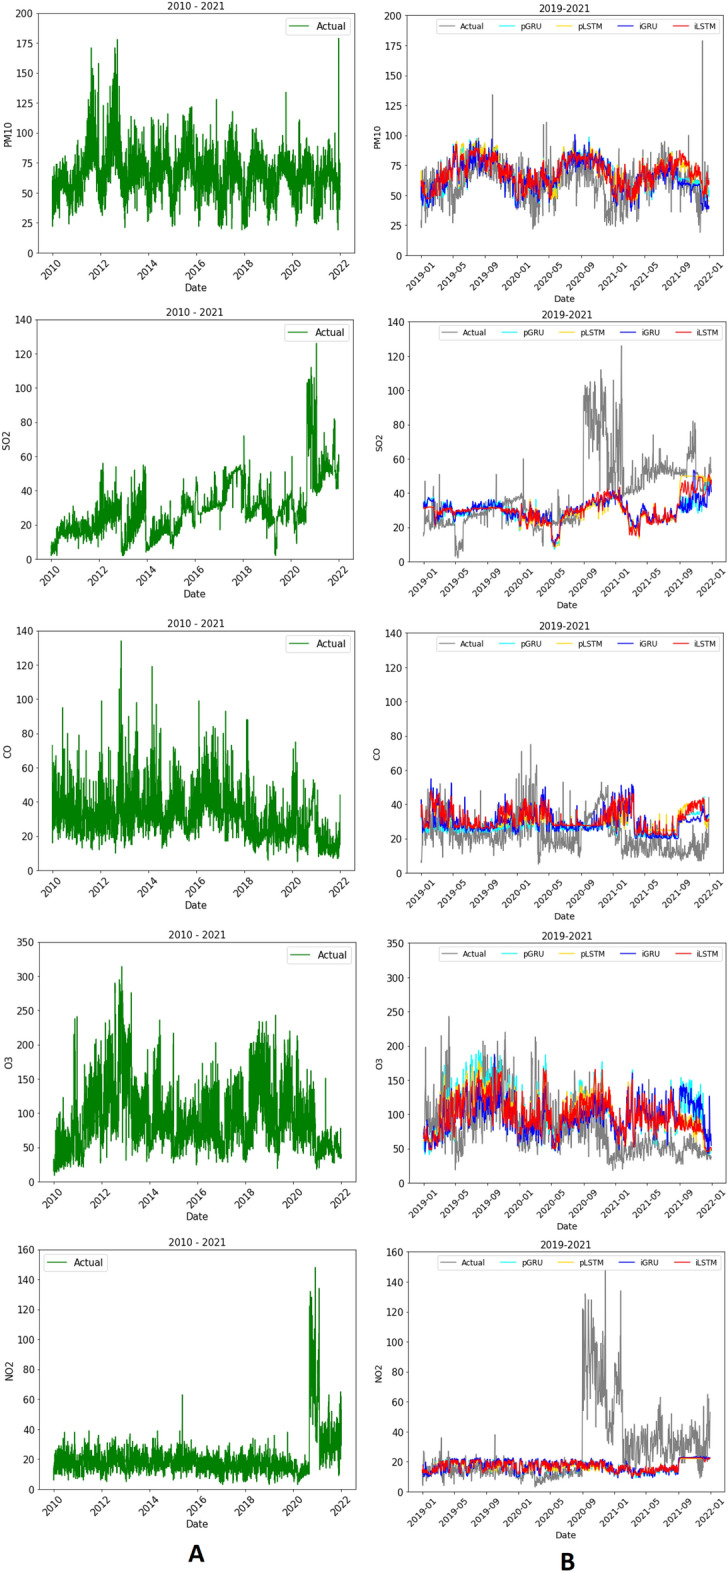
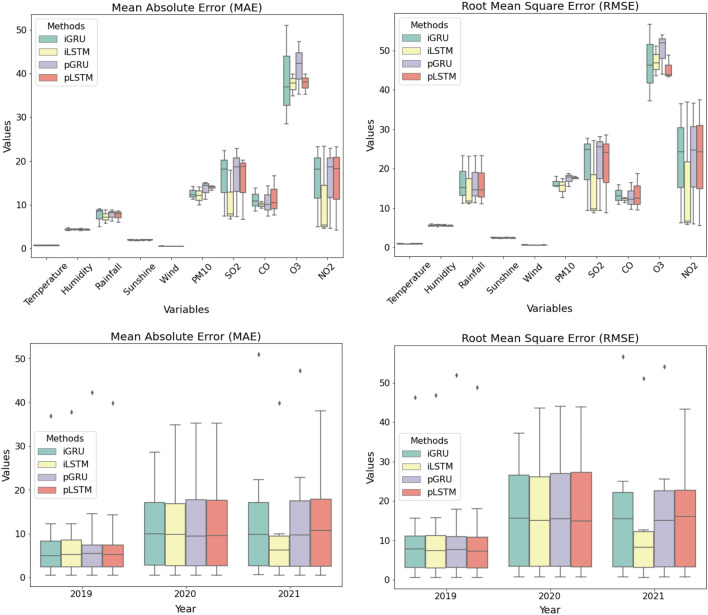
Air pollution and climate change are general problems for society. This paper proposes an integrated analysis of the Air Quality Index (AQI) and meteorological conditions in Jakarta. The column-based data integration model is applied to create integrated data of the Air Quality Index and meteorological conditions. The integrated data is then used to generate a causal graph using the PC algorithm. The causal graph reveals that there exist causal relationships between pollutants and meteorological conditions, e.g, humidity, rainfall, wind speed, and duration of sunshine affect particulate matter 10 (PM[Formula: see text]); wind speed affects sulfur dioxide (SO[Formula: see text]); temperature affects ozone (O[Formula: see text]). The historical data records that the average wind speed is decreased and the number of unhealthy days has risen. Ozone and particulate matter are two pollutants that mainly influence poor air quality in Jakarta. The integrated data is also used to train Long Short-Term Memory (LSTM) and Gated Recurrent Unit (GRU) for forecasting. Experimental results show that LSTM using integrated data produces smaller errors for forecasting AQI and meteorological conditions.
© 2023. The Author(s).
Conflict of interest statement
The author declares no competing interests.
Figures

Similar articles
-
Dynamic effect analysis of meteorological conditions on air pollution: A case study from Beijing.Sci Total Environ. 2019 Sep 20;684:178-185. doi: 10.1016/j.scitotenv.2019.05.360. Epub 2019 May 24. Sci Total Environ. 2019. PMID: 31153065
-
Impact of fine particulate fluctuation and other variables on Beijing's air quality index.Environ Sci Pollut Res Int. 2015 Apr;22(7):5139-51. doi: 10.1007/s11356-014-4024-z. Epub 2015 Jan 7. Environ Sci Pollut Res Int. 2015. PMID: 25563832
-
Interactive short-term effects of meteorological factors and air pollution on hospital admissions for cardiovascular diseases.Environ Sci Pollut Res Int. 2022 Sep;29(45):68103-68117. doi: 10.1007/s11356-022-20592-5. Epub 2022 May 9. Environ Sci Pollut Res Int. 2022. PMID: 35532824
-
Forecasting of daily air quality index in Delhi.Sci Total Environ. 2011 Nov 15;409(24):5517-23. doi: 10.1016/j.scitotenv.2011.08.069. Epub 2011 Oct 1. Sci Total Environ. 2011. PMID: 21962560
-
Effects of Air Pollution and Meteorological Conditions on DED: Associated Manifestations and Underlying Mechanisms.Klin Monbl Augenheilkd. 2024 Sep;241(9):1062-1070. doi: 10.1055/a-2316-6808. Epub 2024 Apr 30. Klin Monbl Augenheilkd. 2024. PMID: 38688324 Review. English.
Cited by
-
Examination of air pollutants and their risk for human health in urban and suburban environments for two Romanian cities: Brasov and Iasi.Heliyon. 2023 Oct 31;9(11):e21810. doi: 10.1016/j.heliyon.2023.e21810. eCollection 2023 Nov. Heliyon. 2023. PMID: 38027749 Free PMC article.
-
ConvFormer-KDE: A Long-Term Point-Interval Prediction Framework for PM2.5 Based on Multi-Source Spatial and Temporal Data.Toxics. 2024 Jul 30;12(8):554. doi: 10.3390/toxics12080554. Toxics. 2024. PMID: 39195656 Free PMC article.
References
-
- Kan H, Chen B, Zhao N, London SJ, Song G, Chen G, Zhang Y, Jiang L, Committee HHR. Part 1 a time-series study of ambient air pollution and daily mortality in Shanghai, China. Res. Rep. Health Eff. Inst. 2010;154(1):17–78. - PubMed
-
- Qian Z, He Q, Lin H-M, Kong L, Zhou D, Liang S, Zhu Z, Liao D, Liu W, Bentley CM, Dan J, Wang B, Yang N, Xu S, Gong J, Wei H, Sun H, Qin Z, Committee HHR. Part 2 association of daily mortality with ambient air pollution, and effect modification by extremely high temperature in Wuhan, China. Res. Rep. Health Eff. Inst. 2010;154(1):91–217. - PubMed
LinkOut - more resources
Full Text Sources
