. 2023 Apr 10;22(1):69.
doi: 10.1186/s12943-023-01767-1.

Super-enhancer-driven TOX2 mediates oncogenesis in Natural Killer/T Cell Lymphoma

Affiliations

Super-enhancer-driven TOX2 mediates oncogenesis in Natural Killer/T Cell Lymphoma

Jianbiao Zhou et al. Mol Cancer. .

Abstract

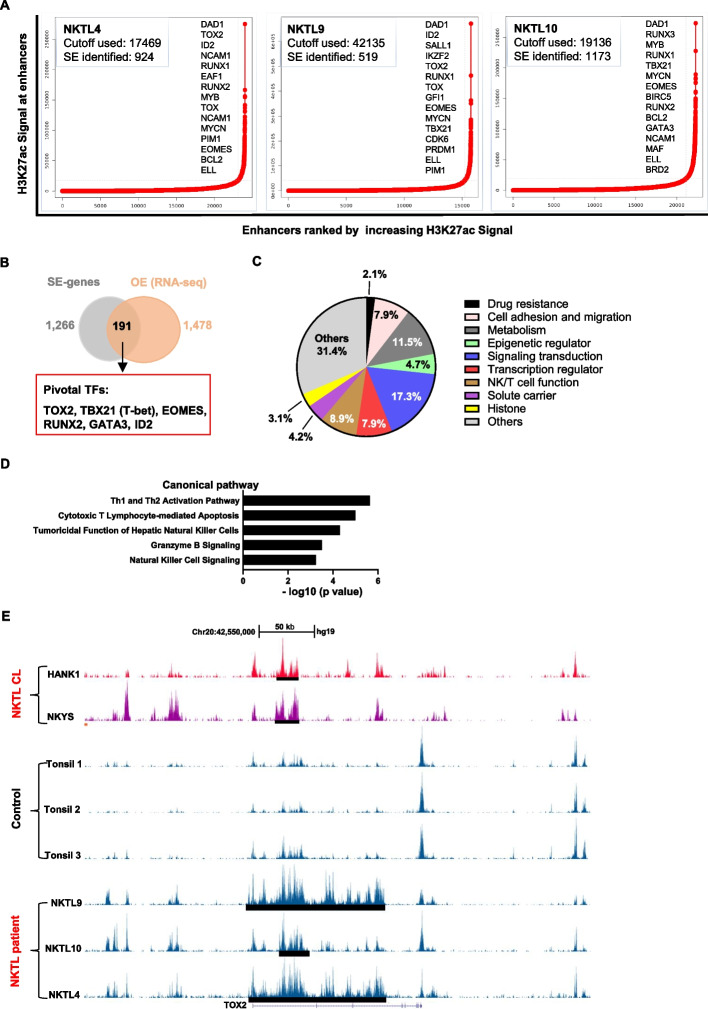
Background: Extranodal natural killer/T-cell lymphoma (NKTL) is an aggressive type of non-Hodgkin lymphoma with dismal outcome. A better understanding of disease biology and key oncogenic process is necessary for the development of targeted therapy. Super-enhancers (SEs) have been shown to drive pivotal oncogenes in various malignancies. However, the landscape of SEs and SE-associated oncogenes remain elusive in NKTL.

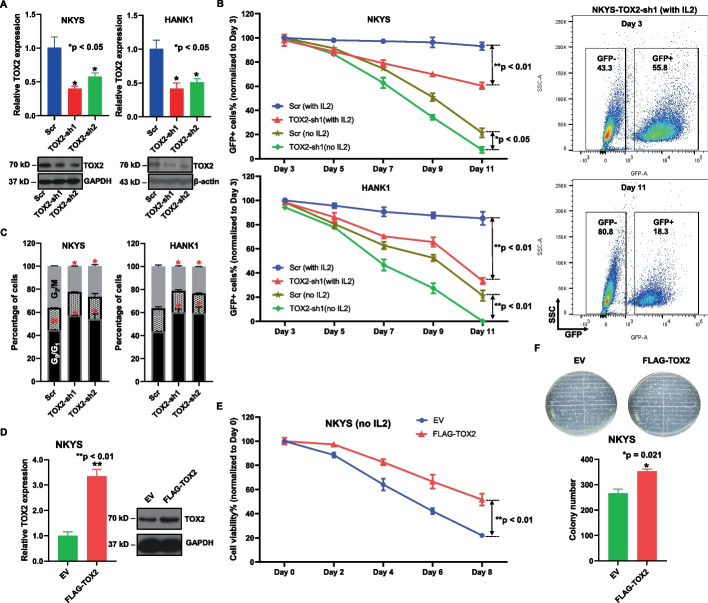
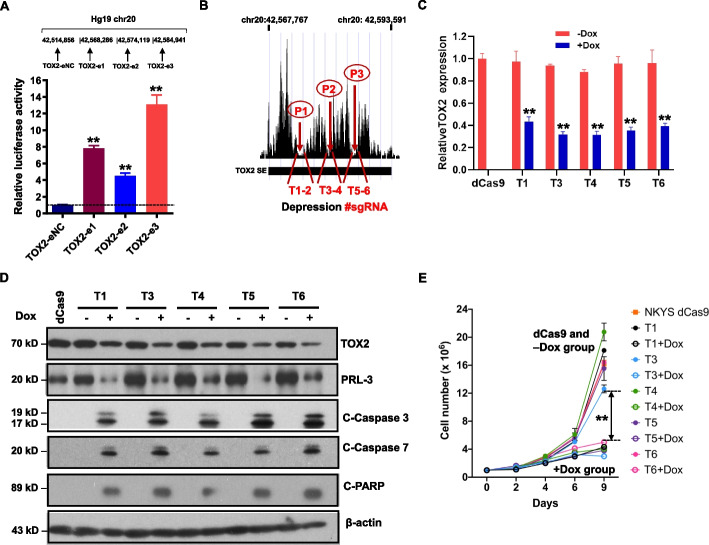
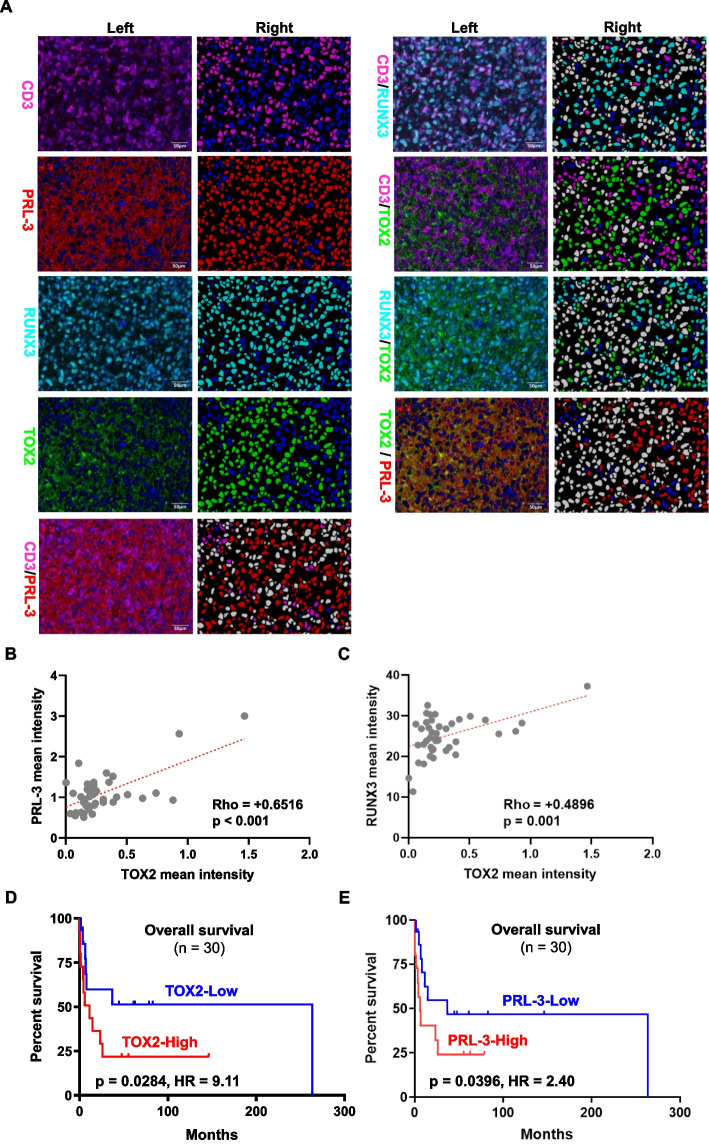
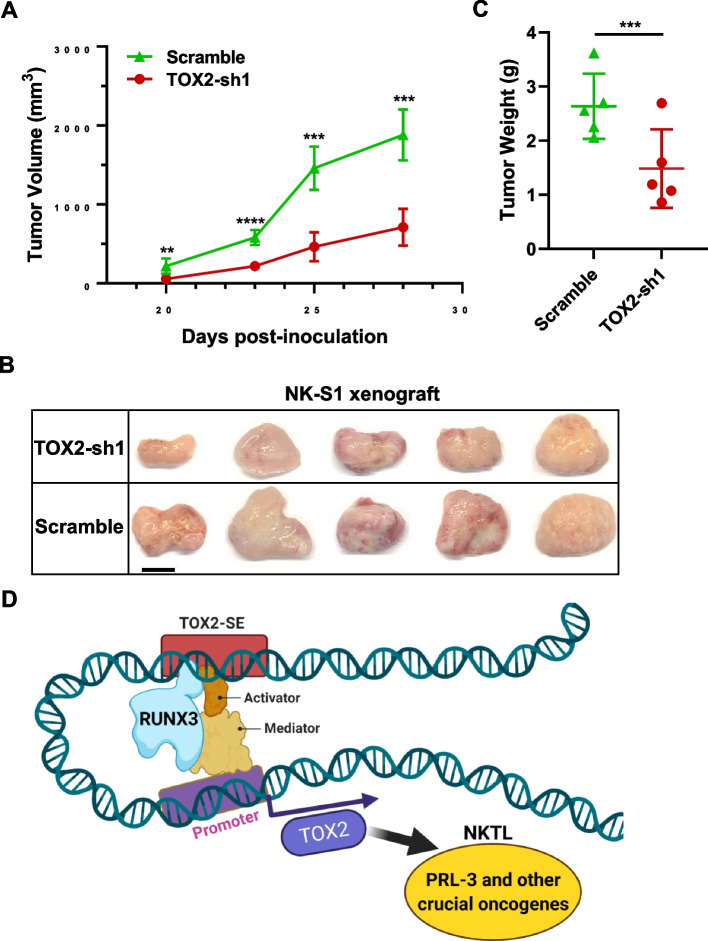
Methods: We used Nano-ChIP-seq of the active enhancer marker histone H3 lysine 27 acetylation (H3K27ac) to profile unique SEs NKTL primary tumor samples. Integrative analysis of RNA-seq and survival data further pinned down high value, novel SE oncogenes. We utilized shRNA knockdown, CRISPR-dCas9, luciferase reporter assay, ChIP-PCR to investigate the regulation of transcription factor (TF) on SE oncogenes. Multi-color immunofluorescence (mIF) staining was performed on an independent cohort of clinical samples. Various function experiments were performed to evaluate the effects of TOX2 on the malignancy of NKTL in vitro and in vivo.

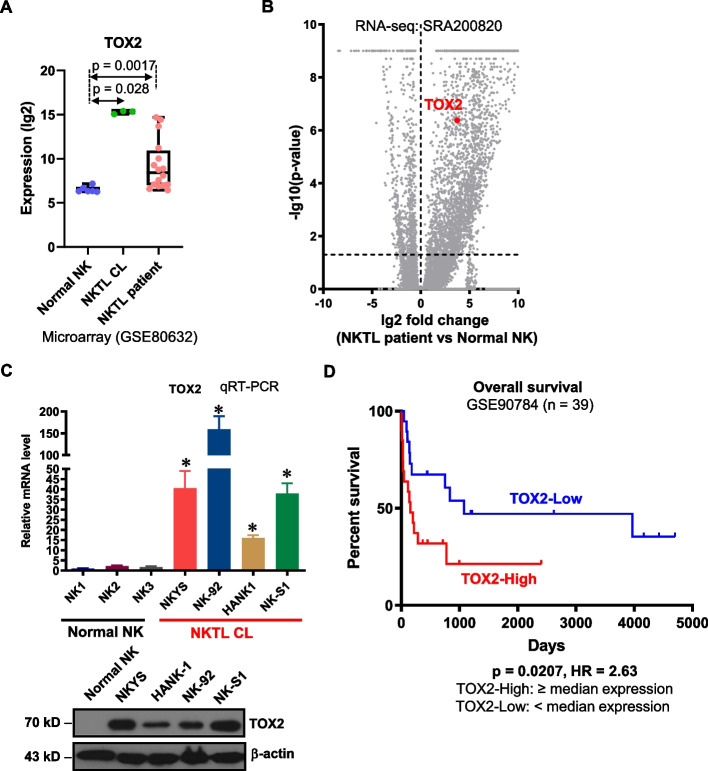
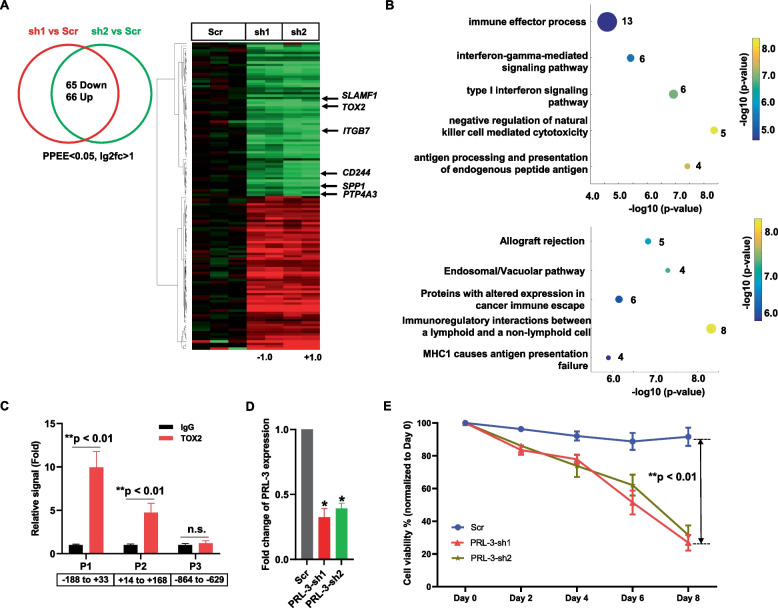
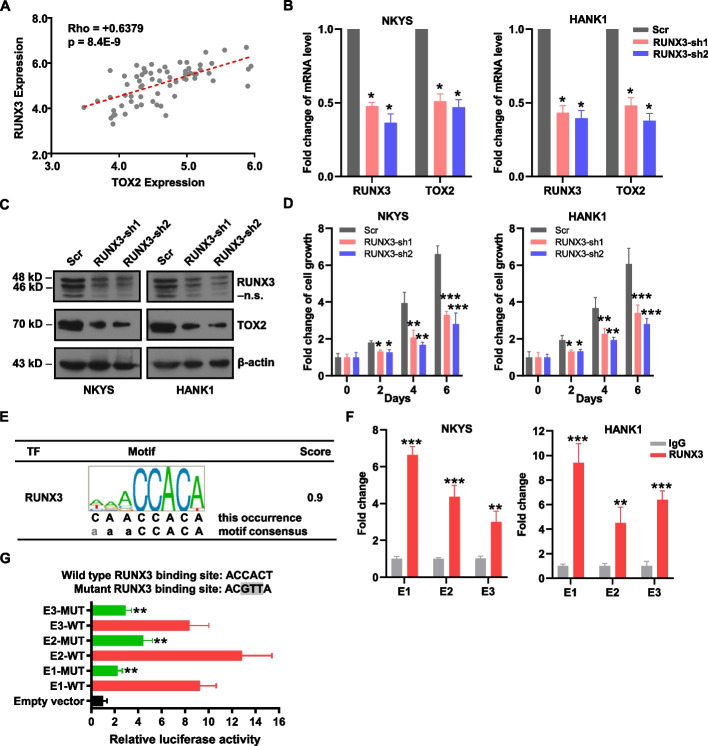
Results: SE landscape was substantially different in NKTL samples in comparison with normal tonsils. Several SEs at key transcriptional factor (TF) genes, including TOX2, TBX21(T-bet), EOMES, RUNX2, and ID2, were identified. We confirmed that TOX2 was aberrantly overexpressed in NKTL relative to normal NK cells and high expression of TOX2 was associated with worse survival. Modulation of TOX2 expression by shRNA, CRISPR-dCas9 interference of SE function impacted on cell proliferation, survival and colony formation ability of NKTL cells. Mechanistically, we found that RUNX3 regulates TOX2 transcription by binding to the active elements of its SE. Silencing TOX2 also impaired tumor formation of NKTL cells in vivo. Metastasis-associated phosphatase PRL-3 has been identified and validated as a key downstream effector of TOX2-mediated oncogenesis.

Conclusions: Our integrative SE profiling strategy revealed the landscape of SEs, novel targets and insights into molecular pathogenesis of NKTL. The RUNX3-TOX2-SE-TOX2-PRL-3 regulatory pathway may represent a hallmark of NKTL biology. Targeting TOX2 could be a valuable therapeutic intervene for NKTL patients and warrants further study in clinic.

Keywords: Epigenetics; Natural Killer/T Cell Lymphoma; PRL-3; RUNX3; Super-enhancer; TOX2; Therapeutic targets.


Conflict of interest statement

The authors declare that they have no competing interests.

Figures

Fig. 1
Fig. 1
The Super enhancers landscape of primary NKTL patient samples, NKTL cell lines and the controls. A Enhancer regions of in 3 primary NKTL patients. Enhancers were ranked by increasing H3K27Ac signal, and enhancers above the inflection point of the curve were defined as SEs, and the number of SEs was shown for each sample. Examples of SEs associated genes found in at least two primary MM cases were also presented. B Schematic diagram of the selection criteria for high-confident candidate SE-associated genes. C The list of final 191 SE-associated genes selected according to the criteria shown in (B) was classified into different function group. D NKTL-SE genes were enriched in multiple signaling pathways related to NK cell function. E Track view of H3K27ac ChIP-seq density profile centered at the TOX2 gene loci of NKTL cell line HNAK1 and NKYS (top panel), 3 tonsil controls (middle panel) and 3 primary NKTL patient samples (lower panel). Locations of the SEs regions were marked by black bars
Fig. 2
Fig. 2
The expression and prognostic value of TOX2 in NKTL. A Expression (lg2) level of TOX2 in a collection of normal NK cells, NKTL cell line and NKTL patient samples derived from a microarray dataset in Gene Expression Omnibus (GEO) database (accession number: GSE80632). B Volcano plot demonstrating gene expression level in a collection of normal NK cells and NKTL patient samples derived from an RNA-seq dataset deposited in the Sequence Read Archive (SRA) database, under the accession code SRA200820. Y-axis represents p value (lg10). X-axis indicates the fold change (lg2) of genes differentially expressed between normal NK cells (left) and NKTL patient samples (right). TOX2 was labelled. C Quantitative RT-PCR of TOX2 gene expression in 3 normal NK cell samples and NKTL cell line NKYS, NK-92, HANK and NK-S1 (upper panel). The expressions of TOX2 gene were normalized to GAPDH level (internal control) for each sample and are presented as relative fold changes (n = 3, mean ± SD). *p < 0.01 for comparison of NKTL cell lines vs. normal NK cells. Western blotting analysis of TOX2 protein in one normal NK cell sample and 4 NKTL cell lines (lower panel). β-actin was used as a loading control. This result is representative for three independent biological replicates. D Utilizing data (GSE90784) from GEO database, TOX2 expression was categorized into TOX2- High (≥ 50%) and TOX2-Low (< 50%) group. Kaplan–Meier survival curves were constructed for NKTL patients based on TOX2 expression levels (TOX2-Low vs TOX2-High). Significance (p) was evaluated by Log-rank test. HR: hazard ratio
Fig. 3
Fig. 3
Oncogenic properties of TOX2 in NKTL cells. A NKYS and HANK1 cells were infected with either scramble shRNA, or TOX2-sh1 or TOX2-sh2 tagged with green fluorescent protein (GFP) for 3 days, then subjected to mRNA and protein extraction. Quantitative RT-PCR (upper panel) and immunoblotting analysis (lower panel) of TOX2 transcript and protein level in these populations. Three independent experiments were conducted. For qRT-PCR analysis, data were normalized to GAPDH level (internal control) for each sample and are expressed as the fold change vs scramble control population (mean ± SD). *p < 0.05. For immunoblotting analysis, GAPDH and β-actin were used as loading controls in NKYS cells and HANK1 cells, respectively. Representative blotting images were shown. B Flow cytometric analysis of the percentage of GFP + cells post-infection of NKYS and HANK1 cells. The quantification started at day 3 post-infection at 2-day intervals up to day 11. The percentage of GFP + cells at day 5, 7, 9, 11 was normalized to day 3, respectively. Two sets of cell culture medium with or without human IL-2 (10 ng/ml) were used. Each data point was representative of three biological replicates (mean ± SD). *p < 0.05; **p < 0.01. Representative FACS plots show NKYS cells infected with TOX2-sh1 lentivirus at day 3 and day 11. C Cell cycle analysis of NKYS and HANK1 cells infected with either scramble shRNA or TOX2-sh1 or TOX2-sh2 lentivirus. These cell cycle experiments were triplicated and presented in mean ± SD. *p < 0.05. D Quantitative RT-PCR of TOX2 gene expression in NKYS cells transduced with either empty vector (EV) or FLAG-TOX2 overexpression vector. These data show mean ± SD of 3 independent experiments. **p < 0.01 (left panel). Western blot analysis of TOX2 protein level in EV-NKYS cells and FLAG-TOX2-NKYS cells. GAPDH was used as loading control (right panel). E Quantification of the percentage of GFP + subpopulation among NKYS-EV and NKYS-FLAG-TOX2 cells at 2-day interval up to day 8. Human IL-2 was removed from culture medium. This experiment was repeated 3 times. F TOX2 increases colony formation of NKTL cells. Representative images of colony formation captured from NKYS-EV and NKYS-FLAG-TOX2 cells (upper panel). The numbers of colony in 10 random field was illustrated in mean ± SD (lower panel). These data were from three independent experiments. *p = 0.021
Fig. 4
Fig. 4
Functional importance of TOX2-SE in NKTL cells. A Enhancer activity was identified in a reporter assay for TOX2-eNC (a low H3K27Ac region outside of TOX2-SE on Chr20), TOX2-e1, TOX2-e2 and TOX2-e3 regions, respectively. The position of each region on chr20 was indicated (not in size scale). Enhancer activity is expressed as relative fold change of TOX2-SE regions (-e1, -e2, -e3) vs control region (-eNC). Three biologically independent assays were performed. Error bars represent SD. **p < 0.001. B A schematic diagram of the pairs of sgRNAs designed to target 3 valley bases (P1, P2 and P3) on H3K27Ac track of the SE region of TOX2. Two pairs of sgRNAs were used to direct the dCas9-KRAB transcription repression system to target 2 sites of each valley base (T1-2 for P1; T3-4 for P2; T5-6 for P3). C Decreased mRNA expression of TOX2 target gene after activation of pairs of sgRNAs (T1, T3-6) guided dCas9–KRAB repression system targeting the TOX2-SE region (n = 3 biologically independent samples of NKYS cells). dCas9: stable NKYS-dCas9 cells without pairs of sgRNAs. Dox: doxycycline. Student’s t-test was applied for all statistical comparisons of TOX2 expression in cells + Dox versus -Dox (**p < 0.01). D TOX2, PRL-3, and apoptosis-related proteins were analyzed by Western blot in NKYS-dCas9 cells after transfected with pairs of sgRNA in condition of + Dox or -Dox. Detection of β-actin protein was used as an internal loading control. Three independent experiments were conducted and representative blot images were shown. E Cell proliferation assays with different pairs of sgRNA transfected NKYS-dCas9 cells with or without Dox induction. The number of cells over 9 days was recorded under each condition as indicated. Data of three biological replicates (mean ± SD) were used to construct these growth curves. **p < 0.001 for the different of -Dox versus + Dox group
Fig. 5
Fig. 5
Genetic inhibition of TOX2 in NKTL cells. A Overlap analysis (left panel) and heatmap (right panel) of genes that were differentially expressed induced by knockdown of NKYS cells. Here, FDR of 0.1 was used as a cutoff. Significant gene expression changes are defined by DESeq2 algorithm with fold change ≥ 2 and adjusted p < 0.05. Selected 6 genes including TOX2 were highlighted on the heatmap. B Gene ontology enrichment analysis (upper panel) and pathway analysis (lower panel) of TOX2-regulated genes revealed by RNA-seq analysis. C TOX2 occupancy on TOX2 binding sites in the PRL-3 (PTP4A3) promoter was examined by ChIP using anti-TOX2 antibody with IgG as negative control. ChIP-qPCR was conducted using primers flanking TOX2 binding sites in PRL-3 promoters (P1 and P3). A region without TOX2 binding site (P3) was used as a control. The occupancy of TOX2 on these sites were calculated as percentage of the respective input DNA concentration and expressed as relative signal after normalized against the IgG samples (set as 1). Values are shown as mean ± SD of four independent experiments. **, significantly higher (p < 0.01) than the respective IgG samples. n.s., not significant. Negative and positive numbers indicate the regions relative to the TSS of PRL-3. D NKYS cells were transfected with scramble shRNA (Scr) or PRL-3-sh1, -sh2. Efficacy of PRL-3 silencing measured by qRT-PCR. Data were normalized to GAPDH level (internal control) for each sample and are expressed as the fold change relative to scramble control population (mean ± SD) *p < 0.05. E Cell viability was assessed by CTG assay every 2 days up to day 8. The percentage of cell viability of day 2, 4, 6, 8 was compared with day 0 as baseline (100%). Data shown are the average of 3 independent experiments and each experiment was done in triplicate. **p < 0.01, significant difference between Scr group and PRL-3-sh group
Fig. 6
Fig. 6
RUNX3 bound to the SE and activated the expression of TOX2. A Correlation between RUNX3 expression with TOX2 expression in NKTL patients from GEP dataset: GSE90784. A significant positive correlation was determined by Pearson's p value = 8.39E-09, and R = 0.64. B, C The mRNA (B) and protein (C) levels of RUNX3 and TOX2 were detected by qRT-PCR and Western blot analysis upon transfection with two different pairs of RUNX3-shRNA (RUNX2-sh1, -sh2) or the scramble shRNA (Scr) in NKYS and HANK1 cells. GAPDH was measured for data normalization (B) and β-actin was used as the loading control (C). n.s.: non-specific band produced by anti-RUNX3 antibody (A-3 clone, sc-376591) in addition to specific bands at 48, 46 kD. All these results were representative for three independent biological replicates. D Relative cell growth was measured in NKYS and HANK1 cells transduced with RUNX3-shRNAs or Scr-shRNA. For each condition, cell number was counted at day 2, 4, and 6, then converted to fold change relative to the starting number at day 0. Same number of cells were seeded at day 0 and comparison was made at indicated time points for relative fold changes of cells transduced with RUNX3-shRNA versus Scr. Three biologically independent experiments were performed (mean ± SD). *p < 0.05, **p < 0.01, ***p < 0.001. E RUNX3 binding site locates within the TOX2-SE loci. F ChIP-PCR confirmed the interaction between RUNX3 and SE region of TOX2 in NKYS and HANK1 cells. Data are expressed as fold change of RUNX3 antibody-IP vs IgG control-IP. Data are representative of 3 independent IPs. Error bars indicate SD. **p < 0.01, ***p < 0.001 by two-sample, two-tailed t-test compared with the control. G Indicated vectors were transiently transfected into 293 T cells, and luciferase activity was measured using a Dual-Luciferase system. Firefly luciferase activity was normalized to co-transfected Renilla luciferase and calculated as relative fold change to pGL4.26 empty vector. Data shown represent means ± SD of three independent experiments. **p < 0.01, compared with each RUNX3-WT group (E1, E2, and E3), respectively. WT: wild type; MUT: mutant
Fig. 7
Fig. 7
Multiplex immunofluorescence (mIF) validation of TOX2, RUNX3 and PRL-3 expression in an independent cohort of clinical samples from 42 NKTL patients (NUH). A Representative images of protein expression of CD3, RUNX3, TOX2 and PRL-3 in NKTL patient samples using mIF method. Left columns represented protein expression of CD3 (membrane, magenta), PRL-3 (cytoplasm, red), RUNX3 (nuclear, cyan), and TOX2 (nuclear, green) in NKTL with multiplexed immunofluorescence staining. Right columns indicated the corresponding image analysis masks. Double positive cells were in white; single positive cells were marked in the corresponding immunofluorescence staining color; while negative cells were in blue. The scale bars indicate 50 µm. B Correlation between TOX2 expression with PRL-3 expression in NKTL patients (n = 42) was determined by mean intensity of staining quantified with Visiopharm program. A significant positive correlation was determined by Pearson's p < 0.001, and R = 0.65. C Correlation between TOX2 expression with RUNX3 expression in NKTL patients (n = 42) was determined by mean intensity of staining quantified with Visiopharm program. A significant positive correlation was determined by Pearson's p = 0.001, and R = 0.50. D Kaplan–Meier analysis was performed on the overall survival between patients (n = 30) expressing higher TOX2 expression (TOX2-High, ≥ median expression) and lower (TOX2-Low, < median expression). E Kaplan–Meier analysis was performed on the overall survival between patients (n = 30) expressing higher PRL-3 expression (PRL-3-High, ≥ median expression) and lower (PRL-3-Low, < median expression). In D and E statistical significance (p) was evaluated by Log-rank test and p < 0.05 was considered as significant. HR: hazard ratio
Fig. 8
Fig. 8
Mouse xenograft models of NK-S1-scramble and NK-S1-TOX2-sh1 cells. A The tumor volume was measured by caliper every 2 -3 days. The tumor growth curves were constructed according to the average tumor volume of each group ± SD (mm3). B Mice were sacrificed, and then the images of xenograft tumors were captured after dissection. Scale bar, 1 cm. C Tumor weights of NK-S1 xenografts in scramble (control) verse TOX2-sh1 group. N = 5. **p < 0.01; ***p < 0.001; ****p < 0.0001. D Schematic representation of molecular mechanism involving in TOX2-SE-driven oncogenesis in NKTL

References

    1. van Doesum JA, Niezink AGH, Huls GA, Beijert M, Diepstra A, van Meerten T. Extranodal Natural Killer/T-cell Lymphoma. Nasal Type: Diagnosis and Treatment Hemasphere. 2021;5:e523. - PMC - PubMed
    1. Wang H, Fu BB, Gale RP, Liang Y. NK-/T-cell lymphomas. Leukemia. 2021;35:2460–2468. doi: 10.1038/s41375-021-01313-2. - DOI - PMC - PubMed
    1. Tse E, Kwong YL. How I treat NK/T-cell lymphomas Blood. Blood. 2013;121:4997–5005. doi: 10.1182/blood-2013-01-453233. - DOI - PubMed
    1. Lim JQ, Huang D, Tang T, Tan D, Laurensia Y, Peng RJ, Wong EKY, Cheah DMZ, Chia BKH, Iqbal J, et al. Whole-genome sequencing identifies responders to Pembrolizumab in relapse/refractory natural-killer/T cell lymphoma. Leukemia. 2020;34:3413–3419. doi: 10.1038/s41375-020-1000-0. - DOI - PMC - PubMed
    1. Yamaguchi M, Suzuki R, Oguchi M. Advances in the treatment of extranodal NK/T-cell lymphoma, nasal type. Blood. 2018;131:2528–2540. doi: 10.1182/blood-2017-12-791418. - DOI - PubMed

Publication types

MeSH terms