Multicenter Study
. 2023 Apr 10;7(1):18.
doi: 10.1186/s41747-023-00334-z.

A multicenter evaluation of a deep learning software (LungQuant) for lung parenchyma characterization in COVID-19 pneumonia

Affiliations
Multicenter Study

A multicenter evaluation of a deep learning software (LungQuant) for lung parenchyma characterization in COVID-19 pneumonia

Camilla Scapicchio et al. Eur Radiol Exp. .

Abstract

Background: The role of computed tomography (CT) in the diagnosis and characterization of coronavirus disease 2019 (COVID-19) pneumonia has been widely recognized. We evaluated the performance of a software for quantitative analysis of chest CT, the LungQuant system, by comparing its results with independent visual evaluations by a group of 14 clinical experts. The aim of this work is to evaluate the ability of the automated tool to extract quantitative information from lung CT, relevant for the design of a diagnosis support model.

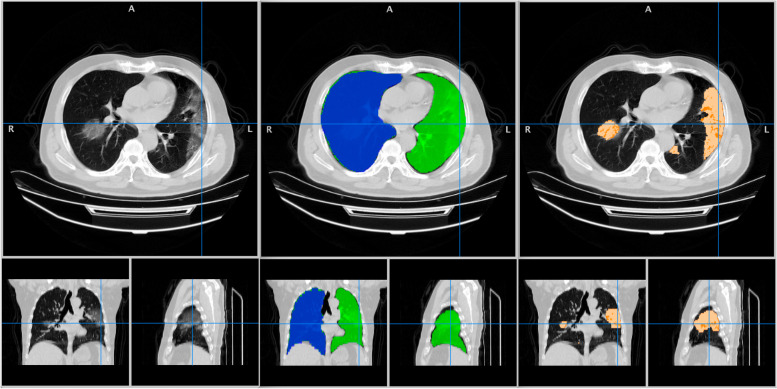
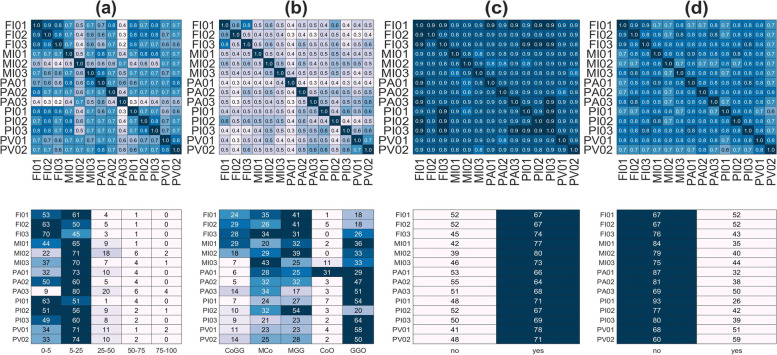
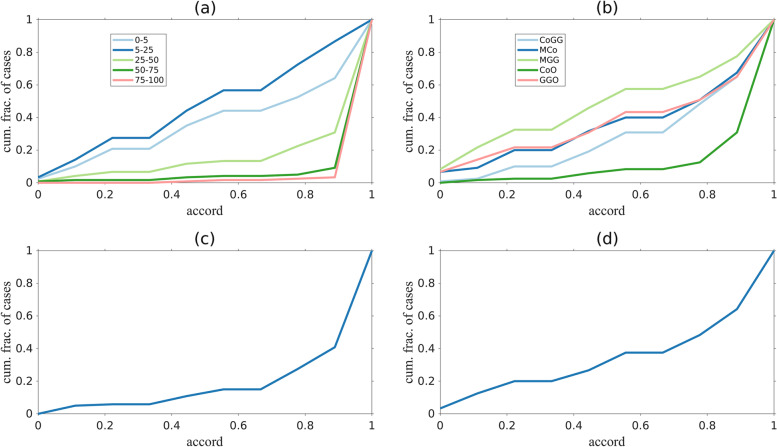
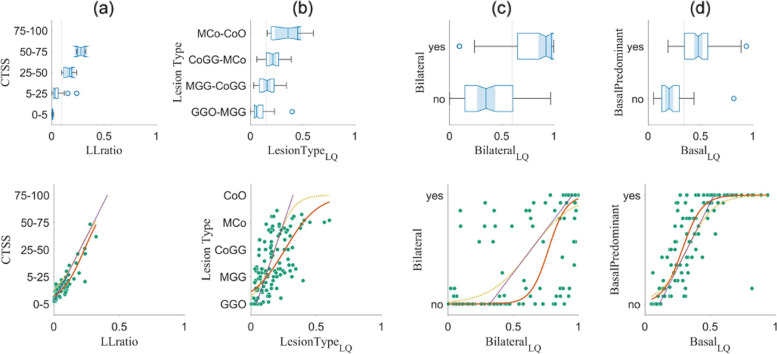
Methods: LungQuant segments both the lungs and lesions associated with COVID-19 pneumonia (ground-glass opacities and consolidations) and computes derived quantities corresponding to qualitative characteristics used to clinically assess COVID-19 lesions. The comparison was carried out on 120 publicly available CT scans of patients affected by COVID-19 pneumonia. Scans were scored for four qualitative metrics: percentage of lung involvement, type of lesion, and two disease distribution scores. We evaluated the agreement between the LungQuant output and the visual assessments through receiver operating characteristics area under the curve (AUC) analysis and by fitting a nonlinear regression model.

Results: Despite the rather large heterogeneity in the qualitative labels assigned by the clinical experts for each metric, we found good agreement on the metrics compared to the LungQuant output. The AUC values obtained for the four qualitative metrics were 0.98, 0.85, 0.90, and 0.81.

Conclusions: Visual clinical evaluation could be complemented and supported by computer-aided quantification, whose values match the average evaluation of several independent clinical experts.

Key points: We conducted a multicenter evaluation of the deep learning-based LungQuant automated software. We translated qualitative assessments into quantifiable metrics to characterize coronavirus disease 2019 (COVID-19) pneumonia lesions. Comparing the software output to the clinical evaluations, results were satisfactory despite heterogeneity of the clinical evaluations. An automatic quantification tool may contribute to improve the clinical workflow of COVID-19 pneumonia.

Keywords: COVID-19; Deep Learning; Lung; Software validation; Tomography (x-ray computed).


Conflict of interest statement

The authors declare that they have no competing interests.

Emanuele Neri is a member of the Scientific Editorial Board of the European Radiology Experimental. He has not taken part in the review or selection process of this article.

Figures

Fig. 1
Fig. 1
The output of LungQuant for a lung computed tomography scan. Left: original input image with axial, coronal and sagittal projections. Center: lung mask produced by LungQuant with different labels for the right and left lungs. Right: lesion masks produced by LungQuant for the ground-glass opacities (light orange) and the consolidations (dark orange)
Fig. 2
Fig. 2
Lesion type examples (axial projection only). a Ground-glass only (patient ID: A0037). b Mainly ground-glass opacities (patient ID: A0311). c Similar contribution of ground-glass and consolidations (patient ID: A0266). d Mainly consolidations (patient ID: A0327). e Consolidations only (patient ID: A0509)
Fig. 3
Fig. 3
Distribution of the lesions. a An example with a bilateral distribution of the lesions (patient ID: A0028 1). b An example without bilateral distribution where the lesions are present in one lung only (patient ID: A0684)
Fig. 4
Fig. 4
Distribution of the lesions. An example with a basal predominant distribution. Two representative slices in the axial projection of the same patient (patient ID: A0028 1): bases with lesions involvement (a); apices free of lesions (b). A coronal or a sagittal projection would have better illustrated the gradient, but the quality of these projections was worse because of the large slice thickness
Fig. 5
Fig. 5
Top row: accuracy matrix on the four clinical metrics: computed tomography severity score (a), lesion type (b), bilateral (c), and basal predominant (d) lesion distribution. Bottom row: number of cases per reader and metric class
Fig. 6
Fig. 6
Cumulative fraction of cases as function of the accord for all clinical metrics: computed tomography severity score (a), lesion type (b), bilateral (c), and basal predominant (d) lesion distribution. Curves show the fraction of cases with accord less or equal to a given value. The larger the area under the curves, the lower the general accord. An accord = 1 indicates complete agreement, an accord equal to 0 indicates that half of the evaluators shared the opinion “x” (where “x” is one of the possible choices for a given metric), the other half shared the opinion “not-x”
Fig. 7
Fig. 7
Upper row: distribution of the 120 cases over the four clinical metrics: computed tomography severity score (a), lesion type (b), bilateral (c), and basal predominant (d) lesion distribution. On the x-axis, there is the quantitative LungQuant output corresponding to the qualitative indicator; on the y-axis, the visual assessment averaged over all radiologists. For the lesion distribution (bilateral and basal predominant), the grouping is according to the majority of radiologists sharing the same opinion. Youden’s cutoff is shown as a dotted vertical line. Lower row: scatterplot of the average clinical metric of the 120 cases (green dots) versus the respective LungQuant output. On the same plot, the linear (purple line), linear-constrained sigmoid (yellow line) and the unconstrained sigmoid fit (red line) are shown

Similar articles

Cited by

References

    1. Kovács A, Palásti P, Veréb D, Bozsik B, Palkó A, Kincses ZT. The sensitivity and specificity of chest CT in the diagnosis of COVID-19. Eur Radiol. 2021;31:2819–2824. doi: 10.1007/s00330-020-07347-x. - DOI - PMC - PubMed
    1. Lv M, Wang M, Yang N, et al. Chest computed tomography for the diagnosis of patients with coronavirus disease 2019 (COVID-19): a rapid review and meta-analysis. Ann Transl Med. 2020;8:622. doi: 10.21037/atm-20-3311. - DOI - PMC - PubMed
    1. Orlandi M, Landini N, Sambataro G, et al. The role of chest CT in deciphering interstitial lung involvement: systemic sclerosis versus COVID-19. Rheumatology. 2022;61:1600–1609. doi: 10.1093/rheumatology/keab615. - DOI - PubMed
    1. Rizzetto F, Perillo N, Artioli D, et al. Correlation between lung ultrasound and chest CT patterns with estimation of pulmonary burden in COVID-19 patients. Eur J Radiol. 2021;138:109650. doi: 10.1016/j.ejrad.2021.109650. - DOI - PMC - PubMed
    1. Kanne JP, Little BP, Chung JH, Elicker BM, Ketai LH. Essentials for radiologists on COVID-19: an update-radiology scientific expert panel. Radiology. 2020;296:E113–E114. doi: 10.1148/radiol.2020200527. - DOI - PMC - PubMed

Publication types