

An Observational Pilot Study using a Digital Phenotyping Approach in Patients with Major Depressive Disorder Treated with Trazodone
- PMID: 37032913
- PMCID: PMC10080076
- DOI: 10.3389/fpsyt.2023.1127511
An Observational Pilot Study using a Digital Phenotyping Approach in Patients with Major Depressive Disorder Treated with Trazodone
Abstract
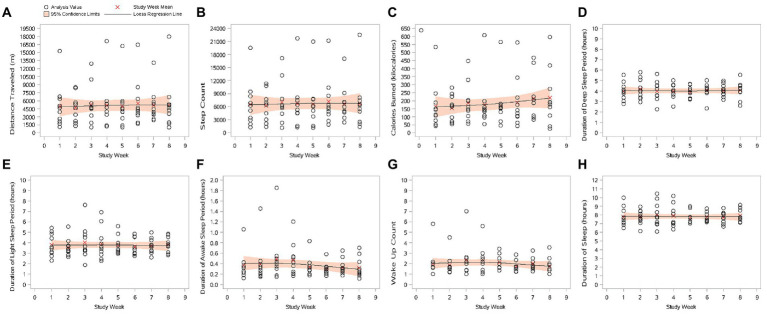
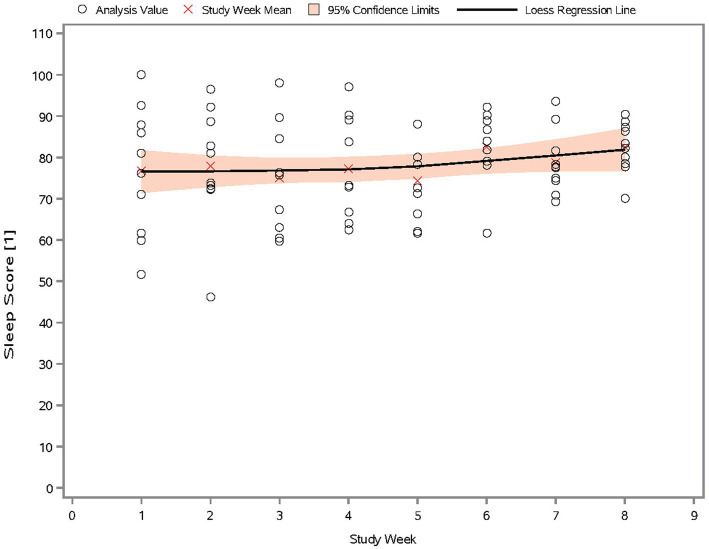
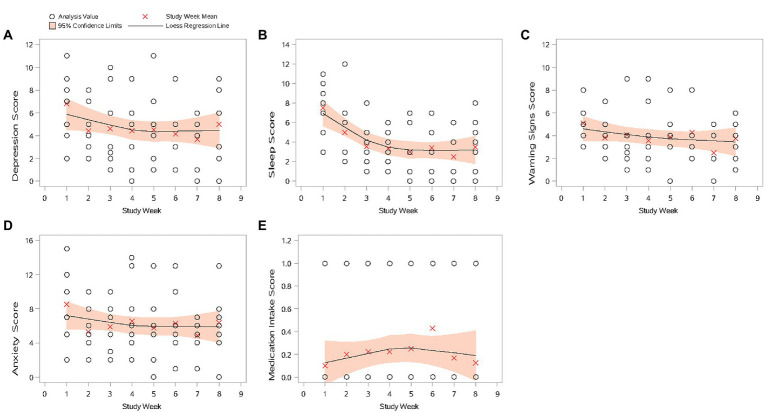
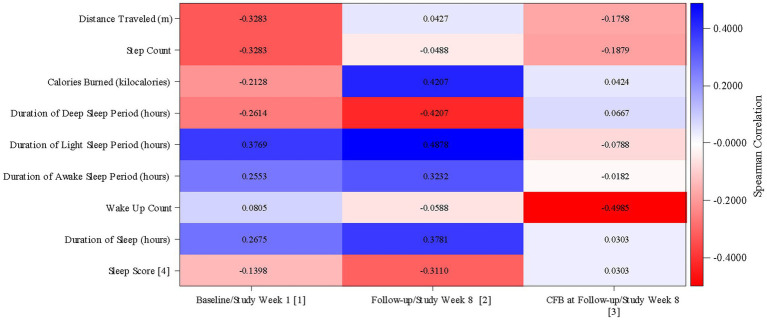
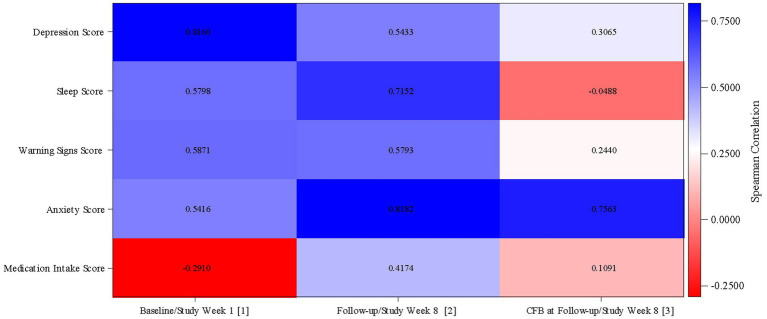
This 8-week study was designed to explore any correlation between a passive data collection approach using a wearable device (i.e., digital phenotyping), active data collection (patient's questionnaires), and a traditional clinical evaluation [Montgomery-Åsberg Depression Rating Scale (MADRS)] in patients with major depressive disorder (MDD) treated with trazodone once a day (OAD). Overall, 11 out of 30 planned patients were enrolled. Passive parameters measured by the wearable device included number of steps, distance walked, calories burned, and sleep quality. A relationship between the sleep score (derived from passively measured data) and MADRS score was observed, as was a relationship between data collected actively (assessing depression, sleep, anxiety, and warning signs) and MADRS score. Despite the limited sample size, the efficacy and safety results were consistent with those previously reported for trazodone. The small population in this study limits the conclusions that can be drawn about the correlation between the digital phenotyping approach and traditional clinical evaluation; however, the positive trends observed suggest the need to increase synergies among clinicians, patients, and researchers to overcome the cultural barriers toward implementation of digital tools in the clinical setting. This study is a step toward the use of digital data in monitoring symptoms of depression, and the preliminary data obtained encourage further investigations of a larger population of patients monitored over a longer period of time.
Keywords: active data collection; digital phenotyping; major depressive disorder; mental health; passive data collection; trazodone.
Copyright © 2023 Čermák, Pietrucha, Nawka, Lipone, Ruggieri, Bonelli, Comandini and Cattaneo.
Conflict of interest statement
JČ, SP, and AN received principal investigator fees from Angelini Pharma S.p.A. PL, AR, ACo, and ACa are full-time employees of Angelini Pharma S.p.A. AB was a full-time employee of Angelini Pharma S.p.A. at the time of study conduction. The authors declare that this study was sponsored by Angelini Pharma S.p.A. The funder had the following involvement in the study: study design, collection, analysis, interpretation of data, the writing of this article, and the decision to submit it for publication.
Figures
Similar articles
-
The efficacy and tolerability of once-daily controlled-release trazodone for depressed mood, anxiety, insomnia, and suicidality in major depressive disorder.Psychopharmacol Bull. 2009;42(4):5-22. Psychopharmacol Bull. 2009. PMID: 20581790 Clinical Trial.
-
Extended-release Trazodone in Major Depressive Disorder: A Randomized, Double-blind, Placebo-controlled Study.Psychiatry (Edgmont). 2009 May;6(5):20-33. Psychiatry (Edgmont). 2009. PMID: 19724732 Free PMC article.
-
A comparative, randomised, double-blind study of trazodone prolonged-release and paroxetine in the treatment of patients with major depressive disorder.Curr Med Res Opin. 2005 Aug;21(8):1139-46. doi: 10.1185/030079905X53243. Curr Med Res Opin. 2005. PMID: 16083521 Clinical Trial.
-
Early response to trazodone once-a-day in major depressive disorder: review of the clinical data and putative mechanism for faster onset of action.CNS Spectr. 2021 Jun;26(3):232-242. doi: 10.1017/S1092852921000304. Epub 2021 Mar 18. CNS Spectr. 2021. PMID: 33731232
-
Novel Augmentation Strategies in Major Depression.Dan Med J. 2017 Apr;64(4):B5338. Dan Med J. 2017. PMID: 28385173 Review.
References
-
- Torous J, Keshavan M. The future of psychoses as seen from the history of its evolution. Curr Behav Neurosci Rep. (2014) 1:94–9. doi: 10.1007/s40473-014-0011-4 - DOI
-
- Melbye S, Kessing LV, Bardram JE, Faurholt-Jepsen M. Smartphone-based self-monitoring, treatment, and automatically generated data in children, adolescents, and young adults with psychiatric disorders: systematic review. JMIR Ment Health. (2020) 7:e17453. doi: 10.2196/17453, PMID: - DOI - PMC - PubMed
-
- Bankmycell (2022). How many smartphones are in the world? Available at: https://www.bankmycell.com/blog/how-many-phones-are-in-the-world (Accessed August 31, 2022).
LinkOut - more resources
Full Text Sources