. 2023 Mar 24:14:983670.
doi: 10.3389/fendo.2023.983670. eCollection 2023.

Melanocortin 4 receptor signaling in Sim1 neurons permits sexual receptivity in female mice

Affiliations

Melanocortin 4 receptor signaling in Sim1 neurons permits sexual receptivity in female mice

Erin A Semple et al. Front Endocrinol (Lausanne). .

Abstract

Introduction: Female sexual dysfunction affects approximately 40% of women in the United States, yet few therapeutic options exist for these patients. The melanocortin system is a new treatment target for hypoactive sexual desire disorder (HSDD), but the neuronal pathways involved are unclear.

Methods: In this study, the sexual behavior of female MC4R knockout mice lacking melanocortin 4 receptors (MC4Rs) was examined. The mice were then bred to express MC4Rs exclusively on Sim1 neurons (tbMC4RSim1 mice) or on oxytocin neurons (tbMC4ROxt mice) to examine the effect on sexual responsiveness.

Results: MC4R knockout mice were found to approach males less and have reduced receptivity to copulation, as indicated by a low lordosis quotient. These changes were independent of body weight. Lordosis behavior was normalized in tbMC4RSim1 mice and improved in tbMC4ROxt mice. In contrast, approach behavior was unchanged in tbMC4RSim1 mice but greatly increased in tbMC4ROxt animals. The changes were independent of melanocortin-driven metabolic effects.

Discussion: These results implicate MC4R signaling in Oxt neurons in appetitive behaviors and MC4R signaling in Sim1 neurons in female sexual receptivity, while suggesting melanocortin-driven sexual function does not rely on metabolic neural circuits.

Keywords: MC4R; lordosis; melanocortin; obesity; oxytocin; sexual behavior; sim1; solicitation.


Conflict of interest statement

The authors declare that the research was conducted in the absence of any commercial or financial relationships that could be construed as a potential conflict of interest.

Figures

Figure 1
Figure 1
Mice fed HFD had normal sexual function at two months of age. (A) Weight of WT (n=11), MC4RKO (n=11), and WT mice on HFD (WT-HFD) (n=5). Brown-Forsythe and Welch ANOVA with Dunnett’s T3 multiple comparisons test. WT vs MC4RKO (p=0.003) and WT-HFD (p=0.101). (B) Lordosis quotient between WT (n=9), WT-HFD (n=5), and MC4RKO mice (n=9). One-way ANOVA with Sidak’s multiple comparison test was used: WT vs MC4RKO (p=0.018); MC4RKO vs WT-HFD (p=0.023). (C) All mouse groups were combined (n=44) to run correlation analysis on weight vs lordosis quotient. *p<0.05; **p<0.01.
Figure 2
Figure 2
MC4R re-expression and colocalization with Sim1. (A) Using in situ hybridization, mRNA of MC4R in tbMC4RSim1 mouse brains was confirmed in the paraventricular hypothalamus (PVH), the nucleus of the olfactory tract (NLOT), and the medial amygdala (MeA). MC4R mRNA is labelled white. Nuclei were labelled using DAPI (blue). (B) Using immunohistochemistry, co-localization between MC4R and Sim1-cre driven tdTomato expression was confirmed in the MeA of Sim1-cre mice. Sim1 (tdTomato) labelled red; MC4R labelled green.
Figure 3
Figure 3
In situ hybridization showing lack of MC4R in MC4RKO mice in the paraventricular hypothalamus (PVH), the nucleus of the olfactory tract (NLOT), and the medial amygdala (MeA). MC4R mRNA is labelled green. Nuclei were labelled using DAPI (blue).
Figure 4
Figure 4
In situ hybridization for oxytocin (labeled in red) and MC4R (labeled in green) in the PVH of wildtype mice. Nuclei were labelled using DAPI (blue). Limited, but detectable, overlap was seen.
Figure 5
Figure 5
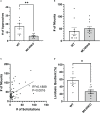
MC4R deletion resulted in fewer approach behaviors and a lower lordosis quotient compared to the WT control. Female approaches towards the male (sniffs or touches) (A), Male mounts (B), and lordosis quotient (D) are compared between WT (n=9) and MC4RKO (n=9-11). All mouse groups were combined (WT, Sim1-cre, Oxt-cre, MC4RKO, tbMC4RSim1, tbMC4ROxt; n=50) to run correlation analysis on approaches vs mounts (C). Groups in this figure were statistically analyzed together with groups from Figure 6 . One-way ANOVA with Sidak’s multiple comparisons test was used for graphs A and C. Brown-Forsythe and Welch ANOVA tests with Dunnett’s T3 multiple comparisons test was used for graph B. Graph A, p=0.008. Graph B, p=0.018 *p<0.05; **p<0.01.
Figure 6
Figure 6
Expression of the MC4R on Sim1 neurons normalizes food intake and locomotion. Food intake in day and night (A), ambulatory activity along the x-axis (B), and area under the curve for diurnal and nocturnal ambulatory activity (C) as measured in calorimetric cages for WT (n=7-9), MC4RKO (n=8-9), tbMC4RSim1 (n=7-8), and tbMC4ROxt mice (n=8). One-way ANOVA with Sidak’s multiple comparisons test was used for graph A. Brown-Forsythe and Welch ANOVA tests with Dunnett’s T3 multiple comparisons test was used for graph C. Graph A night, WT vs MC4RKO (p=0.003) and tbMC4ROxt (p=0.018). Graph C day, WT vs MC4RKO (p=0.005) and tbMC4ROxt (p=0.012). Graph C night, WT vs MC4RKO (p=0.004) and tbMC4ROxt (p=0.0008) *p<0.05; **p<0.01; ***p<0.001.
Figure 7
Figure 7
Serum LH and FSH concentrations were not different between groups. LH (A) and FSH (B) are represented separately as well as in the form of an LH : FSH ratio (C) for WT (n=11) and MC4RKO (n=12). Unpaired t-tests were used for graphs A and B. Unpaired Welch’s t-test was used for Graph C.
Figure 8
Figure 8
MC4RKO mice exhibit decreased locomotion in an open field test. The time that each animal spent in the center boxes (A), the percent of time spent in the center (B), the latency to leave the center (C), the number of fecal pellets produced during the test (D), time spent in the outside boxes (E), the number of boxes traversed (F), the number of rears (G), the number of entries into the center boxes (H), and the number of center boxes traversed (I) is shown. WT=6-7 and MC4RKO=9-11 mice. Unpaired t-tests were used for graphs D-F and K; Unpaired Welch’s t-tests were used for graphs G-J. Graph F (p=0.029); Graph G (p=0.023); Graph H (p=0.006); Graph I (p=0.044); Graph J (p=0.0433). *p<0.05; **p<0.01.
Figure 9
Figure 9
MC4RKO mice show no anxiety in an elevated plus maze. Time spent in the open (A) and closed (B) arms and entrances into the open arms (C) of an elevated plus maze by WT (n=6-7) and MC4RKO mice (n=8-9). No significant differences were found using unpaired t-tests.
Figure 10
Figure 10
Body composition of mice lacking MC4R. Comparison of the (A) body weight, (B) fat mass, (C) lean mass measured by NMR of cre control (n=8-11), MC4RKO (n=9-11), tbMC4RSim1 (n=8), and tbMC4ROxt (n=6-9) groups at two months of age. One-way ANOVA with Sidak’s multiple comparisons test was used for graphs C and E. Brown-Forsythe and Welch ANOVA tests with Dunnett’s T3 multiple comparisons test was used for graphs A and B. Graph A, WT vs MC4RKO (p=0.003), tbMC4RSim1 (p=0.005), and tbMC4ROxt (p=0.002). Graph B, WT vs tbMC4RSim1 (p=0.025). Graph C, WT vs MC4RKO (p=0.019), tbMC4RSim1 (p=0.0002), and tbMC4ROxt (p=0.0003). Graph E, MC4RKO vs tbMC4RSim1 (p=0.007) *p<0.05; **p<0.01; ***p<0.001.
Figure 11
Figure 11
Unchanged metabolic rate and glucose sensitivity in MC4RKO females. Oxygen consumption (A) and respiratory exchange ratio (B) during the day and night measured from WT (n=7-9) and MC4RKO (n=8-9) mice in calorimetric cages. Glucose levels in mice after a 6 hour fast (C) and after glucose administration during a glucose tolerance test (D), with the areas under the curves shown in the inset. Unpaired t-tests were used for all graphs.
Figure 12
Figure 12
MC4R expression exclusively on Sim1 neurons resulted in a lordosis quotient comparable to the Sim1-cre control. Female approaches to the male (A), male mounts (B), and lordosis quotient (C) were compared between combined cre controls (n=17-18), MC4RKO (n=9-11), tbMC4RSim1 (n=7-8), and tbMC4ROxt mice (n=6-7). One-way ANOVA with Sidak’s multiple comparisons test was used for graphs A and C. Brown-Forsythe and Welch ANOVA tests with Dunnett’s T3 multiple comparisons test was used for graph B. Graph A, tbMC4ROxt vs Cre Controls (p=0.0003) and MC4RKO (p=0.0003) and tbMC4RSim1 (p=0.0017); Graph C, MC4RKO vs Cre Controls (p=0.0009) and tbMC4RSim1 (p=0.011) and tbMC4ROxt (p=0.069) *p<0.05; **p<0.01; ***p<0.001.

Similar articles

Cited by

References

    1. Hayes RD, Dennerstein L, Bennett CM, Fairley CK. What is the “true” prevalence of female sexual dysfunctions and does the way we assess these conditions have an impact? J Sex Med (2008) 5(4):777–87. doi: 10.1111/j.1743-6109.2007.00768.x - DOI - PubMed
    1. McCool ME, Theurich MA, Apfelbacher C. Prevalence and predictors of female sexual dysfunction: a protocol for a systematic review. Syst Rev (2014) 3:75. doi: 10.1186/2046-4053-3-75 - DOI - PMC - PubMed
    1. Georgiadis JR, Kringelbach ML. The human sexual response cycle: brain imaging evidence linking sex to other pleasures. Prog Neurobiol (2012) 98(1):49–81. doi: 10.1016/j.pneurobio.2012.05.004 - DOI - PubMed
    1. Sungur MZ, Gunduz A. A comparison of DSM-IV-TR and DSM-5 definitions for sexual dysfunctions: critiques and challenges. J Sex Med (2014) 11(2):364–73. doi: 10.1111/jsm.12379 - DOI - PubMed
    1. Giraldi A, Rellini A, Pfaus JG, Bitzer J, Laan E, Jannini EA, et al. . Questionnaires for assessment of female sexual dysfunction: a review and proposal for a standardized screener. J Sex Med (2011) 8(10):2681–706. doi: 10.1111/j.1743-6109.2011.02395.x - DOI - PubMed

Publication types

Substances

LinkOut - more resources