

The effect of G0S2 on insulin sensitivity: A proteomic analysis in a G0S2-overexpressed high-fat diet mouse model
- PMID: 37033250
- PMCID: PMC10076770
- DOI: 10.3389/fendo.2023.1130350
The effect of G0S2 on insulin sensitivity: A proteomic analysis in a G0S2-overexpressed high-fat diet mouse model
Abstract
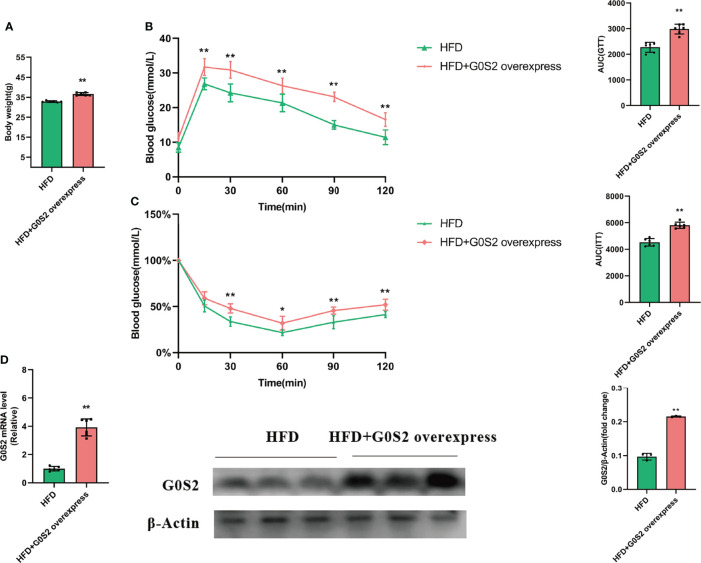
Background: Previous research has shown a tight relationship between the G0/G1 switch gene 2 (G0S2) and metabolic diseases such as non-alcoholic fatty liver disease (NAFLD) and obesity and diabetes, and insulin resistance has been shown as the major risk factor for both NAFLD and T2DM. However, the mechanisms underlying the relationship between G0S2 and insulin resistance remain incompletely understood. Our study aimed to confirm the effect of G0S2 on insulin resistance, and determine whether the insulin resistance in mice fed a high-fat diet (HFD) results from G0S2 elevation.
Methods: In this study, we extracted livers from mice that consumed HFD and received tail vein injections of AD-G0S2/Ad-LacZ, and performed a proteomics analysis.
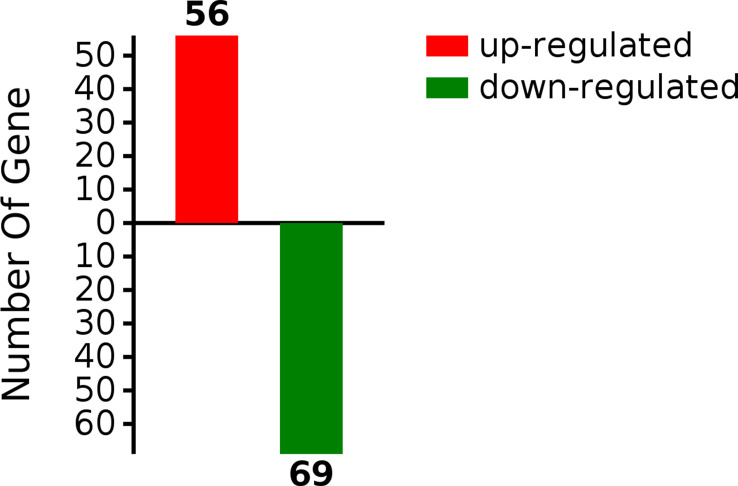
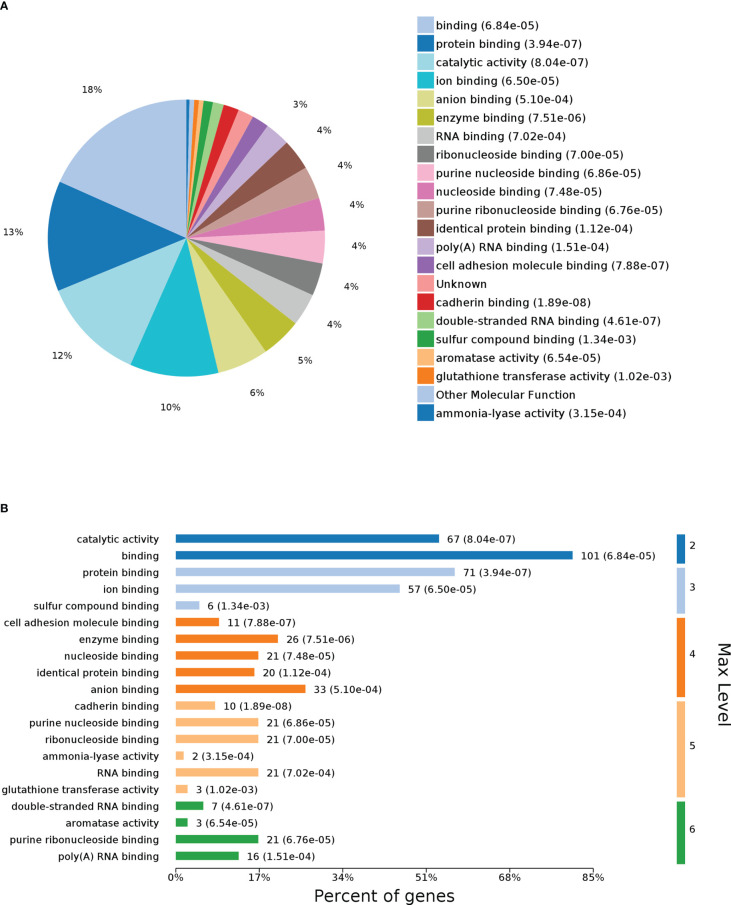
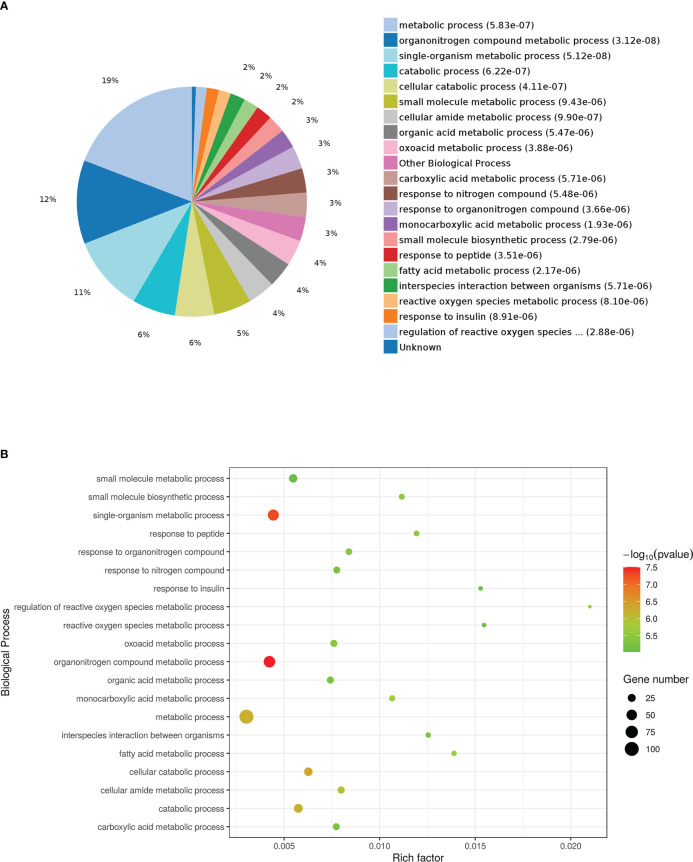
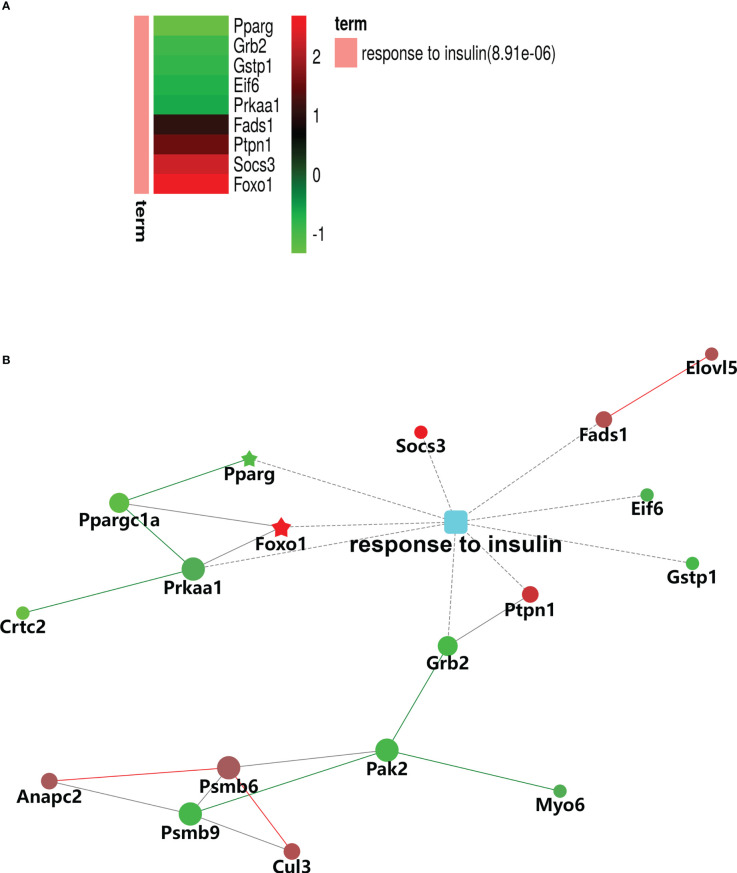
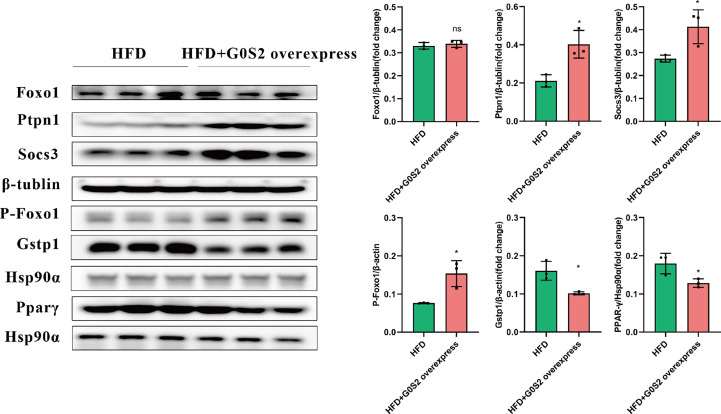
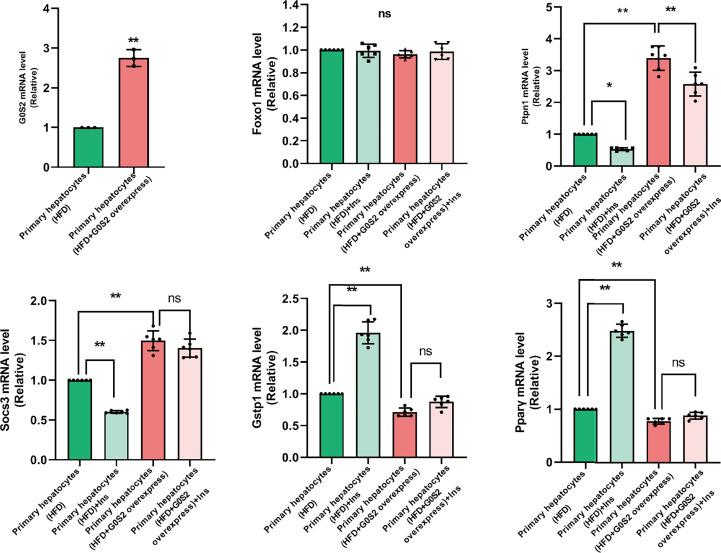
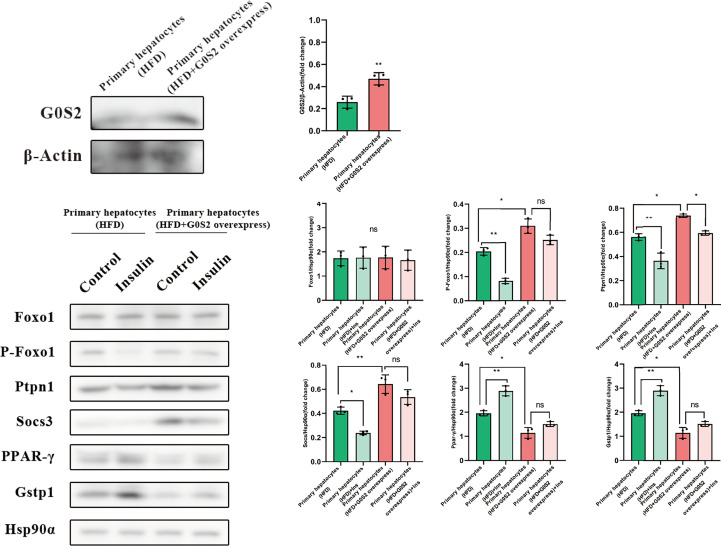
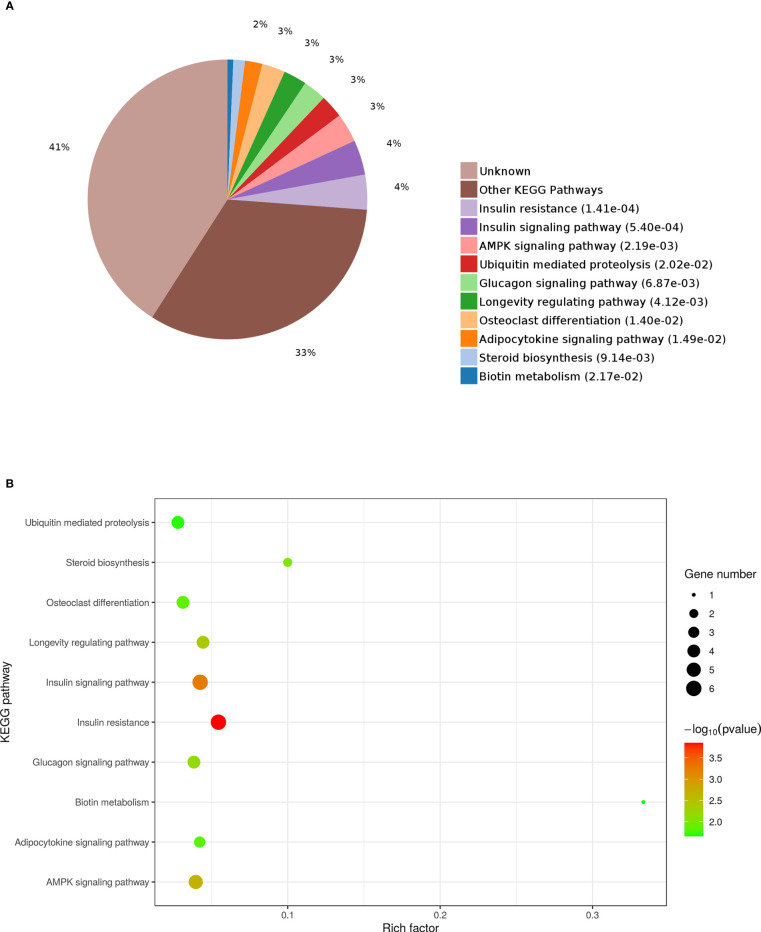
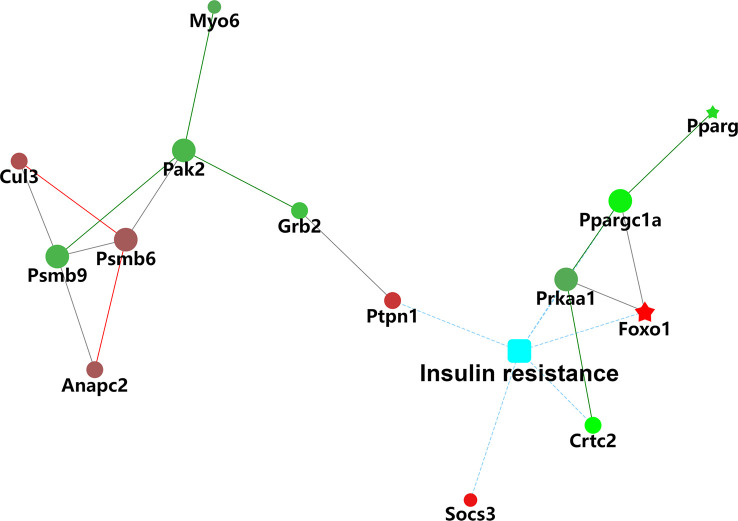
Results: Proteomic analysis revealed that there was a total of 125 differentially expressed proteins (DEPs) (56 increased and 69 decreased proteins) among the identified 3583 proteins. Functional enrichment analysis revealed that four insulin signaling pathway-associated proteins were significantly upregulated and five insulin signaling pathway -associated proteins were significantly downregulated.
Conclusion: These findings show that the DEPs, which were associated with insulin resistance, are generally consistent with enhanced insulin resistance in G0S2 overexpression mice. Collectively, this study demonstrates that G0S2 may be a potential target gene for the treatment of obesity, NAFLD, and diabetes.
Keywords: G0S2; high-fat diet; insulin sensitivity; label-free proteomics; metabolic diseases.
Copyright © 2023 Wu, Zhang, Sun, Yan, Jing and Ma.
Conflict of interest statement
The authors declare that the research was conducted in the absence of any commercial or financial relationships that could be construed as a potential conflict of interest.
Figures
Similar articles
-
Liver-specific G0 /G1 switch gene 2 (G0s2) expression promotes hepatic insulin resistance by exacerbating hepatic steatosis in male Wistar rats.J Diabetes. 2017 Aug;9(8):754-763. doi: 10.1111/1753-0407.12482. Epub 2016 Nov 14. J Diabetes. 2017. PMID: 27624922
-
Deletion of the gene encoding G0/G 1 switch protein 2 (G0s2) alleviates high-fat-diet-induced weight gain and insulin resistance, and promotes browning of white adipose tissue in mice.Diabetologia. 2015 Jan;58(1):149-57. doi: 10.1007/s00125-014-3429-z. Epub 2014 Nov 9. Diabetologia. 2015. PMID: 25381555 Free PMC article.
-
Integrated omics analysis for characterization of the contribution of high fructose corn syrup to non-alcoholic fatty liver disease in obesity.Metabolism. 2023 Jul;144:155552. doi: 10.1016/j.metabol.2023.155552. Epub 2023 Mar 28. Metabolism. 2023. PMID: 36996933
-
Targeted disruption of G0/G1 switch gene 2 enhances adipose lipolysis, alters hepatic energy balance, and alleviates high-fat diet-induced liver steatosis.Diabetes. 2014 Mar;63(3):934-46. doi: 10.2337/db13-1422. Epub 2013 Nov 5. Diabetes. 2014. PMID: 24194501 Free PMC article.
-
A Comparison of the Gene Expression Profiles of Non-Alcoholic Fatty Liver Disease between Animal Models of a High-Fat Diet and Methionine-Choline-Deficient Diet.Molecules. 2022 Jan 27;27(3):858. doi: 10.3390/molecules27030858. Molecules. 2022. PMID: 35164140 Free PMC article. Review.
Cited by
-
Bioinformatics study of the potential therapeutic effects of ginsenoside Rh3 in reversing insulin resistance.Front Mol Biosci. 2024 May 23;11:1339973. doi: 10.3389/fmolb.2024.1339973. eCollection 2024. Front Mol Biosci. 2024. PMID: 38845779 Free PMC article.
-
TSH-stimulated hepatocyte exosomes modulate liver-adipose triglyceride accumulation via the TGF-β1/ATGL axis in mice.Lipids Health Dis. 2025 Mar 6;24(1):81. doi: 10.1186/s12944-025-02509-6. Lipids Health Dis. 2025. PMID: 40050912 Free PMC article.
References
Publication types
MeSH terms
Substances
LinkOut - more resources
Full Text Sources
Medical
Molecular Biology Databases