. 2023 Mar 29;5(2):fcad093.
doi: 10.1093/braincomms/fcad093. eCollection 2023.

Preimplantation or gestation/lactation high-fat diet alters adult offspring metabolism and neurogenesis

Affiliations

Preimplantation or gestation/lactation high-fat diet alters adult offspring metabolism and neurogenesis

Diego A Ojeda et al. Brain Commun. .

Abstract

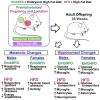
Poor maternal nutrition during pregnancy is known to impair fetal development. Moreover, the preimplantation period is vulnerable to adverse programming of disease. Here, we investigated the effect of a mouse maternal high-fat diet in healthy non-obese dams during preimplantation or throughout pregnancy and lactation on metabolism-related parameters and hippocampal neurogenesis in adult offspring. Female mice were fed from conception either a normal fat diet (normal fat diet group) or high-fat diet throughout gestation and lactation (high-fat diet group), or high-fat diet only during preimplantation (embryonic high-fat diet group, high-fat diet up to E3.5, normal fat diet thereafter). Maternal high-fat diet caused changes in the offspring, including increased systolic blood pressure, diurnal activity, respiratory quotient, and energy expenditure in high-fat diet females, and increased systolic blood pressure and respiratory quotient but decreased energy expenditure in high-fat diet males. High-fat diet males had a higher density of newborn neurons and a lower density of mature neurons in the dentate gyrus, indicating that exposure to a maternal high-fat diet may regulate adult neurogenesis. A maternal high-fat diet also increased the density of astrocytes and microglia in the hippocampus of high-fat diet males and females. Generally, a graded response (normal fat diet < embryonic high-fat < high-fat diet) was observed, with only 3 days of high-fat diet exposure altering offspring energy metabolism and hippocampal cell density. Thus, early maternal exposure to a fatty diet, well before neural differentiation begins and independently of maternal obesity, is sufficient to perturb offspring energy metabolism and brain physiology with lifetime consequences.

Keywords: brain development; metabolic health; nutrition; offspring long-term health; peri-conception.


Conflict of interest statement

The authors have declared that no conflict of interest exists.

Figures
Graphical abstract
Graphical abstract
Figure 1
Figure 1
Maternal HFD increases offspring SBP in the absence of obesity. A. Schematic showing experimental design and feeding regimes for both dams and offspring. Female mice were fed either a control diet (NFD n = 6) or a HFD, during the preimplantation period (EmbHFD n = 7) or, pregnancy and lactation (HFD n = 6). Offspring were weaned at postnatal day 21. After weaning, all offspring were fed an NFD until their euthanasia at 26 weeks of age. B. No significant differences in maternal body weight were observed between the diet groups. NFD, n = 7; EmbHFD, n = 7; HFD, n = 6. Group comparisons via one-way ANOVA with Tukey’s multiple comparison test. C. No differences in offspring litter size at birth were observed. Each point represents the litter size per mother. NFD, n = 7; EmbHFD, n = 7; HFD, n = 6. Group comparisons via one-way ANOVA with Tukey’s multiple comparison test. D. Male offspring body weight over the 26 weeks of life. HFD males showed a higher BW at week 3 compared to NFD males (P = 0.024), NFD (blue triangles; n = 6) and EmbHFD (green dots; n = 6) HFD (red squares; n = 6). The data were analysed with two-way repeated-measures ANOVA followed by Tukey comparison. The variation of BW throughout the offspring’s life (AUC) showed that there are significant differences between NFD and EmbHFD males (P = 0.0087) and between the HFD and EmbHFD males (P = 0.0405). E. Female offspring body weight over the 26 weeks of life. HFD females showed a higher BW at weeks 2 and 3 compared to NFD females (P = 0.018 and P = 0.001 respectively). NFD (blue triangles; n = 6), EmbHFD (green dots; n = 6) HFD (red squares; n = 6). The data were analysed with two-way repeated-measures ANOVA followed by Tukey comparison. The variation of BW throughout the offspring’s life did not show significant differences between the groups. F. HFD males showed higher SBP than the NFD males (P = 0.0108) at 9 weeks of age, NFD, n = 4; EmbHFD, n = 6; HFD, n = 6. G. HFD females showed higher SBP than the NFD females (P = 0.0160) at 9 weeks of age, NFD, n = 4; EmbHFD, n = 5; HFD, n = 5. H. No significant differences were found in SBP in males at 16 weeks of age, NFD, n = 4; EmbHFD, n = 4; HFD, n = 6. I. HFD females had higher SBP than NFD females (P = 0.0407) at 16 weeks of age, NFD, n = 4; EmbHFD, n = 5; HFD, n = 5. Single data points for each mouse were represented as black dots, (f, g, h and i), and data were analysed by multilevel random effects regression. NFD group in blue, the EmbHFD group in green and HFD group in red. Data are expressed as mean ± SEM. *P < 0.05, **P < 0.01.
Figure 2
Figure 2
Effect of maternal HFD and EmbHFD on locomotor activity in the adult offspring. A. Male locomotor activity over a 24 h period (12 h light and 12 h dark). The bars represent the AUC of the activity during the day and night cycle, over a 24 h period. NFD, n = 5; EmbHFD, n = 5; HFD, n = 5. Data were analysed by multilevel random effects regression B. Female locomotor activity over a 24 h period (12 h light and 12 h dark). HFD females had higher activity during the day compared with the NFD females. The HFD and EmbHFD females were different in the second part of the day. The bars represent the AUC of the activity during the day and night cycle, over a 24 h period. NFD, n = 5; EmbHFD, n = 5; HFD, n = 5. Data were analysed by multilevel random effects regression. The shaded areas demarcate the dark phases (from 7:00 pm to 7:00 am). NFD group (blue), EmbHFD group (green) and HFD group (red) at 26 weeks of age. Single data points for each mouse are represented as black dots, and bars represent the AUC for each diet group. All points represent means ± SEM. Each animal belonged to a single litter. *P < 0.05.
Figure 3
Figure 3
Effect of maternal HFD and EmbHFD on indirect calorimetry in the adult offspring. A. Male vO2 consumption over day/night-time cycle. In males, the HFD group showed a smaller VO2 AUC during the first and second part of the day, and the first and second part of the night when compared to the NFD group, and EmbHFD males had a decreased VO2 AUC in the second part of the day when compared with the NFD group. The bars represent the AUC of the oxygen consumption during the day and night cycle, over a 24 h period. NFD, n = 5; EmbHFD, n = 5; HFD, n = 5. Data were analysed by multilevel random effects regression. B. Female vO2 consumption over day/night-time cycle. In females, the HFD group showed a higher vO2 AUC in the second part of the night compared to the NFD group. The bars represent the AUC of the oxygen consumption during the day and night cycle, over a 24 h period. NFD, n = 5; EmbHFD, n = 5; HFD, n = 5. Data were analysed by multilevel random effects regression C. Male carbon dioxide vCO2 consumption over a 24 h period (12 h light and 12 h dark). In males, the vCO2 AUC was lower in the second part of the day, in the first and second part of the night in the HFD group compared to the NFD group. Also, there was a significant difference between EmbHFD and HFD males in the first part, and the second parts of the night. The bars represent the AUC of the carbon dioxide production during the day and night cycle, over a 24 h period. NFD, n = 5; EmbHFD, n = 5; HFD, n = 5. Data were analysed by multilevel random effects regression. D. Female vCO2 consumption over a 24 h period (12 h light and 12 h dark). In females, there was a significant difference between the HFD and the NFD group during the first and second part of the night. There is a significant difference between EmbHFD and HFD females in the first and the second part of the night. The bars represent the AUC of the carbon dioxide production during the day and night cycle, over a 24 h period. NFD, n = 5; EmbHFD, n = 5; HFD, n = 5. Data were analysed by multilevel random effects regression. E. Male RQ over day/night-time cycle. In males, an increase in RQ AUC values during the first and second part of the day compared to the NFD group. Similarly, an increased RQ AUC was observed in the first part and second part of the night when compared to the NFD group. EmbHFD mice had a significantly higher RQ during the first and second parts of the day compared to the NFD group. The bars represent the AUC of the RQ during the day and night cycle, over a 24 h period. NFD, n = 5; EmbHFD, n = 5; HFD, n = 5. Data were analysed by multilevel random effects regression. F. Female RQ over day/night-time cycle. In females, there is an increase in RQ AUC during the first and second parts of the day, and in the first and second parts of the night when compared to the NFD group. EmbHFD mice also showed a greater RQ AUC in the first part of the day compared to the NFD group. HFD females and EmbHFD females were significantly different in the second part of the day, and the first part of the night (P = 0.007). The bars represent the AUC of the RQ during the day and night cycle, over a 24 h period. NFD, n = 5; EmbHFD, n = 5; HFD, n = 5. Data were analysed by multilevel random effects regression. G. Male EE over a day/night-time cycle. In males, the HFD group showed a lower EE AUC during the first and second part of the day, and the first and second part of the night, whereas, in the EmbHFD group, the EE AUC was only reduced in the second part of the day in comparison with the NFD group. It was a significant difference between EmbHFD and HFD males in the first part, and the second part of the night. The bars represent the AUC of the EE during the day and night cycle, over a 24 h period. NFD, n = 5; EmbHFD, n = 5; HFD, n = 5. Data were analysed by multilevel random effects regression. H. Female EE over day/night-time cycle. In females, the EmbHFD group has a significant EE increase in the first part of the day, with respect to the NFD group, and during the night period, the HFD females showed an increase only in the second part of the night. There is a significant difference between EmbHFD and HFD females in the first part, and the second part of the night. The bars represent the AUC of the EE during the day and night cycle, over a 24 h period. NFD, n = 5; EmbHFD, n = 5; HFD, n = 5. Data were analysed by multilevel random effects regression. The shaded areas demarcate the dark phases (from 7:00 pm to 7:00 am). NFD group (blue), EmbHFD group (green) and HFD group (red) at 26 weeks of age. Single data points for each mouse are represented as black dots, and bars represent the AUC for each diet group. All points represent means ± SEM. Each animal belonged to a single litter. *P < 0.05, **P < 0.01, ***P < 0.001, ****P ≤ 0.0001.
Figure 4
Figure 4
Maternal HFD and EmbHFD affect the expression of metabolic markers in the adult liver and hippocampus. A. In the liver, mRNA levels of ObRa were increased in the HFD males compared to the NFD males. B. In the liver, mRNA levels of AdipoR1, AdipoR2, InsR and Igf1R were increased in the HFD females compared to the females. C. In the hippocampus, mRNA levels of Slc2A1, Slc2A3, Slc2A4, Slc2A8, AdipoR1, AdipoR2, InsR and Igf1R were reduced, but the expression of ObRa, and ObRb was increased in the HFD males compared to the NFD males. EmbHFD males showed lower mRNA levels of Slc2A3, Slc2A4, Slc2A8 and InsR, and higher expression levels of ObRb compared to the NFD males. D. In the hippocampus, HFD females showed lower mRNA levels than the NFD group of Slc2A1, Slc2A3, Slc2A4, Slc2A5 and AdipoR2 genes, and higher mRNA levels of ObRa, and ObRb genes. mRNA levels of Slc2A3, Slc2A4 and Slc2A5 genes in EmbHFD females were significantly reduced, but mRNA levels of ObRa, and ObRb were significantly increased compared to the NFD males. In the liver, the mRNA levels of the selected markers were measured by qPCR and normalized to Pgk1 and Tbp and to Fbxw2, Pak1lp1 and Ap3d1 in the hippocampus. Data were analysed by multilevel random effects regression and shown as dot plots with mean and SEM (A, B, C, and D). NFD, n = 6; EmbHFD, n = 6; HFD, n = 6 (A, B, C and D). NFD group (blue), EmbHFD group (green) and HFD group (red) at 26 weeks of age. Each animal belonged to a single litter. *P < 0.05, **P < 0.01, ***P < 0.001.
Figure 5
Figure 5
Maternal HFD and EmbHFD increase type-1 stem cell density in the male and female adult offspring hippocampus. A. Images of coronal SGZ sections analysed by GFAP (green top row), SOX2 (red second row), DAPI (blue third row), and merge (bottom row). B. In males, the HFD group had higher GFAP+/SOX2+ cell density in comparison to the NFD males. There is a significant difference between the EmbHFD males and the HFD males in the density of GFAP+/SOX2+, and GFAP-/SOX2+ cells. C. In females, the HFD group had higher GFAP+/SOX2+ cell density in comparison to the NFD females. There is a significant difference between the EmbHFD females and the HFD females in the density of GFAP+/SOX2+ cells. Hippocampal mRNA levels of Notch1, Sox2 and Pax6 were assessed, but no differences were observed in males in D or females in E. F. Total cell density quantified by DAPI staining showed in the HFD males an increase in the GCL and decrease in the SGZ compared to the NFD group, and there is a significant difference between the EmbHFD males and the HFD groups in the GCL and hilus. G. HFD females exhibited lower cell density in the GCL, and higher cell density in the Hilus compared to the NFD group, there was also a decrease in the cell density in the GCL in the EmbHFD females, and EmbHFD females and the HFD females in the hilus. NFD group (blue), EmbHFD group (green) and HFD group (red). Data were analysed by multilevel random effects regression and shown as dot plots with mean and SEM (A, B, C and D). NFD, n = 6; EmbHFD, n = 6; HFD, n = 6 (B, C, D, F and G). Each animal belonged to a single litter. GCL; granule cell layer; SGZ; subgranular zone Scale bars, 50 μm. The mRNA levels of the selected markers were analysed by qPCR and normalized to Fbxw2, Pak1lp1 and Ap3d1. *P < 0.05, **P < 0.01, ***P < 0.001.
Figure 6
Figure 6
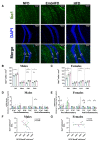
Maternal HFD and EmbHFD increase newborn neurons but decrease mature neurons in the male adult offspring hippocampus. A. Images of coronal DG sections analysed for DCX (red top row), NeuN (green second row), DAPI (blue third row), and merge (bottom row). B. In males, the density of newborn neurons (DCX+/NeuN–) and mature neurons (DCX–/NeuN+) in the HFD group was significantly different compared to the NFD group. EmbHFD males were significantly different from NFD males in the DCX–/NeuN+ cells. C. The density of cells in females did not change significantly between the diet groups, D. In HFD males the relative mRNA levels of Bdnf, and Psd95, were reduced when compared to the NFD males. EmbHFD males showed lower levels of Psd95 than NFD males. E. In HFD females, the Psd95 mRNA level was downregulated compared to the NFD females. NFD group (blue), EmbHFD group (green) and HFD group (red). Data were analysed by multilevel random effects regression and shown as dot plots with mean and SEM, (NFD, n = 6; EmbHFD, n = 6; HFD, n = 6, one animal per litter per sex), (B, C, D, and E). In the hippocampus, the mRNA levels of the selected markers were analysed by qPCR and normalized to Fbxw2, Pak1lp1 and Ap3d1. Scale bars, 50 μm. *P < 0.05, ***P < 0.001.
Figure 7
Figure 7
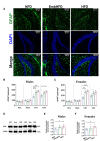
GFAP astrocytic density is increased by maternal HFD and EmbHFD in the male and female adult offspring hippocampus. A. Coronal sections with DAPI staining (blue, top row); Positive Astrocytes for GFAP (green, middle row) merged channels for GFAP+/DAPI+ cells (bottom row) in the hippocampus of mice from the different maternal diet groups. B. In males, the density of GFAP+ cells in the CA1 region was increased in HFD and EmbHFD compared to the NFD males, and the CA3 region in the HFD compared to the NFD males. C. In females, the number of GFAP+ cells was increased in HFD and EmbHFD in the CA1 region compared to the NFD females. D. Representative Western Blot used for the analysis of GFAP detected as a band at 48 kDa (top band) and GAPDH (bottom band) at 37 kDa. (SeeSupplementary Fig. 3for uncropped blots). E. In males, the protein expression levels of GFAP were higher in the HFD group compared to the NFD group. F. In females, the HFD group showed higher protein expression levels of GFAP compared to the NFD group. NFD group (blue), EmbHFD group (green) and HFD group (red) at 26 weeks of age. Data were analysed by multilevel random effects regression and shown as dot plots with mean and SEM, (NFD, n = 6; EmbHFD, n = 6; HFD, n = 6), (B, C, D and E). Each animal belonged to a single litter. The scale bar represents 200 μm. *P < 0.05, **P < 0.01, ***P < 0.001, ****P ≤ 0.0001.
Figure 8
Figure 8
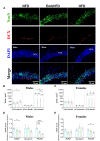
Maternal HFD and EmbHFD increase hippocampal microglial density in the male and female adult offspring. A. Coronal hippocampal sections stained with DAPI (blue, top row); Iba1 as a marker for microglia cells (green middle row), and double staining Iba1+/DAPI+ (bottom row). B. In males, there were differences in the density of Iba1+ cells in the DG, CA1 and CA3 in the HFD group, and CA1 and CA3 in the EmbHFD group compared to the NFD group. C. In females, there were differences in the density of Iba1+ cells in the DG, CA1 and CA3 in the HFD group, and DG and CA1 in the EmbHFD group compared to the NFD group. D. In males, the mRNA levels of the Il-4 gene were significantly decreased in the HFD group compared to the NFD group. E. In females, the mRNA levels of the Il-b gene were significantly increased in the EmbHFD group compared to the NFD group. The mRNA levels of Il-4, Il-10 and Tgfβ genes were significantly decreased in the HFD compared to the NFD group, and EmbHFD females were significantly different from HFD females in the mRNA levels of the Il-4 gene. F. There is a negative correlation between the number of mature neurons (DCX–/NeuN+) and the number of microglia cells in males, but not females (G). Data were analysed by multilevel random effects regression and shown as dot plots with mean and SEM (B, C, D and E). Data were analysed by Pearson’s correlation between a number of Iba1+ cells and the number of DCX/NeuN+ cells in the GCL (F and G) and shown as dot plot correlation analysis. Each animal belonged to a single litter NFD group (blue), EmbHFD group (green) and HFD group (red) at 26 weeks of age. (NFD, n = 6; EmbHFD, n = 6; HFD, n = 6). The scale bar represents 100μm. The mRNA levels of the selected markers were analysed by qPCR and normalized to Fbxw2, Pak1lp1 and Ap3d1. The scale bar represents 200 μm. *P < 0.05, **P < 0.01, ***P < 0.001, ****P ≤ 0.0001.

Similar articles

Cited by

References

    1. Budreviciute A, Damiati S, Sabir DK, et al. . Management and prevention strategies for non-communicable diseases (NCDs) and their risk factors. Front Public Health. 2020;8:574111. - PMC - PubMed
    1. Collaborators GBDRF . Global, regional, and national comparative risk assessment of 84 behavioural, environmental and occupational, and metabolic risks or clusters of risks for 195 countries and territories, 1990-2017: A systematic analysis for the global burden of disease study 2017. Lancet. 2018;392(10159):1923–1994. - PMC - PubMed
    1. Bianco-Miotto T, Craig JM, Gasser YP, van Dijk SJ, Ozanne SE. Epigenetics and DOHaD: From basics to birth and beyond. J Dev Orig Health Dis. 2017;8(5):513–519. - PubMed
    1. Barker DJ. The origins of the developmental origins theory. J Intern Med. 2007;261(5):412–417. - PubMed
    1. Gluckman PD, Hanson MA. Developmental origins of disease paradigm: A mechanistic and evolutionary perspective. Pediatr Res. 2004;56(3):311–317. - PubMed

LinkOut - more resources