. 2023 Mar 24:16:1122308.
doi: 10.3389/fnmol.2023.1122308. eCollection 2023.

Impaired interactions of ataxin-3 with protein complexes reveals their specific structure and functions in SCA3 Ki150 model

Affiliations

Impaired interactions of ataxin-3 with protein complexes reveals their specific structure and functions in SCA3 Ki150 model

Piotr Piasecki et al. Front Mol Neurosci. .

Abstract

Spinocerebellar ataxia type 3 (SCA3/MJD) is a neurodegenerative disease caused by CAG expansion in mutant ATXN3 gene. The resulting PolyQ tract in mutant ataxin-3 protein is toxic to neurons and currently no effective treatment exists. Function of both normal and mutant ataxin-3 is pleiotropic by their interactions and the influence on protein level. Our new preclinical Ki150 model with over 150 CAG/Q in ataxin-3 has robust aggregates indicating the presence of a process that enhances the interaction between proteins. Interactions in large complexes may resemble the real-life inclusion interactions and was never examined before for mutant and normal ataxin-3 and in homozygous mouse model with long polyQ tract. We fractionated ataxin-3-positive large complexes and independently we pulled-down ataxin-3 from brain lysates, and both were followed by proteomics. Among others, mutant ataxin-3 abnormally interacted with subunits of large complexes such as Cct5 and 6, Tcp1, and Camk2a and Camk2b. Surprisingly, the complexes exhibit circular molecular structure which may be linked to the process of aggregates formation where annular aggregates are intermediate stage to fibrils which may indicate novel ataxin-3 mode of interactions. The protein complexes were involved in transport of mitochondria in axons which was confirmed by altered motility of mitochondria along SCA3 Ki150 neurites.

Keywords: CAG; SCA3; aggregates; ataxin-3; interactions; mouse mitochondria; neurodegeneration; polyQ.


Conflict of interest statement

The authors declare that the research was conducted in the absence of any commercial or financial relationships that could be construed as a potential conflict of interest.

Figures

Figure 1
Figure 1
A new Ki150 mouse model expressing ataxin-3 with a large polyQ domain. Generation of the preclinical-type Ki150 mouse model with enhanced phenotype. (A) Homozygous Ki150 brain contains the polyQ-expanded ataxin-3 which reaches approximately 100 kDa in weight on immunoblot. The number of glutamines in ataxin-3 proteins is indicated in Ki150. LaminB was used as a loading control. (B) Representative examples of increasing CAG number in alleles of parents vs. offspring in humanized ATXN3 gene between Ki91 and Ki150 mouse models. (C) Analysis of the CAG number (96 and 153–163 CAGs) in alleles visible on peeks representing the capillary electrophoresis of the DNA PCR products. Male and female denote parent animals containing the indicated CAG number in ATXN3 of parents’ allele. The “litter” denote the individual offspring mice with the CAG number of the final longest allele.
Figure 2
Figure 2
Ataxin-3-positive inclusions appear across the whole brain in SCA3 mouse model. (A) cerebellum (cere), (B) cerebral cortex (ctx), (C) hippocampus (hipp) (D) striatum (str). (E) Aggrecount imageJ macro identified about 400 inclusions per square millimeter in cerebellum, 800 inclusions per square millimeter in cerebral cortex, 3,000 inclusions per square millimeter in hippocampus and 760 inclusions per square millimeter in striatum (n = 4). (F) The density of a single inclusion was also the highest in the hippocampus (median = 2,298) as compared to cortex (median = 1969), cerebellum (median = 1727), and striatum (median = 0.382). Two-sample t-test (*p < 0.05, **p < 0.01, ***p < 0.001, ****p < 0.0001), error bars: SEM (n = 4 indicates 4 brains/4 mice. Per brain, 3 slices as technical replicates were used. Total number of 12 images were used for estimation of each brain region).
Figure 3
Figure 3
A progressive motor decline in Ki50 SCA3 knock-in model presents fast and severe phenotype. In the elevated beam walk test (A,B) “time to turn” and “traverse time” were measured on six rods with decreasing diameter (diameter of rods are indicated by Ø in mm). (A) One-month-old animals needed more time to turn on the rod 6 representing the highest level of difficulty and with disease progression more rods presented a challenge to Ki150 mice; Ultimately, at the age of 8 months Ki150 mice needed more time to traverse on all rods. (B) Similarly to the “time to turn” 1-month-old Ki91 mice needed significantly more time to traverse on rod 6, but also 1, whereas older 8-month-old mice needed more time on all rods. (C) Motor incoordination in accelerated rotarod (4–40 rpm in 5 min) was presented by Ki150 already at the age of 1 month. (D) In the scoring test, 5-month-old Ki150 mice presented SCA3 phenotype: incoordination, gait disturbances, kyphosis, and hind limb clasping. (E) The reduction of body weight gain in Ki150 was observed at the age of 8-month. Two-way ANOVA for every test besides body weight was p < 0.001. Two-way ANOVA with Bonferroni post hoc test (p ≤ 0.05; total number of biological replicates: n = 16, n = 8 per genotype), error bars: SEM. Asterisks denotes a two-way ANOVA (*p < 0.05, **p < 0.01, ***p < 0.001).
Figure 4
Figure 4
Ataxin-3 is distributied in large protein complexes after chromatographic fractionation. (A) Whole brain lysates after fractionation using size exclusion chromatography (SEC). Protein complexes were separated on the basis of their size (in the range of 600–22 kDa) and divided into 31 fractions. Dot blots were probed with an anti-ataxin-3 antibody. The signal indicates the distribution of ataxin-3 among the fractions of the protein complexes in Ki21 and Ki150 protein complexes. (B) Ponceau-stained vacuum dot blot of protein fractions corresponding to the size range >600–22 kDa. (C) Based on the dot blot results, we can distinguish 3 peaks; the first (>600 kDa), the second (248–192 kDa), and the third (115-89 kDa). In the third peak (115–89 kDa) the level of mutant ataxin-3 in Ki150 brains is significantly lower than in the control Ki21 brain lysates. Two-sample t-test (*p < 0.05, **p < 0.01, ***p < 0.001), error bars: SEM total number of biological replicates: n = 6, n = 3 per genotype.
Figure 5
Figure 5
The networks of proteins composing complexes with ataxin-3 identified by ion exchange chromatography (IEC) and size using size exclusion chromatography (SEC) followed by LC–MS/MS. The networks were generated using String database and clustering (STRING Network p < 10e-16) ( https://string-db.org/ ). (A) The fraction 282–218 kDa contains highly downregulated Camk2a, CamK2b, proteins belonging to Chaperon Containing TCP1-complex, and proteins being part of the adaptor protein 2 complexes. (B) In the fraction 115–89 kDa proteins responsible for the translation initiation process: Hnrnpk and Eif4a2 were highly enriched in the Ki150 brains. Proteins characteristic for the GABAergic neurons Gad2, Calb2 and Pcp2 were also altered. N = 3.
Figure 6
Figure 6
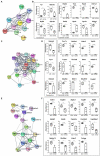
IP-LC–MS/MS proteomic analysis of ataxin-3 partners reveals 3 sets of proteins with significantly weakened interaction with the mutant ataxin-3 in the Ki150 SCA3/MJD cerebellum and cortex. The network of proteins displaying weakened interaction with the ataxin-3 containing expanded polyQ tract in the cerebellum (A,C) and cerebral cortex (A,C,E) of Ki50 mice were generated using String database and clustering (STRING Network p < 10e-16) (https://string-db.org/). Diagrams demonstrate relative levels of proteins after their pull-down and proteomic analysis (Ki150 vs. Ki21) reflecting the change or even complete loss of protein interaction with mutant vs. normal ataxin-3 in the cerebellum and cerebral cortex (B,D,F; p < 0.05; two-sample t-test). (A,B) The first cluster contained proteins related to the translation in the cerebellum and cerebral cortex. (C,D) The mutant ataxin-3 demonstrated very weak interactions with mitochondrial proteins (second cluster) in the Ki150 cerebellum and Ki150 cerebral cortex. (E,F) The third set of proteins with diminished interaction with mutant ataxin-3 (150 CAG repeats) in the cerebral cortex is involved in mitochondrial transport. Two-sample t-test (p ≤ 0.05; *p < 0.05, **p < 0.01, ***p < 0.001); total number of biological replicates: n = 8, n = 4 per genotype; error bars: SEM.
Figure 7
Figure 7
Transport of mitochondria is slower in neurites of SCA3 cerebellar neurons in vitro. (A) Representative kymographs of mitochondrial transport in primary cerebellar neurons and pictures of mitochondria size. (B) The average velocity (calculated as travelling distance/time) in the anterograde direction (from soma) was significantly lower in Ki150 neurites in comparison to WT. (C) The average velocity (calculated as travelling distance/time) in the retrograde direction (toward soma) was significantly lower in both Ki91 and Ki150 neurites in comparison to WT. (D) The ratio of mitochondria moving retrogradely to mitochondria moving anterogradely is lower in Ki91 neurites compared to WT. (E) The number of moving mitochondria is significantly lower in both Ki91 and Ki150 neurites as compared to WT. (F) The number of mitochondria per neurite length was not changed. (G) The circularity of mitochondria indicating fusion/fission events is not altered. (H) The average area of mitochondria is approximately the same in all tested groups. (I) The size distribution of mitochondria in Ki91 and Ki 150 cerebellar neurons is comparable to WT. All parameters were quantified using ImageJ. The measurements were from 3 independent experiments, with 15–25 cells analyzed each time. Two-sample t-test (*p < 0.05, **p < 0.01, ***p < 0.001), error bars: SEM.

Similar articles

Cited by

References

    1. Antonicka H., Lin Z.-Y., Janer A., Aaltonen M. J., Weraarpachai W., Gingras A.-C., et al. . (2020). A high-density human mitochondrial proximity interaction network. Cell Metab. 32, 479–497.e9. doi: 10.1016/j.cmet.2020.07.017, PMID: - DOI - PubMed
    1. Balaban R. S., Nemoto S., Finkel T. (2005). Mitochondria, oxidants, and aging. Cells 120, 483–495. doi: 10.1016/j.cell.2005.02.001 - DOI - PubMed
    1. Bettencourt C., Lima M. (2011). Machado-Joseph disease: from first descriptions to new perspectives. Orphanet J. Rare Dis. 6:35. doi: 10.1186/1750-1172-6-35, PMID: - DOI - PMC - PubMed
    1. Brault M. L., Petit J. D., Immel F., Nicolas W. J., Glavier M., Brocard L., et al. . (2019). Multiple C2 domains and transmembrane region proteins (MCTPs) tether membranes at plasmodesmata. EMBO Rep. 20:e47182. doi: 10.15252/embr.201847182, PMID: - DOI - PMC - PubMed
    1. Breuer A. C., Atkinson M. B. (1988). Calcium dependent modulation of fast axonal transport. Cell Calcium 9, 293–301. doi: 10.1016/0143-4160(88)90010-3, PMID: - DOI - PubMed

LinkOut - more resources