. 2023 Apr 3:11:e14944.
doi: 10.7717/peerj.14944. eCollection 2023.

The honest sound of physical effort

Affiliations

The honest sound of physical effort

Andrey Anikin. PeerJ. .

Abstract

Acoustic correlates of physical effort are still poorly understood, even though effort is vocally communicated in a variety of contexts with crucial fitness consequences, including both confrontational and reproductive social interactions. In this study 33 lay participants spoke during a brief, but intense isometric hold (L-sit), first without any voice-related instructions, and then asked either to conceal their effort or to imitate it without actually performing the exercise. Listeners in two perceptual experiments then rated 383 recordings on perceived level of effort (n = 39 listeners) or categorized them as relaxed speech, actual effort, pretended effort, or concealed effort (n = 102 listeners). As expected, vocal effort increased compared to baseline, but the accompanying acoustic changes (increased loudness, pitch, and tense voice quality) were under voluntary control, so that they could be largely suppressed or imitated at will. In contrast, vocal tremor at approximately 10 Hz was most pronounced under actual load, and its experimental addition to relaxed baseline recordings created the impression of concealed effort. In sum, a brief episode of intense physical effort causes pronounced vocal changes, some of which are difficult to control. Listeners can thus estimate the true level of exertion, whether to judge the condition of their opponent in a fight or to monitor a partner's investment into cooperative physical activities.

Keywords: Effort; Voice; Honest signals; Speech; Vocal communication.


Conflict of interest statement

The author declares that he has no competing interests.

Figures

Figure 1
Figure 1. Stimuli and manipulations.
Recording conditions (above) and the manipulation intended to mimic vocal tremor (below) by speaker “cag” (audio in supplements). The shown example of tremor manipulation was among the more noticeable perceptually and had the strongest effect on the ratings of perceived effort compared to other stimuli. Spectrograms with a 50 ms Gaussian window and frequency on a bark scale.
Figure 2
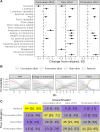
Figure 2. Voice production: acoustic correlates of actual physical effort.
(A) Some acoustic changes are shared by real and pretended effort, indicating that they are under voluntary control, whereas others are shared by real and concealed effort, suggesting that they are difficult to suppress. Multivariate Gaussian mixed model predicting change in 19 vocal features as a function of condition after controlling for speaker sex and recording channel, with a random intercept per speaker. Shown: difference between each condition and baseline, in SD (median of posterior distribution and 95% CI), grayed out if <99% of posterior distribution was either positive or negative. (B) Independent predictors of physical effort include loudness, pitch, and measures of voice quality. Categorical multiple regression predicting condition from 19 acoustic characteristics and speaker sex; only predictors with a robust effect of at least 25% on at least one category are shown. X = standardized value of an acoustic predictor holding all other predictors at their mean values; Y = fitted probability of each outcome category (median of posterior distribution and 95% CI). For example, other things being equal, the probability of classifying a recording as pretended effort sharply increases with its pitch and energy in harmonics. (C) Confusion matrix of a Random Forest model for predicting condition from 19 acoustic characteristics, shown as the median (% per category) and 95% coverage interval from 1000 simulations. Gray = chance level (25%), blue = below chance, yellow = above chance. N = 319 recordings.
Figure 3
Figure 3. Perception of effort in the voice: continuous ratings.
(A–B) Ratings of perceived effort increased when speakers engaged in real or pretended effort, or when a small amount of vocal instability was added to the relaxed recordings (tremor). Multilevel beta regression modeling ratings in individual trials as a function of recording condition, allowing the effect of condition to vary across speakers and assigning group-levels intercepts to each speaker and sound. Shown: fitted value per condition (A) and contrasts from baseline (B) as medians of posterior distribution and 95% CIs; violin plots show the distribution of effects across listeners. (C) Acoustic predictors of effort ratings included higher pitch and more energy in harmonics. Multilevel beta regression modeling effort ratings as a function of speaker sex and 19 acoustic variables with group-level intercepts for each speaker, listener, and sound. Shown: predicted change in effort rating, on a scale of 0 to 1, when changing one acoustic variable at time by 1 SD and keeping all other variables constant (median of posterior distribution and 95% CI), grayed out if <99% of posterior distribution was either positive or negative. N = 3860 ratings of 383 recordings by 39 listeners.
Figure 4
Figure 4. Perception of effort in the voice: forced-choice classification.
(A) Confusion matrix of listeners’ classifications, with proportions of responses within each true category shown in % (medians of posterior distributions and 95% CI). Categorical multilevel regression predicting the chosen response category as a function of recording condition, allowing the effect of condition to vary across listeners and with group-level intercepts for each speaker and recording. Gray = chance level (25%), blue = below chance, yellow = above chance. (B) Classification of recordings as a function of their acoustic characteristics. Predicted relative probabilities of the four response categories from a multilevel categorical model predicting response from speaker sex and 19 acoustic variables, with group-level intercepts for each listener. Shown: partial effects of normalized acoustic predictors that reliably changed the probability of any category by at least 25% over the observed range of each predictor (medians of posterior distributions and 95% CIs). N = 10099 classifications of 383 recordings by 102 listeners.

References

    1. Ackermann H, Hage SR, Ziegler W. Brain mechanisms of acoustic communication in humans and nonhuman primates: an evolutionary perspective. Behavioral and Brain Sciences. 2014;37:529. doi: 10.1017/S0140525X13003099. - DOI - PubMed
    1. Anikin A. Soundgen: an open-source tool for synthesizing nonverbal vocalizations. Behavior Research Methods. 2019;51:778–792. doi: 10.3758/s13428-018-1095-7. - DOI - PMC - PubMed
    1. Anikin A, Lima CF. Perceptual and acoustic differences between authentic and acted nonverbal emotional vocalizations. Quarterly Journal of Experimental Psychology. 2018;71:622–641. - PubMed
    1. Anikin A, Persson T. Nonlinguistic vocalizations from online amateur videos for emotion research: a validated corpus. Behavior Research Methods. 2017;49:758–771. doi: 10.3758/s13428-016-0736-y. - DOI - PubMed
    1. Anikin A, Reby D. Ingressive phonation conveys arousal in human nonverbal vocalizations. Bioacoustics. 2022;31:680–695. doi: 10.1080/09524622.2022.2039295. - DOI

Publication types