

Inference of differentially expressed genes using generalized linear mixed models in a pairwise fashion
- PMID: 37033732
- PMCID: PMC10078460
- DOI: 10.7717/peerj.15145
Inference of differentially expressed genes using generalized linear mixed models in a pairwise fashion
Abstract
Background: Technological advances involving RNA-Seq and Bioinformatics allow quantifying the transcriptional levels of genes in cells, tissues, and cell lines, permitting the identification of Differentially Expressed Genes (DEGs). DESeq2 and edgeR are well-established computational tools used for this purpose and they are based upon generalized linear models (GLMs) that consider only fixed effects in modeling. However, the inclusion of random effects reduces the risk of missing potential DEGs that may be essential in the context of the biological phenomenon under investigation. The generalized linear mixed models (GLMM) can be used to include both effects.
Methods: We present DEGRE (Differentially Expressed Genes with Random Effects), a user-friendly tool capable of inferring DEGs where fixed and random effects on individuals are considered in the experimental design of RNA-Seq research. DEGRE preprocesses the raw matrices before fitting GLMMs on the genes and the derived regression coefficients are analyzed using the Wald statistical test. DEGRE offers the Benjamini-Hochberg or Bonferroni techniques for P-value adjustment.
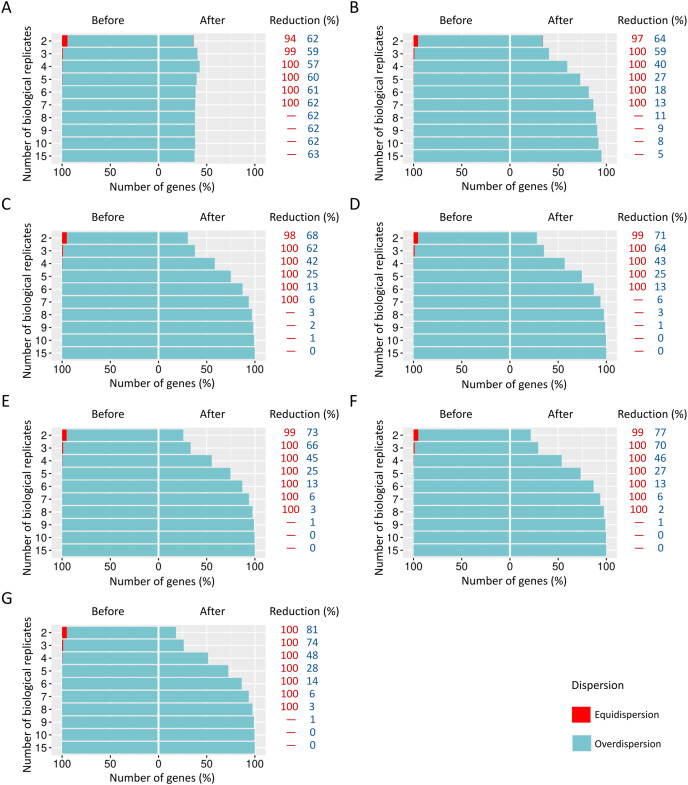
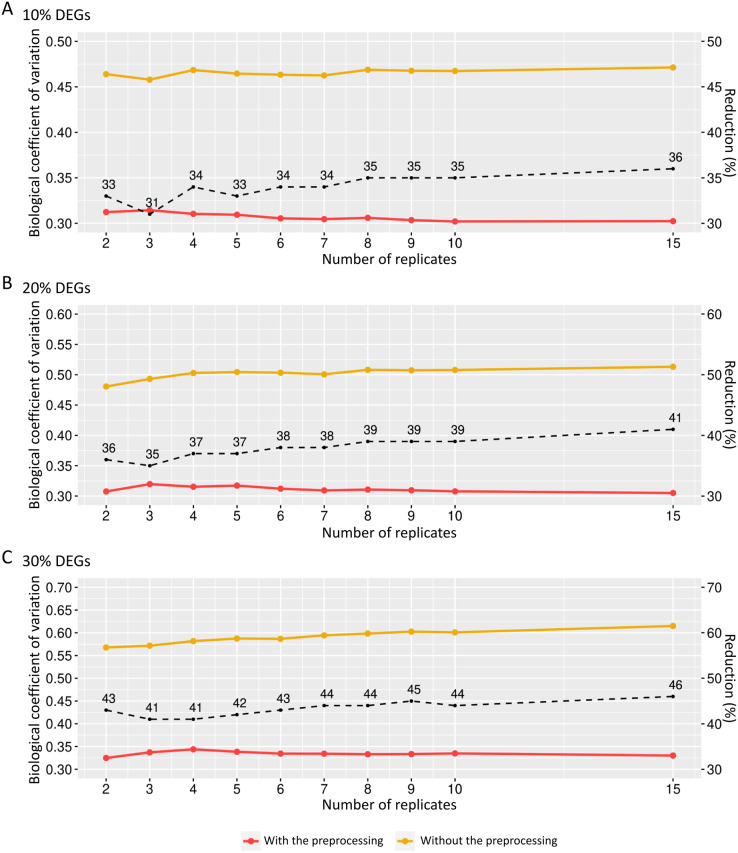
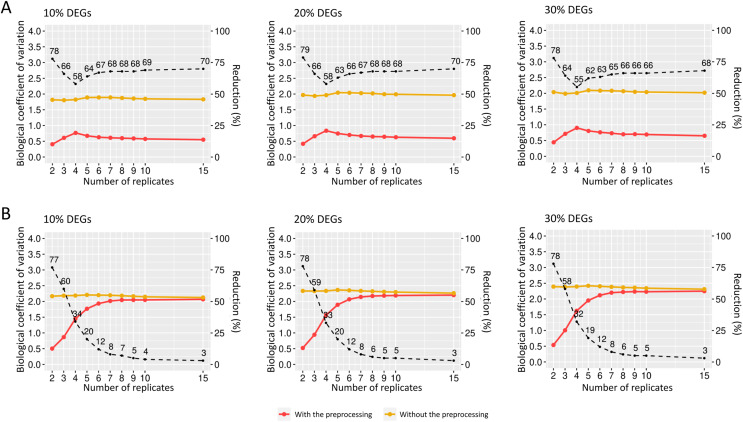
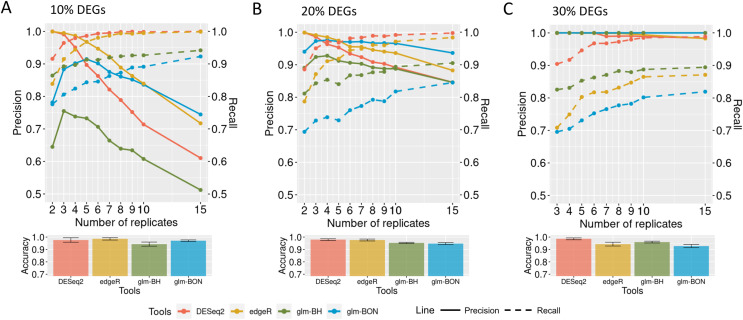
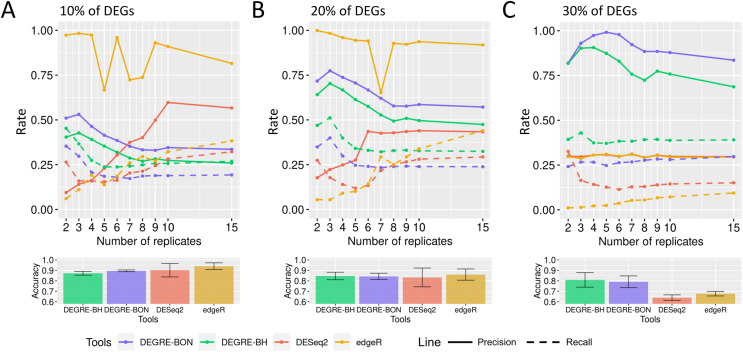
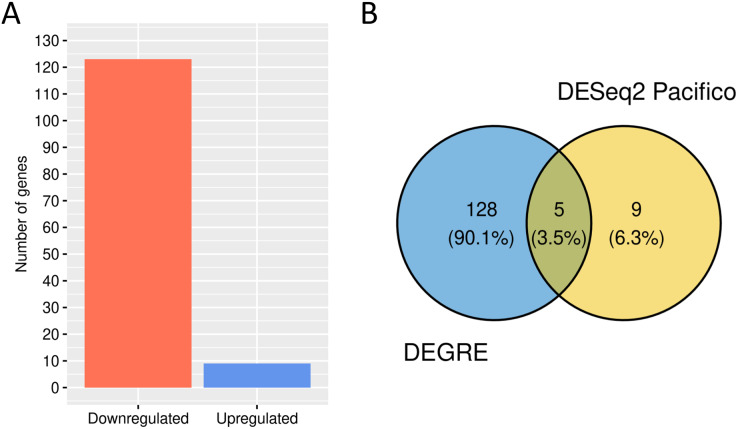
Results: The datasets used for DEGRE assessment were simulated with known identification of DEGs. These have fixed effects, and the random effects were estimated and inserted to measure the impact of experimental designs with high biological variability. For DEGs' inference, preprocessing effectively prepares the data and retains overdispersed genes. The biological coefficient of variation is inferred from the counting matrices to assess variability before and after the preprocessing. The DEGRE is computationally validated through its performance by the simulation of counting matrices, which have biological variability related to fixed and random effects. DEGRE also provides improved assessment measures for detecting DEGs in cases with higher biological variability. We show that the preprocessing established here effectively removes technical variation from those matrices. This tool also detects new potential candidate DEGs in the transcriptome data of patients with bipolar disorder, presenting a promising tool to detect more relevant genes.
Conclusions: DEGRE provides data preprocessing and applies GLMMs for DEGs' inference. The preprocessing allows efficient remotion of genes that could impact the inference. Also, the computational and biological validation of DEGRE has shown to be promising in identifying possible DEGs in experiments derived from complex experimental designs. This tool may help handle random effects on individuals in the inference of DEGs and presents a potential for discovering new interesting DEGs for further biological investigation.
Keywords: DEGRE package; Differentially expressed genes; Gene dispersion; Generalized linear mixed model; Preprocessing; Random effects.
© 2023 Terra Machado et al.
Conflict of interest statement
The authors declare that they have no competing interests.
Figures
References
-
- Akbarian F, Tabatabaiefar MA, Shaygannejad V, Shahpouri MM, Badihian N, Sajjadi R, Dabiri A, Jalilian N, Noori-Daloii MR. Upregulation of MTOR, RPS6KB1, and EIF4EBP1 in the whole blood samples of Iranian patients with multiple sclerosis compared to healthy controls. Metabolic Brain Disease. 2020;35(8):1309–1316. doi: 10.1007/s11011-020-00590-7. - DOI - PubMed
-
- Beech RD, Lowthert L, Leffert JJ, Mason PN, Taylor MM, Umlauf S, Lin A, Lee JY, Maloney K, Muralidharan A, Lorberg B, Zhao H, Newton SS, Mane S, Epperson CN, Sinha R, Blumberg H, Bhagwagar Z. Increased peripheral blood expression of electron transport chain genes in bipolar depression. Bipolar Disorders. 2010;12(8):813–824. doi: 10.1111/j.1399-5618.2010.00882.x. - DOI - PMC - PubMed
-
- Benjamini Y, Hochberg Y. Controlling the false discovery rate: a practical and powerful approach to multiple testing. Journal of the Royal Statistical Society: Series B (Methodological) 1995;57(1):289–300. doi: 10.1111/j.2517-6161.1995.tb02031.x. - DOI
Publication types
MeSH terms
LinkOut - more resources
Full Text Sources
Other Literature Sources
