. 2023 Mar 20;7(2):67-78.
doi: 10.1093/evlett/qrad009. eCollection 2023 Apr 1.

Condition dependence and the paradox of missing plasticity costs

Affiliations

Condition dependence and the paradox of missing plasticity costs

Stephen P De Lisle et al. Evol Lett. .

Abstract

Phenotypic plasticity plays a key role in adaptation to changing environments. However, plasticity is neither perfect nor ubiquitous, implying that fitness costs may limit the evolution of phenotypic plasticity in nature. The measurement of such costs of plasticity has proved elusive; decades of experiments show that fitness costs of plasticity are often weak or nonexistent. Here, we show that this paradox could potentially be explained by condition dependence. We develop two models differing in their assumptions about how condition dependence arises; both models show that variation in condition can readily mask costs of plasticity even when such costs are substantial. This can be shown simply in a model where plasticity itself evolves condition dependence, which would be expected if costly. Yet similar effects emerge from an alternative model where trait expression itself is condition-dependent. In this more complex model, the average condition in each environment and genetic covariance in condition across environments both determine when costs of plasticity can be revealed. Analogous to the paradox of missing trade-offs between life history traits, our models show that variation in condition can mask costs of plasticity even when costs exist, and suggest this conclusion may be robust to the details of how condition affects trait expression. Our models suggest that condition dependence can also account for the often-observed pattern of elevated plasticity costs inferred in stressful environments, the maintenance of genetic variance in plasticity, and provides insight into experimental and biological scenarios ideal for revealing a cost of phenotypic plasticity.

Keywords: GxE; condition dependence; life history trade-off; phenotypic plasticity.


Figures

Figure 1.
Figure 1.
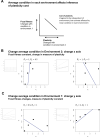
Panel (A) illustrates the manifestation of a cost of plasticity when plasticity or trait expression is condition-independent, in which genotypes that have greater plasticity pay a fitness cost in the focal environment (controlling for trait expression in the focal environment) compared to less-plastic genotypes due to the cost of genotype plasticity. Panel (B) illustrates how fixed genotypic costs of plasticity can be masked by variance in condition. In this case, differences in trait expression in environment 2, and thus differences in phenotype plasticity between genotypes, are the result of variance in condition. In this case a cost of plastic resource allocation would not be measured at the level of trait expression, even if such a cost exists. In this figure, we have illustrated the case where fitness effects of variation in trait expression in the focal environment have been controlled for; e.g., as would be the case in a multiple regression.
Figure 2.
Figure 2.
Two models for how condition may affect differential trait expression in multiple environments. In (A), Model I, the total pool of resources available, R, which we call condition, is correlated with both fitness components and the degree of costly plasticity that is expressed. We note that this model is agnostic to the exact developmental causality of condition dependence, and assumes only the existence of a relationship between these components. Variance in condition can mask costs of plasticity, because in this case individuals that have high plasticity (and thus pay a high cost) will nonetheless have high fitness despite the cost because condition also positively affects other fitness components. Panel (B), Model II, represents a model of condition-dependent trait expression in two environments, where a condition-independent cost of plasticity may be found in any difference in resource allocation across in environments (A1 vs. A2). Trait expression (z) is determined by condition (R), and allocation (A) in environments 1 and 2. Differences in resource acquisition and/or allocation across environments leads to differential trait expression across environments—phenotypic plasticity. In this model, we have assumed costs of plasticity arise when genotypes differ in resource allocation strategy (A) across environments. In this model, (co)variance in condition can mask costs of plasticity by generating variance in trait expression across the environments that is independent of variation in the costs paid. Note that for simplicity, we have not expanded these path diagrams to directly compare the complete path to fitness; rather to illustrate the differing roles of condition.
Figure 3.
Figure 3.
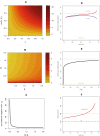
Effects of variation in condition on inference of plasticity costs under Model II, condition-dependent trait expression. Panels (A)–(C) show minimum values of plasticity cost that are required to generate a negative covariance between trait expression in one environment and fitness in another, cov(w1, z2). Panels (D)–(F) show inferences cost costs in a multiple regression controlling for the direct fitness effect of traits. (A) Strong positive genetic covariance in resource acquisition across environments makes it more difficult to detect costs, as the cost of plasticity must be higher to result in negative cov(w1, z2). Parameter values, a = 0.1, R¯1=R¯2=1, E1 = 0.2, E2 =.1, cov(a, b) = 0, var(a) = 1, var(b) = 1. Panels (B) and (C) illustrate the effects of average condition in each environment. Parameter values, B: a = 0.9, E1 = 0.2, E2 = 0.2, b = 0.2, cov(a, b) = 0, var(a) = 1, var(b) = 1, β = 0.2, cov(R1, R2) = 0.2; C: a = 0.9, R¯1= 1, E1 = 0.2, E2 = 0.2, b = 0.2, cov(a, b) = 0, var(a) = 1, var(b) = 1, β = 0.5, cov(R1, R2) = 0.2. In all panels (D)–(F), inferred cost is the partial regression coefficient β^2 from the multiple regression model w  β0+β1z1+β2z2. Panel (D) shows the inferred cost as a function of the covariance in resource acquisition, for the case where the focal environment is poor relative to the second environment (blue) and the case where the focal environment is high quality relative to the second environment (red). Panel (E) shows inferred cost as a function of the variance in resource acquisition (assumed equal across environments, with zero covariance). Panel (F) shows the case where costs of plastic resource allocation are high (−0.6), natural selection on the trait is weak, and covariance in resource acquisition is high. Dashed black line in panel (F) shows the expected evolutionary change in the allocation reaction norm in the focal environment, cov(w1, b). Green dashed line in panels (D) and (E) show the actual cost of the allocation reaction norm b, which was omitted in panel (F) for scale. In panel (D) inferred costs were calculated as the average of 1,000 partial regression coefficients computed numerically from a random sample of 100 individuals with bN(1, .5), aN(.5, .1), RN(2, 1,   1covcov 1) or N(1, 2,   1covcov 1),   for each value of cov, assuming β = 0.5, E1 = 1, and E2 = 2. Calculations in panel E were equivalent except RN(1, 1,   1 00 1). In panel (F), β = 0.2.
Figure 4.
Figure 4.
Quality of both environments determines inference of costs of plasticity under Model II, where trait expression is condition-dependent. Panel (A) shows how average condition in the focal and second environment affect fitness in the focal environment and the estimate of plasticity, respectively, which are the y and x axes determining cov(w1, z2), which is used to infer the cost of plasticity. Panel (B) shows how changes in mean condition in environment 2 affect this covariance; under a constant fixed cost of plasticity and assuming the same sample of genetic variants for b, a, and R-R¯, increasing R¯ in environment 2 leads to the inference of more costly plasticity. Panel (C) shows the affects of changing R¯ in the focal environment for the same set of genetic variants as in panel (B); increasing R¯ in environment 1 makes costs more difficult to reveal. Inset panels show individual norms of reaction for each genotype. Blue line is the partial regression coefficient for z2 from a multiple regression controlling for z1.

Similar articles

Cited by

References

    1. Agrawal, A. A. (2001). Phenotypic plasticity in the interactions and evolution of species. Science, 294(5541), 321–326. 10.1126/science.1060701 - DOI - PubMed
    1. Agrawal, A. A., Conner, J. K., Johnson, M. T. J., & Wallsgrove, R. (2002). Ecological genetics of an induced plant defense against herbivores: Additive genetic variance and costs of phenotypic plasticity. Evolution, 56(11), 2206–2213. 10.1111/j.0014-3820.2002.tb00145.x - DOI - PubMed
    1. Anichini, M., Rebrina, F., Reinhold, K., & Lehmann, G. U. C. (2019). Adaptive plasticity of bushcricket acoustic signalling in socially heterogeneous choruses. Animal Behaviour, 158, 139–148.
    1. Auld, J. R., Agrawal, A. A., & Relyea, R. A. (2010). Re-evaluating the costs and limits of adaptive phenotypic plasticity. Proceedings of the Royal Society B: Biological Sciences, 277, 503–511. - PMC - PubMed
    1. Bohrnstedt, G. W., & Goldberger, A. S. (1969). On the exact covariance of products of random variables. Journal of the American Statistical Association, 64, 1439–1442.