. 2023 Mar 24:14:1086433.
doi: 10.3389/fimmu.2023.1086433. eCollection 2023.

Non-viral TRAC-knocked-in CD19KICAR-T and gp350KICAR-T cells tested against Burkitt lymphomas with type 1 or 2 EBV infection: In vivo cellular dynamics and potency

Affiliations

Non-viral TRAC-knocked-in CD19KICAR-T and gp350KICAR-T cells tested against Burkitt lymphomas with type 1 or 2 EBV infection: In vivo cellular dynamics and potency

Tobias Braun et al. Front Immunol. .

Abstract

Introduction: The ubiquitous Epstein-Barr virus (EBV) is an oncogenic herpes virus associated with several human malignancies. EBV is an immune-evasive pathogen that promotes CD8+ T cell exhaustion and dysregulates CD4+ T cell functions. Burkitt lymphoma (BL) is frequently associated with EBV infections. Since BL relapses after conventional therapies are difficult to treat, we evaluated prospective off-the-shelf edited CAR-T cell therapies targeting CD19 or the EBV gp350 cell surface antigen.

Methods: We used CRISPR/Cas9 gene editing methods to knock in (KI) the CD19CAR.CD28z or gp350CAR.CD28z into the T cell receptor (TCR) alpha chain (TRAC) locus.

Results: Applying upscaled methods with the ExPERT ATx® MaxCyte system, KI efficacy was ~20% of the total ~2 × 10⁸ TCR-knocked-out (KO) generated cells. KOTCRKICAR-T cells were co-cultured in vitro with the gp350+CD19+ BL cell lines Daudi (infected with type 1 EBV) or with Jiyoye (harboring a lytic type 2 EBV). Both types of CAR-T cells showed cytotoxic effects against the BL lines in vitro. CD8+ KICAR-T cells showed higher persistency than CD4+ KICAR-T cells after in vitro co-culture with BL and upregulation of the activation/exhaustion markers PD-1, LAG-3, and TIM-3. Two preclinical in vivo xenograft models were set up with Nod.Rag.Gamma mice injected intravenously (i.v.) with 2 × 10⁵ Daudi/fLuc-GFP or with Jiyoye/fLuc-GFP cells. Compared with the non-treated controls, mice challenged with BL and treated with CD19KICAR-T cells showed delayed lymphoma dissemination with lower EBV DNA load. Notably, for the Jiyoye/fLuc-GFP model, almost exclusively CD4+ CD19KICAR-T cells were detectable at the endpoint analyses in the bone marrow, with increased frequencies of regulatory T cells (Tregs) and TIM-3+CD4+ T cells. Administration of gp350KICAR-T cells to mice after Jiyoye/GFP-fLuc challenge did not inhibit BL growth in vivo but reduced the EBV DNA load in the bone marrow and promoted gp350 antigen escape. CD8+PD-1+LAG-3+ gp350KICAR-T cells were predominant in the bone marrow.

Discussion: The two types of KOTCRKICAR-T cells showed different therapeutic effects and in vivo dynamics. These findings reflect the complexities of the immune escape mechanisms of EBV, which may interfere with the CAR-T cell property and potency and should be taken into account for future clinical translation.

Keywords: Burkitt lymphoma; CAR-T cell; CRISPR-Cas; EBV; gene editing; lymphoma; off-the-shelf; xenograft model.


Conflict of interest statement

Author AR-M is employed by MaxCyte Inc., MD, USA. Author RS has filed a patent application for generation of CAR-T cells targeting lytic herpes infections and is a founding shareholder and scientific consultant of BioSyngen/Zelltechs Lpt Ltd. Author DW has filed multiple patent applications on CRISPR-Cas gene editing and adoptive T cell therapy. The remaining authors declare that the research was conducted in the absence of any commercial or financial relationships that could be construed as a potential conflict of interest.

Figures
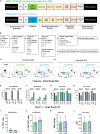
Figure 1
Figure 1
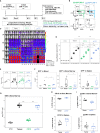
Generation of gene-edited TCRKOCARKI-T cells. (A) Homology-directed DNA repair templates (HDRTs) containing the 5′ homology arms for the TRAC locus, a P2A element, a signal peptide (SP), the single-chain variable fragments (scFvs) for targeting the CAR against CD19 (derived from FMC63 mAb) or against gp350 (derived from 7A1 mAb), the GS linker, the IgG4 hinge, the IgG CH3 element, the CD28 transmembrane domain (TMD), the CD28 endocytoplasmatic domain, the CD3 zeta signaling domain, the bovine growth hormone (bGH) sequence for polyadenylation of the RNA transcript, and the 3′ homology arms for the TRAC locus. (B) Schematic representation of the main steps in gene editing: T cell activation, electroporation and recovery, homeostatic expansions, quality control analyses via flow cytometry, cryopreservation/thawing, and in vitro and in vivo potency tests. (C, D) Representative example of a small-scale (SS; C) or large-scale (LS; D) production of gene-edited CD19KICAR-T and gp350KICAR-T cells analyzed by flow cytometry (x-axis: CAR; y-axis: CD3). Relative to the mock T cells (not receiving the HDRT), the edited CAR-T cells showed loss of CD3 expression and gain of CAR expression. The CD3CAR+ cells showed comparable frequencies of CD4+ and CD8+ cells. (E–H) Quantitative data for SC gene editing used with T cells obtained from three donors and analyzed on day 9 after initiation of cultures. (E) Reduced frequencies of CD3+ T cells as result of the TRAC knock-out (KO). (F) Frequencies of knock-in (KI) and expression of the CAR. (G) Recovery relative to cell input. (H) Final viable cell count on day 9. (I–L) Quantitative data for LS gene editing used as independent triplicates with T cells obtained from Donor 1 and analyzed on day 9 after initiation of cultures. (I) Reduced frequencies of CD3+ T cells as result of the TRAC KO. (J) Frequencies of KI and expression of the CAR. (K) Recovery relative to cell input. (L) Final viable cell count on day 9. Results for mock cells are depicted in black, CD19KICAR-T cells in green, and gp350KICAR-T cells in blue. The results represent cultures performed as independent triplicates not merged (E–H) or merged (I–L).
Figure 2
Figure 2
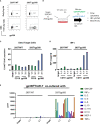
Specific recognition of gp350 on the cell surface by gp350KICAR-T cells. (A) Flow cytometry analyses of gp350 expression on the cell surface of 293T/WT and 293T/gp350 cell lines. Upper panels show cells stained only with the immune-conjugated secondary antibody. Lower panels show cells stained with the primary 7A1 monoclonal antibody and the secondary antibody. (B) Schematic representation of analyses of gp350KICAR-T cell specificity after co-culture with 293T/WT or 293T/gp350 cell lines at different effector-to-target (E:T) ratios. After 48 h of co-culture, the dead cells were detected by flow cytometry, and cytokines secreted in the medium supernatant were analyzed. (C) Quantified proportions of dead target cells. (D) Secreted IFN-γ (pg/ml) and (E) several cytokines detected in cell supernatants (pg/ml) after co-cultures at 1:1 and 3:1 E:T ratios. Data obtained with CD19KICAR-T cells with gp350KICAR-T cells are depicted in green and blue, respectively. The results represent a single assay.
Figure 3
Figure 3
CD19KICAR-T and gp350KICAR-T generated on a small scale recognized and killed Daudi/fLuc-GFP (EBV+ type 1) and Jiyoye/fLuc-GFP (EBV+ type 2) cell lines in vitro. (A) Left panels: flow cytometry analyses of Daudi/fLuc-GFP and Jiyoye/fLuc-GFP cell lines showing GFP+CD19+ cells. Right panels: specific expression of gp350 after staining with the anti-gp350 7A1 antibody, followed by staining with a conjugated secondary antibody, is shown for each target cell line. (B) More than 97% of the Daudi/fLuc-GFP and Jiyoye/fLuc-GFP cell lines express high levels of CD19, whereas within the CD19-positive cells, only subpopulations of Daudi/fLuc-GFP (61%) and Jiyoye/fLuc-GFP (29%) express variable levels of gp350. (C) Schematic representation for functional analyses of CD19KICAR-T and gp350KICAR-T cells after co-culture with Daudi/fLuc-GFP or with Jiyoye/fLuc-GFP cell lines at different E:T ratios. After 3 days of co-culture, cells were analyzed by luminometry (relative light units per second; RLU/s) and IFN-γ secretion. Triton-X was used to determine the maximum killing rate, whereas non-treated alive cells were used as controls. (D, E) Cytotoxicity effects of CD19KICAR-T or gp350KICAR-T effectors after co-culture with Daudi/fLuc-GFP targets. (F, G) Cytotoxicity effects of CD19KICAR-T or gp350KICAR-T effectors after co-culture with Jiyoye/fLuc-GFP targets. (H, I) IFN-γ detected in cultures of CD19KICAR-T or gp350KICAR-T effectors after co-culture with Daudi/fLuc-GFP targets. (J, K) IFN-γ detected in cultures of CD19KICAR-T or gp350KICAR-T effectors after co-culture with Jiyoye/fLuc-GFP targets. Results for CD19KICAR-T cells are depicted in green and those for gp350KICAR-T cells in blue. The results represent cultures performed in triplicate. Statistical analyses took the form of a one-tailed grouped t-test (***p < 0.001, **p < 0.01, *p < 0.05).
Figure 4
Figure 4
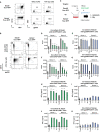
CARKI-T cells produced on a large scale, cryopreserved and thawed, show improved killing of EBV+ Burkitt lymphoma cell lines in vitro. (A) Flow cytometry analyses (x-axis: CAR; y-axis: CD3) of CD19KICAR-T and gp350KICAR-T cells generated with PBMCs of two healthy donors after cryopreservation and thawing. (B) Schematic representation of functional analyses of CD19KICAR-T and gp350KICAR-T cells after co-culture with Daudi/fLuc-GFP and Jiyoye/fLuc-GFP cell lines at different E:T ratios. After 3 days of co-culture, cell killing was quantified via luminometry (upper diagram) and flow cytometry (lower diagram). (C–F) Luminometry detection (relative light units per second (RLU/s)). Triton-X was used to determine the maximum rate of killing, whereas non-treated alive cells were used as controls. (C, E) CD19KICAR-T effectors co-cultured with Daudi/fLuc-GFP or Jiyoye/fLuc-GFP targets. (D, F) gp350KICAR-T effectors co-cultured with Daudi/fLuc-GFP or Jiyoye/fLuc-GFP targets. (G, H) Frequencies of Daudi/fLuc-GFP targets and effectors detected after co-culture. (I, J) Frequencies of Jiyoye/fLuc-GFP targets and effectors detected after co-culture. (K, L) Frequencies of CD4+ and CD8+ subpopulations after co-culture with Daudi/fLuc-GFP targets. (M, N) Frequencies of CD4+ and CD8+ subpopulations after co-culture with Jiyoye/fLuc-GFP targets. Results for CD19KICAR-T cells are depicted in green and those for gp350KICAR-T cells in blue. The luminometry results (C–F) represent cultures performed in triplicate; for flow cytometry, the samples were pooled (K–N). Statistical analyses took the form of a one-tailed grouped t-test (***p < 0.001, **p < 0.01, *p < 0.05).
Figure 5
Figure 5
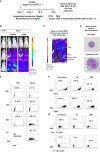
Daudi/fLuc-GFP engrafted and disseminated in several organs of mice and maintenance of surface expression of GFP, CD19, CD20, and gp350 in vivo. (A) Experimental scheme. Nod.Rag.Gamma (NRG) mice were challenged with 2 × 10⁵ Daudi/fLuc-GFP cells (i.v. injection; females, n = 3; males, n = 3; non-challenged PBS control, CTR, n = 1). (B) Representative examples of two challenged mice (female and male) and a control mouse are shown. Mice were analyzed longitudinally by bioluminescence imaging (BLI) for 4 weeks, and the experiment was then terminated. BLI of control (PBS) and female and male mice is shown at 4 days, 2 weeks, and 4 weeks after challenge (frontal view; scale from 4.5 × 10³ to 5.0 × 10⁸ p/s/cm2/sr). (C) Post-mortem abdominal BLI of a female mouse developing several lymphoma foci in lymph nodes, kidney, and ovary (scale 1.0 × 10⁷ to 5.0 × 10⁸ p/s/cm2/sr). (D) Images of kidneys, from CTR mouse as a reference and from a mouse developing tumors. (E) Images of bone marrow smears stained with Giemsa. A mouse normoblast was seen in control mice, and cells with typical morphology of lymphoma were observed in a mouse challenged with Daudi/fLuc-GFP cells. Original magnification ×1,000. (F) Flow cytometry analyses of various lymphatic tissues (SPL, spleen; BM, bone marrow; LNs, lymph nodes). GFP expression (shown in the x-axis) was maintained in blasts; 10,000 events are shown. (G) Flow cytometry analyses of Daudi/fLuc-GFP cells maintained in culture or explanted from LNs and BM. GFP+ blasts express CD19 and CD20. At least 1,500 events are shown. (H) Flow cytometry analyses of Daudi/fLuc-GFP cells maintained in culture or explanted from LNs and BM. Subpopulations of GFP+CD20+ blasts expressed gp350. The samples were stained with 7A1 primary mAb for gp350 detection and secondary Ab (upper row) or with secondary Ab only (bottom row). At least 1,500 events are shown. Unstained samples were used as references for gating (not shown).
Figure 6
Figure 6
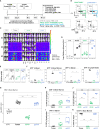
CD19KICAR-T cells showed therapeutic effects against Daudi/fLuc-GFP lymphoma growth, but gp350KICAR-T cells did not. (A) Experimental scheme. Female NRG mice (n = 18) were challenged i.v. with 2 × 10⁵ Daudi/fLuc-GFP cells on day 0. Control mice (CTR, n = 2) received PBS. On day 4, the challenged mice were analyzed by bioluminescence imaging (BLI) and then distributed into three cohorts (n = 6 mice each). One cohort was not treated (tumor, depicted in black). One cohort was treated with 1 × 10⁶ CAR+ CD19KICAR-T cells (CD19, depicted in green), and the third cohort was treated with 1 × 10⁶ CAR+ gp350KICAR-T cells (gp350, depicted in blue). The experiment was terminated at 4 weeks after challenge, and several analyses were performed. (B) Flow cytometry analysis of CD19KICAR-T and gp350KICAR-T cells on the day prior to infusion. Upper row: CD3 (y-axis) and CAR-expression (x-axis). Bottom row: cells gated as CD3CAR+ were further analyzed for CD4 (y-axis) and CD8 expression (x-axis). (C) BLI in frontal and side views for each cohort at day 4, week 2, week 3, and week 4 after challenge. BLI scale is from 5.0 × 10⁴ to 1.0 × 10⁸ p/s/cm2/sr. (D) Quantified BLI as full body radiance (log scale) shown as boxplots for each cohort and time point. Statistical comparisons were performed via ANOVA with Tukey’s post-hoc method for each time point (***p < 0.001, **p < 0.01). (E) Body weight monitoring. The weights obtained on day 0 for each mouse were used as references for measurements at the subsequent time points. Boxplots for each cohort and time point are shown. Statistical comparisons were performed via ANOVA with Tukey’s post-hoc method for each time point (***p < 0.001, **p < 0.01). (F) Flow cytometry detection of GFP+ blasts in blood, bone marrow, and spleen. Boxplots for each cohort analyzed at week 4 are shown in the form of percentages. Statistical comparisons were performed via the Kruskal–Wallis test and Tukey’s post-hoc tests (*p < 0.05). (G) Detection of EBV DNA in bone marrow. The hatched line indicates the approximate detection limit of EBV units in the samples used for the assay. Boxplots for each cohort analyzed at week 4 are shown on a log scale. Statistical comparisons were performed via binomial regression and Tukey’s post-hoc tests (***p < 0.001). (H) Detection of CD19+ cells within GFP+/CD20+ cells in bone marrow (upper panel) and spleen (lower panel) for non-treated mice or mice treated with gp350KICAR-T cells. Each cohort is shown in the form of boxplots. (I) Detection of gp350+ cells in bone marrow (upper panel) and spleen (lower panel) for non-treated mice or mice treated with gp350KICAR-T cells. Each cohort is shown in the form of boxplots. Only samples with readily detectable GFP+CD20+ populations (tumor-only and gp350KICAR) are shown; this resulted in varying sample numbers (SPL: n = 6, tumor-only; n = 5, gp350KICAR; in BM: n = 4, tumor-only; n = 3, gp350KICAR).
Figure 7
Figure 7
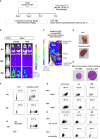
Jiyoye/fLuc-GFP engrafted and disseminated in bones and several organs of NRG mice and maintenance of surface expression of GFP, CD19, CD20, and lower expression of gp350 in vivo. (A) Experimental scheme. Nod.Rag.Gamma (NRG) mice were challenged with 2 × 10⁵ Jiyoye/fLuc-GFP cells (i.v. injection; females, n = 3; males, n = 3; non-challenged PBS control, CTR, n = 1). (B) Representative examples of two challenged female and male mice and a control mouse are shown. Mice were analyzed longitudinally via bioluminescence imaging (BLI), and the experiment was then terminated. BLI is shown at 4 days, 2 weeks, and 4 weeks after challenge (frontal view; scale from 4,5 × 10³ to 5 × 10⁸ p/s/cm2/sr). (C) Post-mortem abdominal BLI of a female mouse developing lymphoma infiltrating the bones, lymph nodes, and ovary (scale: 4 × 10⁶ to 5 × 10⁸ p/s/cm2/sr). (D) Bone marrow smears stained with Giemsa. Mouse normoblast observed in control mice and cells with typical morphology of lymphoma observed in one mouse challenged with Jiyoye/fLuc-GFP cells. Original magnification ×1,000. (E) Flow cytometry analyses of peripheral blood (PBL), spleen (SPL), bone marrow (BM), and lymph nodes (LNs). GFP expression (shown on the x-axis) was maintained in blasts; 10,000 events are shown. (F) Flow cytometry analyses of Jiyoye/fLuc-GFP cells maintained in culture or explanted from LNs and BM. GFP+ blasts express CD19 and CD20; 10,000 events are shown. (G) Flow cytometry analyses of Jiyoye/fLuc-GFP cells maintained in culture or explanted from LNs and BM. Subpopulations of GFP+CD20+ blasts expressed low frequencies of gp350. The samples were stained with 7A1 primary mAb for gp350 detection and secondary Ab (upper row) or with secondary Ab only (bottom row); 10,000 events are shown per plot. Unstained samples were used as references.
Figure 8
Figure 8
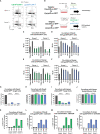
CD19KICAR-T cells showed therapeutic effects against Jiyoye/fLuc-GFP lymphoma growth with accumulation of CD4+CAR-T cells, whereas gp350KICAR-T cells reduced EBV DNA load with accumulation of CD8+CAR-T cells. Therapeutic administration of KICAR-T cells into mice challenged with Jiyoye/fLuc-GFP lymphoma. (A) Experimental scheme. Female NRG mice (n = 18) were challenged i.v. with 2 × 10⁵ Jiyoye/fLuc-GFP cells on day 0. Control mice (CTR, n = 2) received PBS. On day 4, the challenged mice were analyzed via bioluminescence imaging (BLI) and distributed into three cohorts (n = 6 mice each). One cohort was not treated (tumor, depicted in black). One cohort was treated with 1 × 10⁶ CAR+ CD19KICAR-T cells (CD19, depicted in green), and the third cohort was treated with 1 × 10⁶ CAR+ gp350KICAR-T cells (gp350, depicted in blue). The experiment was terminated at 3.5 weeks after challenge for several analyses because some mice were moribund. (B) Flow cytometry analysis of CD19KICAR-T and gp350KICAR-T cells on the day prior to infusion. Upper row: CD3 (y-axis) and CAR expression (x-axis). Bottom row: cells gated as CD3CAR+ were further analyzed for CD4 (y-axis) and CD8 expression (x-axis). (C) BLI in frontal and side views for each cohort at day 4, week 2, and week 3 after challenge. BLI scale is from 1 × 10⁴ to 1 × 10⁹ p/s/cm2/sr. (D) Quantified BLI as full body radiance (log scale) shown in the form of boxplots for each cohort and time point. Statistical comparisons were performed via ANOVA with Tukey’s post-hoc method for each time point (***p < 0.001). (E) Body weight monitoring ns indicates not significant. The weight measured on day 0 for each mouse was used as reference for measurements taken at subsequent time points. Boxplots for each cohort and time point are shown. Statistical comparisons were performed via ANOVA with Tukey’s post-hoc method for each time-point **p < 0.01). (F) Flow cytometry detection of GFP+ blasts in blood, bone marrow, spleen, and lymph nodes. Boxplots for each cohort analyzed at week 4 are shown in the form of percentages. Statistical comparisons were performed via Kruskal–Wallis test and Tukey’s post-hoc tests (***p < 0.001, **p < 0.01, *p < 0.05). (G) Detection of EBV DNA in bone marrow. The hatched line indicates the approximate detection limit of EBV units in the samples used for the assay. Boxplots for each cohort analyzed at week 4 are shown on a log scale (tumor: n = 5, one sample not available; CD19: n = 6: gp350: n = 5). Statistical comparisons were performed via binomial regression and Tukey’s post-hoc tests (***p < 0.001, *p < 0.05). (H, I) Detection of CAR+ cells in bone marrow (H) and spleen (I) for non-treated mice or mice treated with CD19KICAR-T cells or with gp350KICAR-T cells. Data were analyzed via ANOVA (type 2) and Tukey’s post-hoc tests (***p < 0.001, **p < 0.01, *p < 0.05). (J) Frequencies of CD8+CAR+ cells detected in the spleen and bone marrow of mice treated with CD19KICAR-T cells or with gp350KICAR-T cells. Data were analyzed via ANOVA (type 2) and Tukey’s post-hoc test (***p < 0.001). (K) Detection of CD19+ cells in bone marrow for non-treated mice or mice treated with CD19KICAR-T cells or with gp350KICAR-T cells. Each cohort is shown in the form of boxplots. Data were analyzed via ANOVA (Type II) and Tukey’s post-hoc tests (***p < 0.001). Only samples with readily detectable GFP+CD20+ populations are shown.
Figure 9
Figure 9
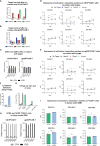
Expression of activation/exhaustion markers and Treg frequencies showing differences for CD19KICAR-T and gp350KICAR-T cells. KICAR-T cells that were exposed to lymphoma cell lines in vitro (A–E) or in vivo (F–I) were compared. (A, B) Survival of GFP+ targets (CD19+gp350 Nalm-6, CD19+gp350+ Daudi, or CD19+gp350+ Jiyoye) after co-culture with (A) CD19KICAR-T cells or with (B) gp350KICAR-T cells at 1:1 E:T ratio for 1, 2, or 3 days. The cells were harvested at different time points and analyzed via flow cytometry for quantification of the frequencies of GFP+ targets. Day 0 was used as a reference to show the relative decrease or increase in frequencies of the targets in the cultures. (C) Relative frequencies of CD4+ or CD8+ effectors (left panel: CD19KICAR-T cells; right panel: gp350KICAR-T) cultured for 3 days with no target or with addition of the target cell lines. (D, E) Longitudinal analyses of expression of activation/exhaustion markers (left: PD-1; middle: LAG-3; right: TIM-3) on CD4+ (top) and CD8+ (bottom) for (D) CD19KICAR-T cells or (E) gp350KICAR-T cells (mean fluorescence intensity, MFI log10). Expression was measured before culture (day 0) and repeatedly every 24 h (days 1–3) for CAR-T cells co-cultured with different targets (E:T ratio 1:1). KICAR-T cells were gated as GFP-negative and CAR-positive cells (see Figure S6 ). (F–I) Re-analyses via flow cytometry of cryopreserved bone marrow specimens of mice transplanted with Jiyoye. (F) Infiltration of Jiyoye, quantified as percentage of GFP+ cells within all identified human CD45+ cells (CD19 KICAR-T, n = 6; gp350 KICAR-T, n = 5; mean + SEM). (G) Frequencies of regulatory T cells (Treg) for healthy donor PBMCs (gray, n = 5), for ex vivo expanded KICAR-T cells (CD19: green; gp350: blue; n = 1 each), and CAR-T cells detected in bone marrow samples of mice challenged with Jiyoye/fLuc-GFP (CD19: dark green, n = 6; gp350: dark blue, n = 5). Treg cells were identified as CD4+ FoxP3+ (gating strategy: Figure S7 ) and are depicted in the form mean + SEM where applicable. (H) Relative frequencies of CD4+ and CD8+ subpopulations of CAR+ T cells detectable in bone marrow samples (left: CD19KICAR-T cells, n = 6; right: gp350KICAR-T cells, n = 5). (I) Flow cytometry analysis of bone marrow samples of mice challenged with Jiyoye/fLuc-GFP. Expression of various exhaustion markers (left: PD-1; middle: LAG-3; right: TIM-3) for CD4 (top) and CD8 (bottom) KICAR-T cells (CD19: green, n = 6; gp350: blue, n = 5; mean + SEM). CAR-T cells were gated as GFP-negative and CAR-positive cells (gating strategy: Figure S6 ). Significance was assessed via Student’s t-test (**p < 0.01, *p < 0.05).

References

    1. Miles RR, Arnold S, Cairo MS. Risk factors and treatment of childhood and adolescent burkitt lymphoma/leukaemia. Br J Haematol (2012) 156:730–43. doi: 10.1111/j.1365-2141.2011.09024.x - DOI - PubMed
    1. Burkhardt B, Michgehl U, Rohde J, Erdmann T, Berning P, Reutter K, et al. . Clinical relevance of molecular characteristics in burkitt lymphoma differs according to age. Nat Commun (2022) 13:3881. doi: 10.1038/s41467-022-31355-8 - DOI - PMC - PubMed
    1. Woessmann W, Zimmermann M, Meinhardt A, Muller S, Hauch H, Knorr F, et al. . Progressive or relapsed burkitt lymphoma or leukemia in children and adolescents after BFM-type first-line therapy. Blood (2020) 135:1124–32. doi: 10.1182/blood.2019003591 - DOI - PubMed
    1. Heslop HE. Sensitizing burkitt lymphoma to EBV-CTLs. Blood (2020) 135:1822–3. doi: 10.1182/blood.2020005492 - DOI - PMC - PubMed
    1. Rowe M, Fitzsimmons L, Bell AI. Epstein-Barr Virus and burkitt lymphoma. Chin J Cancer (2014) 33:609–19. doi: 10.5732/cjc.014.10190 - DOI - PMC - PubMed

Publication types

Substances