. 2023 Mar 23:14:1086907.
doi: 10.3389/fimmu.2023.1086907. eCollection 2023.

The m6A methylation landscape, molecular characterization and clinical relevance in prostate adenocarcinoma

Affiliations

The m6A methylation landscape, molecular characterization and clinical relevance in prostate adenocarcinoma

Chao Li et al. Front Immunol. .

Abstract

Background: Despite the recent progress of therapeutic strategies in treating prostate cancer (PCa), the majority of patients still eventually relapse, experiencing dismal outcomes. Therefore, it is of utmost importance to identify novel viable targets to increase the effectiveness of treatment. The present study aimed to investigate the potential relationship between N6-methyladenosine (m6A) RNA modification and PCa development and determine its clinical relevance.

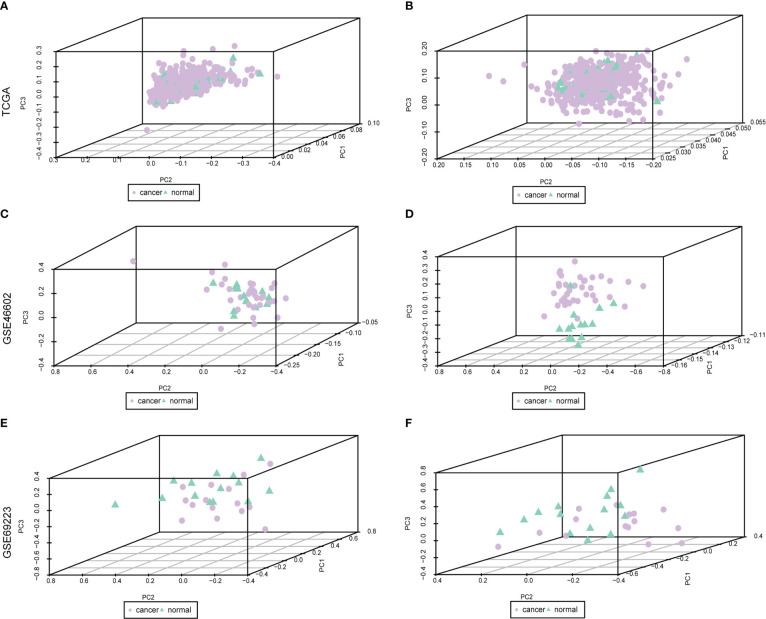
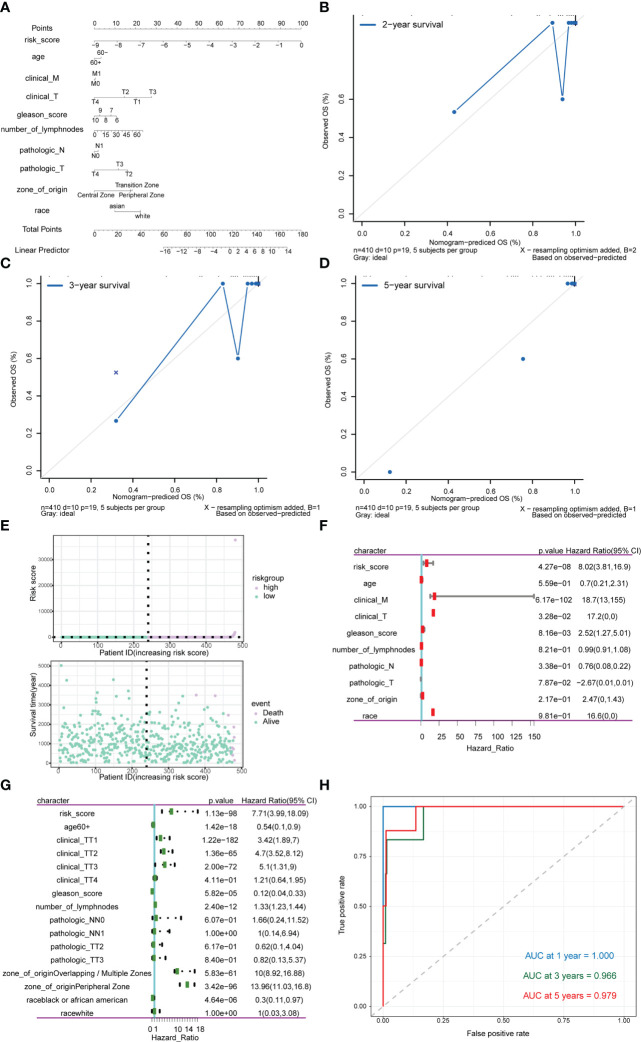
Methods: Through systematic analysis of the TCGA database and other datasets, we analyzed the gene expression correlation and mutation profiles of m6A-related genes between PCa and normal tissues. Patient samples were divided into high- and low-risk groups based on the results of Least Absolute Shrinkage and Selection Operator (LASSO) Cox analysis. Subsequently, differences in biological processes and genomic characteristics of the two risk groups were determined, followed by functional enrichment analysis and gene set enrichment (GSEA) analysis. Next, we constructed the protein-protein interaction (PPI) network of differentially expressed genes between patients in high- and low-risk groups, along with the mRNA-miRNA-lncRNA network. The correlation analysis of tumor-infiltrating immune cells was further conducted to reveal the differences in immune characteristics between the two groups.

Results: A variety of m6A-related genes were identified to be differentially expressed in PCa tissues as compared with normal tissues. In addition, the PPI network contained 278 interaction relationships and 34 m6A-related genes, and the mRNA-miRNA-lncRNA network contained 17 relationships, including 91 miRNAs. Finally, the immune characteristics analysis showed that compared with the low-risk group, the levels of M1 and M2 macrophages in the high-risk group significantly increased, while the levels of mast cells resting and T cells CD4 memory resting significantly decreased.

Conclusions: This study provides novel findings that can further the understanding of the role of m6A methylation during the progression of PCa, which may facilitate the invention of targeted therapeutic drugs.

Keywords: RNA N6-methyladenosine; immune infiltration; molecular characterization; prognosis; prostate adenocarcinoma.


Conflict of interest statement

The authors declare that the research was conducted in the absence of any commercial or financial relationships that could be construed as a potential conflict of interest.

Figures

Figure 1
Figure 1
Dataset on PRAD after correction. Purple nodes indicate tumor samples, and green nodes indicate normal samples. (A, C, E) are the data before correction, and (B, D, F) are the data after correction.
Figure 2
Figure 2
Overall expression of m6A-related genes in PRAD patients. Purple indicates the tumor sample, and green indicates the normal sample. Three images indicate TCGA (A), GSE46602 (B), GSE69223 (C). *P < 0.05, **P < 0.01, ***P < 0.001, ns, not significant.
Figure 3
Figure 3
Mutation status of m6A-related genes in PRAD patients. (A) Summary of PRAD patients mutation data from TCGA. (B) Mutation map of m6A-related genes in PRAD patients from TCGA. Samples are ordered according to somatic nonsynonymous mutational burden and genes are ordered by mutation frequency, with various colors indicating different mutation types. Subsection above legend shows mutational burden. (C) The expression level correlation of m6A-related genes in the gene expression profile of PRAD patients from TCGA. The numbers in the figure and the annotation bar on the right indicate the magnitude of the correlation. (D) Differences in TMB between PRAD patients in high-risk group and low-risk group. (E) Differences in MSI status between PRAD patients in high-risk group and low-risk group.
Figure 4
Figure 4
Construction of the risk scoring model. (A, B) LASSO Cox analysis identified 18 signature genes most associated with OS in the dataset of PRAD patients from TCGA. (C) Expression correlation analysis of signature genes in PRAD. (D) Kaplan-Meier curve assessed the effect of risk score on overall survival in PRAD patients, with patients with low risk in purple and patients with high risk in green. (E) The correlation analysis of m6A-related genes and risk scores. The horizontal axis shows m6A-related genes, the vertical axis shows the size of correlation, and the node color indicates the significance level. *P < 0.05, **P < 0.01, *** P < 0.001.
Figure 5
Figure 5
Expression levels of m6A gene between patients in a high-risk group and low-risk group. Purple indicates patients with low-risk, and green indicates patients with high-risk.
Figure 6
Figure 6
Correlation analysis of risk scores and genomic characteristics. (A, B) Summary data on mutation for patients with low-risk and patients with high-risk. (C, D) Statistics of top 20 mutant genes in patients with high-risk and patients with low-risk. Samples are ordered according to somatic nonsynonymous mutational burden and genes are ordered by mutation frequency, with various colors indicating different mutation types. The subsection above the legend shows mutational burden. (E, F) Demonstration of synergy and mutational relationships between mutated genes in patients with high-risk and patients with low-risk. (G, H) Identified genes with significant amplifications and deletions in patients with high-risk and patients with low-risk. Q-value and change score of GISTIC2.0 (x-axis) versus genomic location (y-axis). Dashed lines indicated centromeres. The green line represents the 0.25 Q-value cut-off point for determining significance. *P < 0.05.
Figure 7
Figure 7
Correlation analysis of risk score and Hallmark_DNA_repair (A), Hallmark_APICAL_surface (B), Hallmark_myc_targets_v1 (C), Hallmark_G2M_checkpoint (D), Hallmark_unfolded_protein_response (E), Hallmark_myc_targets_v2 (F), Hallmark_myogenesis (G), Hallmark_E2F_targets (H), Hallmark_oxidative_phosphorylation (I). The horizontal axis represents the risk score, and the vertical axis represents the enrichment score of the hallmark.
Figure 8
Figure 8
Differentially expressed mRNAs (A), miRNAs (B), lncRNAs (C) between patients in a high-risk group and a low-risk group. The horizontal axis was logFC; the vertical axis was -log10 (Adjust P-value). Red nodes represent up-regulated differentially expressed genes, blue nodes represent down-regulated differentially expressed genes, and gray nodes represent genes that were not significantly differentially expressed.
Figure 9
Figure 9
Enrichment analysis of differentially expressed genes between patients in a high-risk group and low-risk group. (A) GO functional enrichment analysis, the vertical axis is gene ratio, the horizontal axis is GO terms, the node color indicates -log10 (p value), and the node size indicates the number of genes contained in the current GO Term. (B) The first 5 items of BP are listed, the node’s size indicates the number of genes contained in the current GO Term, and the different colors indicate different GO Term. (C) The first 5 items of CC are listed, the node size indicates the number of genes contained in the current GO Term, and the different colors indicate different GO Term. (D) The first 5 items of MF are listed, the node size indicates the number of genes contained in the current GO Term, and the different colors indicate different GO Term. (E) KEGG pathway enrichment analysis, the horizontal axis was -log10 (p value), the vertical axis is the Pathway name, the node size indicates the number of genes enriched in the pathway, and the node color indicated -log10 (p value). (F) KEGG pathway with significant enrichment. hsa00982: Drug metabolism - cytochrome P450. (G) KEGG pathway with significant enrichment, hsa04972: Pancreatic secretion. (H) KEGG pathway with significant enrichment, hsa04918: Thyroid hormone synthesis.
Figure 10
Figure 10
GSEA analysis of high-risk group and low-risk group. (A) GSEA-GO analysis of a dataset of PRAD patients from TCGA, the horizontal axis is the gene ratio, the vertical axis is the GO terms, and the color represents -log10 (p value). (B) The first 5 items of the GSEA-GO analysis of the entire dataset of PRAD patients from TCGA are shown. (C) GSEA-KEGG analysis of dataset of PRAD patients from TCGA, the horizontal axis is the gene ratio, the vertical axis is the GO terms, the node size represents the number of genes enriched in GO terms, and the node color represents log10 (p value). (D) The first 5 items of the GSEA-KEGG analysis of dataset of PRAD patients from TCGA.
Figure 11
Figure 11
PPI network and mRNA-miRNA-lncRNA network of differentially expressed genes. (A) PPI network of differentially expressed genes. The node size represents the degree of the node. (B) The first subnet in the PPI network of differentially expressed gene. The node size represents the score of mcode. (C) Graph of enrichment analysis of PPI network of differentially expressed gene. (D) mRNA-miRNA-lncRNA network of differentially expressed genes. Blue nodes represent miRNAs, red nodes represent differentially expressed lncRNAs, and yellow nodes represent differentially expressed mRNAs. (E) PPI network of m6A-related gene. The node size indicates the degree of the node. (F) mRNA-miRNA network of m6A-related gene. Blue nodes represent miRNAs, and red nodes represent m6A-related genes. (G) The heat map of m6A-related genes, risk scores combined with clinicopathological characteristics.
Figure 12
Figure 12
Association of risk score-m6A-related gene-immune cell infiltration and drug sensitivity. (A) Histogram of the level of immune cells infiltration between patients in a high-risk group and low-risk group. Light green represents the high-risk group, dark green represents the low-risk group, the horizontal axis represents immune cell subtypes, and the vertical axis represents the infiltration level of cells. (B) Correlation diagram between m6A-related genes and immune cells. The horizontal axis represents immune cell subtypes, the vertical axis represents m6A-related genes, the node size represents the absolute value of the correlation size, and the node color represents the significance level. (C) Differences in drug sensitivity between patients in the high-risk group and low-risk group. The horizontal axis indicates grouping, and the vertical axis indicates -log0 (IC50). *P < 0.05, **P < 0.01, ns, not significant.
Figure 13
Figure 13
Analysis of the predictive power of risk scores for prognosis in PRAD patients. (A–D) Calibration curves of the nomogram. The horizontal axis is the survival predicted by the nomogram, and the vertical axis is the actual survival with repeated 1000 times each time. The curve shows the model had good predictive value of prognosis of patients for 2 years, 3 years and 5 years. (E) The risk group of the risk model. The horizontal axis shows the order of patient risk gradually increasing; the purple nodes represent patients with high-risk, the green nodes represent patients with low-risk, the vertical axis of the upper graph indicates the patient’s transformed risk score, and the vertical axis of the lower graph indicate survival time of patients. (F) HR and P values for risk scores by Univariate Cox regression analysis combined with clinicopathological features. (G) Multivariate Cox regression analysis of risk score combined with HR and P values of clinicopathological characteristics. The analysis showed that score of m6A group was an independent risk factor for the prognosis of PRAD patients. (H) Time-ROC curve of nomogram model for predicting 1-year survival, 3-year survival and 5-year survival of PRAD patients.
Figure 14
Figure 14
Expression validation of m6A-related gene in PCa cells. (A) Differences in mRNA expression of 8 m6A-related genes in 22Rv1, PC3 and RWPE-1 by RT-qPCR. (B) Differences in protein expression of METTL3, METTL5 and YTHDF1 in 22Rv1, PC3 and RWPE-1 by western blot. *P<0.05, **P<0.01.

Similar articles

Cited by

References

    1. Siegel R, Miller K, Wagle N, Jemal A. Cancer statistic. CA: Cancer J Clin (2023) 73:17–48. doi: 10.3322/caac.21763 - DOI - PubMed
    1. He HR, Liang L, Han DD, Xu FS, Lyu J. Different trends in the incidence and mortality rates of prostate cancer between China and the USA: A joinpoint and age-Period-Cohort analysis. Front Med (2022) 9. doi: 10.3389/fmed.2022.824464 - DOI - PMC - PubMed
    1. Boccaletto P, Stefaniak F, Ray A, Cappannini A, Mukherjee S, Purta E, et al. . MODOMICS: a database of RNA modification pathways. 2021 update. Nucleic Acids Res (2022) 50:D231–5. doi: 10.1093/nar/gkab1083 - DOI - PMC - PubMed
    1. Yue Y, Liu J, He C. RNA N6-methyladenosine methylation in post-transcriptional gene expression regulation. Genes Dev (2015) 29:1343–55. doi: 10.1101/gad.262766.115 - DOI - PMC - PubMed
    1. Jiang X, Liu B, Nie Z, Duan L, Xiong Q, Jin Z, et al. . The role of m6A modification in the biological functions and diseases. Signal Transduct Target Ther (2021) 6:74. doi: 10.1038/s41392-020-00450-x - DOI - PMC - PubMed

Publication types