. 2023 Mar 24:14:1135841.
doi: 10.3389/fimmu.2023.1135841. eCollection 2023.

Convergent antibody responses are associated with broad neutralization of hepatitis C virus

Affiliations

Convergent antibody responses are associated with broad neutralization of hepatitis C virus

Nicole E Skinner et al. Front Immunol. .

Erratum in

Abstract

Introduction: Early development of broadly neutralizing antibodies (bNAbs) targeting the hepatitis C virus (HCV) envelope glycoprotein E2 is associated with spontaneous clearance of infection, so induction of bNAbs is a major goal of HCV vaccine development. However, the molecular antibody features important for broad neutralization are not known.

Methods: To identify B cell repertoire features associated with broad neutralization, we performed RNA sequencing of the B cell receptors (BCRs) of HCV E2-reactive B cells of HCV-infected individuals with either high or low plasma neutralizing breadth. We then produced a monoclonal antibody (mAb) expressed by pairing the most abundant heavy and light chains from public clonotypes identified among clearance, high neutralization subjects.

Results: We found distinctive BCR features associated with broad neutralization of HCV, including long heavy chain complementarity determining region 3 (CDRH3) regions, specific VH gene usage, increased frequencies of somatic hypermutation, and particular VH gene mutations. Most intriguing, we identified many E2-reactive public BCR clonotypes (heavy and light chain clones with the same V and J-genes and identical CDR3 sequences) present only in subjects who produced highly neutralizing plasma. The majority of these public clonotypes were shared by two subjects who cleared infection. A mAb expressing the most abundant public heavy and light chains from these clearance, high neutralization subjects had features enriched in high neutralization clonotypes, such as increased somatic hypermutation frequency and usage of IGHV1-69, and was cross-neutralizing.

Discussion: Together, these results demonstrate distinct BCR repertoires associated with high plasma neutralizing capacity. Further characterization of the molecular features and function of these antibodies can inform HCV vaccine development.

Keywords: B cell; B cell receptor; hepatitis C virus; neutralizing antibody; vaccine.


Conflict of interest statement

JC has served as a consultant for Luna Labs USA, Merck Sharp & Dohme Corporation, Emergent Biosolutions, GlaxoSmithKline and BTG International Inc, is a member of the Scientific Advisory Board of Meissa Vaccines, a former member of the Scientific Advisory Board of Gigagen Grifols and is founder of IDBiologics. The laboratory of JC received unrelated sponsored research agreements from AstraZeneca, Takeda, and IDBiologics during the conduct of the study. The remaining authors declare that the research was conducted in the absence of any commercial or financial relationships that could be construed as a potential conflict of interest.

Figures

Figure 1
Figure 1
Neutralization score by subject. Percent neutralization achieved by a 1:100 dilution of plasma for each subject was measured using a diverse panel of 19 genotype 1 HCVpp. Values are means of two independent experiments performed in duplicate. As a positive control, the known HCV monoclonal bNAb HEPC74 tested at 10 μg/mL concentration is shown in the bottom row. Neutralization score integrating neutralization potency and breadth is shown in the last column, with the score equaling the sum of the potency for each HCVpp (>80% = 3, 50-79% = 2, 20-49% = 1, <20% =0). High neutralization was defined as neutralization score > 10.
Figure 2
Figure 2
Frequency of E2-reactive B cells. (A) Frequency of HCV sE2+ mature, class-switched B cells (% E2+ of CD3-, IgM-, IgD-, CD10-, CD19+, live, singlet lymphocytes) is shown for high and low neutralization subjects. Statistical comparisons were made using the Kruskal-Wallis test followed by the Dunn post-hoc test with the Benjamini-Hochberg correction applied for multiple comparisons. Boxplots indicate the 25th percentile (lower border), 75th percentile (upper border), median (horizontal line), and maximum and minimum values that fall within 1.5x the interquartile range (whiskers). (B) The frequency of HCV sE2+ mature, class-switched B cells was plotted against plasma neutralization score for each subject. A small amount of random variation (1.5%) was introduced into the location of overlapping data points to ensure all points were visible. R, Kendall rank correlation coefficient. Lymphocytes were downsampled to 500,000 cells in these analyses so that equivalent numbers of cells in HCV and healthy controls were compared. *P < 0.05; ***P < 0.001.
Figure 3
Figure 3
V-gene usage. (A) Significant differences in VH gene expression between E2-reactive high neutralization and low neutralization B cell clonotypes are shown via volcano plot. (B) Volcano plots show significant differences in VH – VJ gene pair usage between E2-reactive high neutralization and low neutralization B cell clonotypes. (C) Significant differences in light chain V-gene expression (VK and VL data combined) between E2-reactive high neutralization and low neutralization B cell clonotypes are shown via volcano plot. For all volcano plots, significant differences were defined as a minimum 1.5-fold difference with an associated P value < 0.05 after correction for multiple comparisons. (Benjamini-Hochberg method). Dashed vertical lines show the threshold for fold change expressed as Log2 Fold Change (0.6 and -0.6). The dashed horizontal line shows the P value threshold expressed as -Log10 P-value (1.3). Labeled V-genes meet significance criteria and are colored green to denote increased expression in high neutralization clonotypes or purple to denote increased expression in low neutralization clonotypes. All statistical comparisons were made using Fisher’s exact test with the Benjamini-Hochberg correction for multiple comparisons.
Figure 4
Figure 4
CDR3 length comparisons. (A) Comparison of CDRH3 lengths between E2-reactive and non-reactive B cell clonotypes for high and low neutralization subjects. (B) Comparison of CDRL3 lengths (IGK and IGL data combined) between E2-reactive and non-reactive B cell clonotypes for high and low neutralization subjects. Statistical comparisons were made using the Kruskal-Wallis test followed by the Dunn post-hoc test with the Benjamini-Hochberg correction applied for multiple comparisons. Violin plots show population distributions. Boxplots indicate the 25th percentile (lower border), 75th percentile (upper border), median (horizontal line), and maximum and minimum values that fall within 1.5x the interquartile range (whiskers). **P < 0.01; ***P < 0.001; ****P < 0.0001.
Figure 5
Figure 5
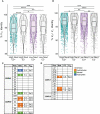
Somatic hypermutation frequencies and shared CDR1 and CDR2 substitutions. (A) Somatic hypermutation of the VH gene expressed as percent identity to germline VH for E2-reactive and non-reactive B cell clonotypes for high and low neutralization subjects. (B) Somatic hypermutation of the light chain V-gene (VK and VL data combined) expressed as percent identity to germline VK or VL for E2-reactive and non-reactive B cell clonotypes for high and low neutralization subjects. (C) CDRH1/CDRH2 substitutions enriched in E2-reactive B cell clonotypes from high neutralization subjects compared to E2-reactive clonotypes from low neutralization subjects. (D) CDRL1/CDRL2 substitutions enriched in E2-reactive B cell clonotypes from high neutralization subjects compared to E2-reactive clonotypes from low neutralization subjects. Kabat numbering is used for position. Color indicates hydrophobic (orange), neutral (green), or hydrophilic (blue) amino acid chemistry. Enriched substitutions were defined as those with a minimum 1.5-fold difference between groups with an associated P value < 0.05 after correction for multiple comparisons. For (A, B), violin plots show population distributions. Boxplots indicate the 25th percentile (lower border), 75th percentile (upper border), median (horizontal line), and maximum and minimum values that fall within 1.5x the interquartile range (whiskers). Statistical comparisons for (A, B) were made using the Kruskal-Wallis test followed by the Dunn post-hoc test with the Benjamini-Hochberg correction applied for multiple comparisons. Statistical comparisons for (C, D) were made using Fisher’s exact test with the Benjamini-Hochberg correction for multiple comparisons. Germline V-gene amino acids for each position shown in (C, D) can be found in Supplemental Tables 2, 3. FC, fold change; Padj, adjusted P-value; *P < 0.05; **P < 0.01; ***P < 0.001; ****P < 0.0001.
Figure 6
Figure 6
Group-specific public clonotypes. The proportion of group-specific public IGH (A), IGK (B), and IGL (C) E2-reactive and non-reactive B cell clonotypes for high and low neutralization subjects. A group-specific public clonotype was defined as having identical CDR3 amino acid sequence and the same V and J-gene usage while being present in at least two members of the same group and not present in any members of other groups. Data are expressed as the proportion of group-specific public clonotypes out of the total number of E2-reactive clonotypes in the group. A histogram shows the frequency of group-specific public clonotype proportions resulting from 1000 trials of random permutation of the IGH (D), IGK (E), and IGL (F) E2-reactive clonotype data. Medians are marked by dashed vertical lines labeled with an “M” and the 99.9th percentile is marked with a dashed vertical line labeled “99.9%.” The proportion of group-specific public clonotypes for E2-reactive B cells is marked with solid, color-coded vertical bars (green and purple for high and low neutralization groups, respectively). The proportion of group-specific public clonotypes for E2 non-reactive B cells is marked with hashed, color-coded vertical bars (green and purple for high and low neutralization groups, respectively). Statistical comparison in (A–C) were made using Fisher’s exact test with the Benjamini-Hochberg correction for multiple comparisons. **P < 0.01; ***P < 0.001; ****P < 0.0001.
Figure 7
Figure 7
Unbiased clustering of subjects based on public clonotype sharing. Heatmaps showing sharing of IGH (A), IGK (B), and IGL (C) clonotypes from E2-reactive (top row) and E2 non-reactive (bottom row) B cells between all subjects. Each column and row are labeled with a subject. Each column also has a colored box to indicate each subject’s neutralization status as well as a grayscale box to indicate each subject’s infecting HCV genotype. The ordering of subjects is determined by average-link clustering with the resultant dendrogram shown at the top of each heatmap.
Figure 8
Figure 8
Binding and neutralization assays for public clonotype mAb. (A) The abundance of clearance, high neutralization public clonotypes (total number of times a sequence was observed) is shown for IGH (left), IGK (middle), and IGL (right). The most abundant IGH public clonotype (designated IGH_47) and the most abundant light chain public clonotype (designated IGK_2) present in subjects C117 and C48 were cloned into IgG1 and IgK expression vectors and co-transfected to generate a mAb. (B) HCV E2 binding ELISA of the public clonotype mAb (IGH_47 + IGK_2, blue) using 1a157 (left), 1b09 (middle), and 1b21 (right) E2 variant proteins. The HEPC74 bNAb (red) was used as a positive control and non-reactive human IgG (green) was used as a negative control. (C) Neutralization breadth of the public clonotype mAb (IGH_47 + IGK_2) measured at 100 μg/mL concentration using a panel of 17 genotype 1-6 HCVpp selected to span 4 tiers of increasing neutralization resistance. Values are the average of duplicate wells. As a positive control, the known HCV bNAb HEPC74 tested at 100 μg/mL concentration is shown in the bottom row.

References

    1. World Health Organization . Hepatitis c (2021). Available at: https://www.who.int/news-room/fact-sheets/detail/hepatitis-c.
    1. Grebely J, Dore GJ, Morin S, Rockstroh JK, Klein MB. Elimination of HCV as a public health concern among people who inject drugs by 2030 - what will it take to get there? J Int AIDS Soc (2017) 20(1):22146. doi: 10.7448/IAS.20.1.22146 - DOI - PMC - PubMed
    1. Terrault NA. Hepatitis C elimination: challenges with under-diagnosis and under-treatment [version 1; peer review: 2 approved]. F1000 Res (2019) 8:54. doi: 10.12688/f1000research.15892.1 - DOI - PMC - PubMed
    1. Micallef JM, Kaldor JM, Dore GJ. Spontaneous viral clearance following acute hepatitis c infection: A systematic review of longitudinal studies. J Viral Hepat (2006) 13(1):34–41. doi: 10.1111/j.1365-2893.2005.00651.x - DOI - PubMed
    1. Gerlach JT, Diepolder HM, Jung MC, Gruener NH, Schraut WW, Zachoval R, et al. . Recurrence of hepatitis c virus after loss of virus-specific CD4+ T-cell response in acute hepatitis c. Gastroenterol (1999) 117(4):933–41. doi: 10.1016/S0016-5085(99)70353-7 - DOI - PubMed

Publication types

Substances