

Abnormal metabolic connectivity in default mode network of right temporal lobe epilepsy
- PMID: 37034164
- PMCID: PMC10076532
- DOI: 10.3389/fnins.2023.1011283
Abnormal metabolic connectivity in default mode network of right temporal lobe epilepsy
Abstract
Aims: Temporal lobe epilepsy (TLE) is a common neurological disorder associated with the dysfunction of the default mode network (DMN). Metabolic connectivity measured by 18F-fluorodeoxyglucose Positron Emission Computed Tomography (18F-FDG PET) has been widely used to assess cumulative energy consumption and provide valuable insights into the pathophysiology of TLE. However, the metabolic connectivity mechanism of DMN in TLE is far from fully elucidated. The present study investigated the metabolic connectivity mechanism of DMN in TLE using 18F-FDG PET.
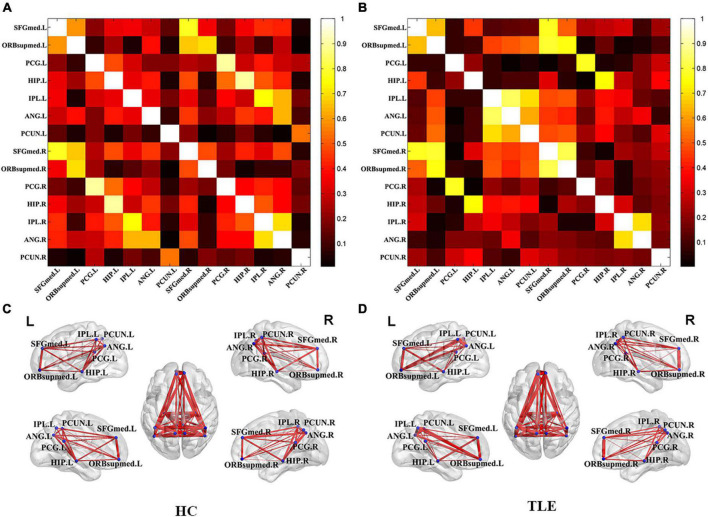
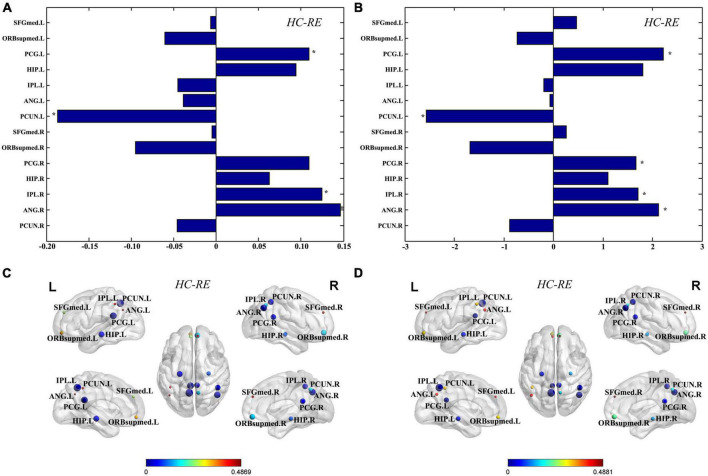
Method: Participants included 40 TLE patients and 41 health controls (HC) who were age- and gender-matched. A weighted undirected metabolic network of each group was constructed based on 14 primary volumes of interest (VOIs) in the DMN, in which Pearson's correlation coefficients between each pair-wise of the VOIs were calculated in an inter-subject manner. Graph theoretic analysis was then performed to analyze both global (global efficiency and the characteristic path length) and regional (nodal efficiency and degree centrality) network properties.
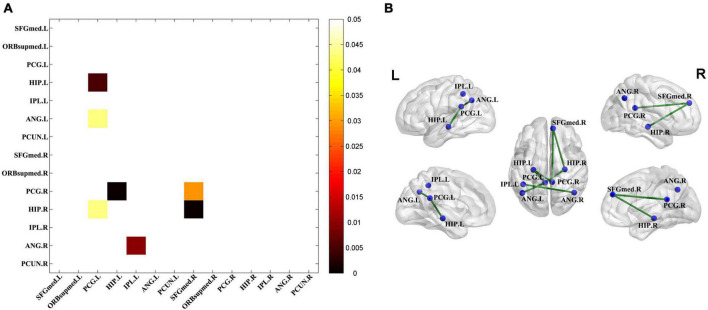
Results: Metabolic connectivity in DMN showed that regionally networks changed in the TLE group, including bilateral posterior cingulate gyrus, right inferior parietal gyrus, right angular gyrus, and left precuneus. Besides, significantly decreased (P < 0.05, FDR corrected) metabolic connections of DMN in the TLE group were revealed, containing bilateral hippocampus, bilateral posterior cingulate gyrus, bilateral angular gyrus, right medial of superior frontal gyrus, and left inferior parietal gyrus.
Conclusion: Taken together, the present study demonstrated the abnormal metabolic connectivity in DMN of TLE, which might provide further insights into the understanding the dysfunction mechanism and promote the treatment for TLE patients.
Keywords: 18F-FDG PET; TLE; default mode network; graph theory; metabolic connectivity.
Copyright © 2023 Wang, Lin, Zhao, Li, Fu, Huang and Xu.
Conflict of interest statement
The authors declare that the research was conducted in the absence of any commercial or financial relationships that could be construed as a potential conflict of interest.
Figures
Similar articles
-
Aberrant topological organization of the default mode network in temporal lobe epilepsy revealed by graph-theoretical analysis.Neurosci Lett. 2019 Aug 24;708:134351. doi: 10.1016/j.neulet.2019.134351. Epub 2019 Jun 24. Neurosci Lett. 2019. PMID: 31247225
-
Structural and functional changes in the default mode network in drug-resistant epilepsy.Epilepsy Behav. 2024 Feb;151:109593. doi: 10.1016/j.yebeh.2023.109593. Epub 2023 Dec 28. Epilepsy Behav. 2024. PMID: 38157823
-
Graph theory application with functional connectivity to distinguish left from right temporal lobe epilepsy.Epilepsy Res. 2020 Nov;167:106449. doi: 10.1016/j.eplepsyres.2020.106449. Epub 2020 Sep 6. Epilepsy Res. 2020. PMID: 32937221
-
Voxel-wise Functional Connectivity of the Default Mode Network in Epilepsies: A Systematic Review and Meta-Analysis.Curr Neuropharmacol. 2022;20(1):254-266. doi: 10.2174/1570159X19666210325130624. Curr Neuropharmacol. 2022. PMID: 33823767 Free PMC article.
-
Resting-state abnormalities in functional connectivity of the default mode network in migraine: A meta-analysis.Front Neurosci. 2023 Mar 1;17:1136790. doi: 10.3389/fnins.2023.1136790. eCollection 2023. Front Neurosci. 2023. PMID: 36937687 Free PMC article. Review.
Cited by
-
FDG-PET-based brain network analysis: a brief review of metabolic connectivity.EJNMMI Rep. 2025 Jan 20;9(1):4. doi: 10.1186/s41824-024-00232-6. EJNMMI Rep. 2025. PMID: 39828812 Free PMC article. Review.
-
Individual metabolic brain network abnormalities associated with drug-resistant mTLE vary in surgical outcomes.Front Neurol. 2024 Dec 18;15:1444787. doi: 10.3389/fneur.2024.1444787. eCollection 2024. Front Neurol. 2024. PMID: 39744116 Free PMC article.
-
Dynamic functional connectivity and gene expression correlates in temporal lobe epilepsy: insights from hidden markov models.J Transl Med. 2024 Aug 14;22(1):763. doi: 10.1186/s12967-024-05580-2. J Transl Med. 2024. PMID: 39143498 Free PMC article.
References
-
- Allendorfer J. B., Brokamp G. A., Nenert R., Szaflarski J. P., Morgan C. J., Tuggle S. C., et al. (2019). A pilot study of combined endurance and resistance exercise rehabilitation for verbal memory and functional connectivity improvement in epilepsy. Epilepsy Behav. 96 44–56. 10.1016/j.yebeh.2019.04.020 - DOI - PubMed
-
- Chaitra N., Vijaya P. A., Deshpande G. (2020). Diagnostic prediction of autism spectrum disorder using complex network measures in a machine learning framework. Biomed. Signal Process. Control 62:102099. 10.1016/j.bspc.2020.102099 - DOI
LinkOut - more resources
Full Text Sources