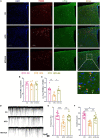
. 2023 Mar 21:17:1145079.
doi: 10.3389/fnins.2023.1145079. eCollection 2023.

Activation of POMC neurons to adiponectin participating in EA-mediated improvement of high-fat diet IR mice

Affiliations

Activation of POMC neurons to adiponectin participating in EA-mediated improvement of high-fat diet IR mice

Wanling Xu et al. Front Neurosci. .

Abstract

Background: Insulin resistance (IR) is one of the common pathological manifestations of metabolic-related diseases, and the prevalence of relevant diseases is high. Acupuncture is beneficial to IR patients, but the central mechanism underlying this treatment remains unclear. This study provides mechanistic insights into how electroacupuncture (EA) improves IR through the response of Pro-opiomelanocortin (POMC) neurons to adiponectin (Adipo).

Methods: Glucose tolerance tests (GTT), Insulin tolerance tests (ITT) and fasting blood glucose (FBG) were detected by glucometer. Serum insulin, Adipo and skeletal muscle adiponectin receptor 1 (AdipoR1) protein levels were examined by ELISA. Homeostasis model assessment estimated insulin resistance (HOMA-IR) was calculated using the following formula: HOMA-IR = fasting insulin (FINS) (mU/L) × FBG (mmol/L)/22.5. The expression levels of AdipoR1 and Adipo mRNA in skeletal muscle were detected by real-time PCR quantification. The co-marking of c-Fos/AdipoR1 and POMC neurons were investigated using immunofluorescence. Spontaneous excitatory postsynaptic currents (sEPSCs) of POMC neurons and the response of POMC neurons to Adipo were detected via electrophysiology.

Results: EA significantly ameliorated HFD-induced impairment of GTT, ITT, FBG, and HOMA-IR which was correlated with recovery of the expression level of AdipoR1 and Adipo in skeletal muscle. The improved response of POMC neurons to Adipo in the hypothalamus may be a key factor in correcting abnormal glucose tolerance and improving IR.

Conclusion: This study demonstrates that EA can ameliorate HFD-induced impaired glucose tolerance through improved response of POMC neurons to Adipo in the hypothalamus, providing insight into the central mechanism of improving IR through EA.

Keywords: POMC; ZuSanLi; adiponectin; electroacupuncture; insulin resistance.


Conflict of interest statement

The authors declare that the research was conducted in the absence of any commercial or financial relationships that could be construed as a potential conflict of interest.

Figures
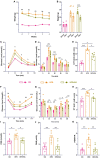
FIGURE 1
FIGURE 1
EA ameliorate high-fat diet-induced insulin resistance in mice. (A) Comparison of body weight changes during EA. (B) Comparison of body weight changes before and after EA. (C) Line chart of blood glucose change during glucose tolerance test in mice 4 weeks after EA. (D) Histogram of blood glucose change during glucose tolerance test in mice 4 weeks after EA. (E) Area under the glucose tolerance curve. (F) Line chart of blood glucose change during insulin tolerance test in mice 4 weeks after EA. (G) Histogram of blood glucose changes during insulin tolerance test in mice 4 weeks after EA. (H) Area under the insulin tolerance curve. (I) Fasting blood glucose of mice after EA. (J) Fasting serum insulin concentration of mice after EA. (K) Insulin resistance index of mice after EA. CD: control group. HFD: high-fat diet group. HFD + EA: model + electroacupuncture group. nsP > 0.05; *P < 0.05; **P < 0.01; ***P < 0.001 (one-way analysis of variance with post hoc Bonferroni correction or Tamhane correction).
FIGURE 2
FIGURE 2
HFD + EA mice exhibited improved levels of Adipo and AdipoR1. (A) Serum Adipo concentration of mice after HFD modeling. (B) Serum Adipo concentration of mice after EA. (C) Expression of AdipoR1 mRNA in skeletal muscle of mice after HFD modeling. (D) Expression of AdipoR1 mRNA in skeletal muscle of mice after EA. (E) AdipoR1 protein concentration in skeletal muscle of mice after HFD modeling. (F) AdipoR1 protein concentration in skeletal muscle of mice after EA. (G) Expression of Adipo mRNA in skeletal muscle of mice after EA. CD: control group. HFD: high-fat diet group. HFD + EA: model + electroacupuncture group. nsP > 0.05; *P < 0.05; **P < 0.01; ***P < 0.001 [unpaired t-test in panels (A,C,E); one-way analysis of variance with post hoc Bonferroni correction or Tamhane correction in panels (B,D,F,G)].
FIGURE 3
FIGURE 3
EA treatments activate hypothalamic POMC neurons. (A) Co-labeled immunofluorescence representation of POMC neurons and c-Fos. (B) Total POMC neurons number. (C) Ratio of common standard count of POMC neurons and c-Fos in total POMC neurons. (D) Representation of sEPSCs in POMC neurons. (E) sEPSCs frequency of POMC neurons. (F) sEPSCs amplitude of POMC neurons. “n” in the immunofluorescence graph represents the number of slices, with 3 mice in each group. “n” in the patch clamp graph represents the number of cells (the number of mice in each group ≥ 3). CD: control group. HFD: high-fat diet group. HFD + EA: model + electroacupuncture group. nsP > 0.05; *P < 0.05; **P < 0.01; ***P < 0.001 (one-way analysis of variance with post hoc Bonferroni correction or Tamhane correction). Scale bars: 100 μm.
FIGURE 4
FIGURE 4
EA treatments activate hypothalamic POMC neurons’ response to Adipo. (A) Co-labeled immunofluorescence representation of POMC neurons and AdipoR1 in the arcuate nucleus of the hypothalamus. (B) Total POMC numbers. (C) Ratio of common standard count of POMC neurons and AdipoR1 in the total POMC number. (D) Frequency representation of spontaneous action potential of POMC neurons before and after Adipo perfusion. (E) Spontaneous action potential frequency line diagram of POMC neurons before and after Adipo perfusion. (F) Normalization of action potential frequency change. “n” in the immunofluorescence graph represents the number of slices, with 3 mice in each group. “n” in the patch clamp graph represents the number of cells (the number of mice in each group ≥ 3). Panel (E) shows the statistical results of HFD group and HFD + EA group. CD: control group. HFD: high-fat diet group. HFD + EA: model + electroacupuncture group. nsP > 0.05; *P < 0.05; **P < 0.01 (one-way analysis of variance with post hoc Bonferroni correction or Tamhane correction). Scale bars: 100 μm.

Similar articles

Cited by

References

    1. Abgrall A., Poizat G., Prevost M., Riffault L., De La Barrera L., Hanine R., et al. (2022). Evidence for the neuronal expression and secretion of adiponectin. Cells 11:2725. 10.3390/cells11172725 - DOI - PMC - PubMed
    1. Al-Massadi O., Quiñones M., Clasadonte J., Hernandez-Bautista R., Romero-Picó A., Folgueira C., et al. (2019). MCH regulates SIRT1/FoxO1 and reduces POMC neuronal activity to induce hyperphagia, adiposity, and glucose intolerance. Diabetes 68 2210–2222. 10.2337/db19-0029 - DOI - PMC - PubMed
    1. Benrick A., Maliqueo M., Johansson J., Sun M., Wu X., Mannerås-Holm L., et al. (2014). Enhanced insulin sensitivity and acute regulation of metabolic genes and signaling pathways after a single electrical or manual acupuncture session in female insulin-resistant rats. Acta Diabetol. 51 963–972. 10.1007/s00592-014-0645-4 - DOI - PubMed
    1. Borst S. E. (2004). The role of TNF-alpha in insulin resistance. Endocrine 23 177–182. 10.1385/endo:23:2-3:177 - DOI - PubMed
    1. Bray G. A., Frühbeck G., Ryan D. H., Wilding J. P. (2016). Management of obesity. Lancet 387 1947–1956. 10.1016/s0140-6736(16)00271-3 - DOI - PubMed