Effects of ECM proteins (laminin, fibronectin, and type IV collagen) on the biological behavior of Schwann cells and their roles in the process of remyelination after peripheral nerve injury
- PMID: 37034260
- PMCID: PMC10080002
- DOI: 10.3389/fbioe.2023.1133718
Effects of ECM proteins (laminin, fibronectin, and type IV collagen) on the biological behavior of Schwann cells and their roles in the process of remyelination after peripheral nerve injury
Abstract
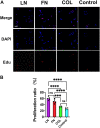
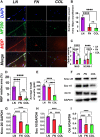
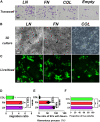
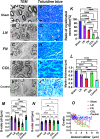
Introduction: It is important to note that complete myelination and formation of myelinated fibers are essential for functional nerve regeneration after peripheral nerve injury (PNI). However, suboptimal myelin regeneration is common and can hinder ideal nerve regeneration. Therefore, it is important to closely monitor and support myelin regeneration in patients with PNI to achieve optimal outcomes. Methods: This study analyzed the effects of three extracellular matrix (ECM) proteins on Schwann cells (SCs) in the nerve regeneration environment, including their adhesion, proliferation, and migration. The study also explored the use of composite sodium alginate hydrogel neural scaffolds with ECM components and investigated the effects of ECM proteins on remyelination following peripheral nerve injury. Results: The results showed that laminin (LN), fibronectin (FN), and collagen Ⅳ (type IV Col) promoted the early adhesion of SCs in 2-dimensional culture but the ratios of early cell adhesion were quite different and the maintenance of cells' morphology by different ECM proteins were significantly different. In transwell experiment, the ability of LN and FN to induce the migration of SCs was obviously higher than that of type IV Col. An vitro co-culture model of SCs and dorsal root ganglia (DRG) neurons showed that LN promoted the transition of SCs to a myelinated state and the maturation of the myelin sheath, and increased the thickness of neurofilaments. Animal experiments showed that LN had superior effects in promoting myelin sheath formation, axon repair, and reaching an ideal G-ratio after injury compared to FN and Col IV. The situation of gastrocnemius atrophy was significantly better in the LN group. Notably, the thickness of the regenerated myelin sheaths in the type IV Col group was the thickest. Conclusion: In this experiment, we analyzed and compared the effects of LN, FN, and type IV Col on the biological behavior of SCs and their effects on remyelination after PNI and further clarified their unique roles in the process of remyelination. Further research is necessary to explore the underlying mechanisms.
Keywords: ECM proteins; Schwann cells; myelination; peripheral nerve injury; regeneration.
Copyright © 2023 Yu, Zhang, Hou, Song, Wen, Ba, Zhu, Wang and Qin.
Conflict of interest statement
The authors declare that the research was conducted in the absence of any commercial or financial relationships that could be construed as a potential conflict of interest.
Figures


Similar articles
-
Interactions between Schwann cell and extracellular matrix in peripheral nerve regeneration.Front Neurol. 2024 Mar 26;15:1372168. doi: 10.3389/fneur.2024.1372168. eCollection 2024. Front Neurol. 2024. PMID: 38651098 Free PMC article. Review.
-
Investigation of the effects of laminin present in the basal lamina of the peripheral nervous system on axon regeneration and remyelination using the nerve acellular scaffold.J Biomed Mater Res A. 2020 Aug 1;108(8):1673-1687. doi: 10.1002/jbm.a.36933. Epub 2020 Mar 31. J Biomed Mater Res A. 2020. PMID: 32196907
-
Comparison of the Effects of BMSC-derived Schwann Cells and Autologous Schwann Cells on Remyelination Using a Rat Sciatic Nerve Defect Model.Int J Biol Sci. 2018 Oct 31;14(13):1910-1922. doi: 10.7150/ijbs.26765. eCollection 2018. Int J Biol Sci. 2018. PMID: 30443194 Free PMC article.
-
Type I collagen extracellular matrix facilitates nerve regeneration via the construction of a favourable microenvironment.Burns Trauma. 2024 Dec 10;12:tkae049. doi: 10.1093/burnst/tkae049. eCollection 2024. Burns Trauma. 2024. PMID: 39659559 Free PMC article.
-
Research progress on the reduced neural repair ability of aging Schwann cells.Front Cell Neurosci. 2023 Jul 20;17:1228282. doi: 10.3389/fncel.2023.1228282. eCollection 2023. Front Cell Neurosci. 2023. PMID: 37545880 Free PMC article. Review.
Cited by
-
Preparation and evaluation of decellularized epineurium as an anti-adhesive biofilm in peripheral nerve repair.Regen Biomater. 2024 May 13;11:rbae054. doi: 10.1093/rb/rbae054. eCollection 2024. Regen Biomater. 2024. PMID: 38845852 Free PMC article.
-
Biocompatible EDOT-Pyrrole Conjugated Conductive Polymer Coating for Augmenting Cell Attachment, Activity, and Differentiation.ACS Appl Bio Mater. 2025 Feb 17;8(2):1330-1342. doi: 10.1021/acsabm.4c01647. Epub 2025 Jan 24. ACS Appl Bio Mater. 2025. PMID: 39849945
-
Interactions between Schwann cell and extracellular matrix in peripheral nerve regeneration.Front Neurol. 2024 Mar 26;15:1372168. doi: 10.3389/fneur.2024.1372168. eCollection 2024. Front Neurol. 2024. PMID: 38651098 Free PMC article. Review.
-
Stiffness-tunable biomaterials provide a good extracellular matrix environment for axon growth and regeneration.Neural Regen Res. 2025 May 1;20(5):1364-1376. doi: 10.4103/NRR.NRR-D-23-01874. Epub 2024 May 13. Neural Regen Res. 2025. PMID: 39075897 Free PMC article.
-
Self-assembling peptides for sciatic nerve regeneration: a review of conduit microenvironment modeling strategies in preclinical studies.Front Cell Dev Biol. 2025 Aug 13;13:1637189. doi: 10.3389/fcell.2025.1637189. eCollection 2025. Front Cell Dev Biol. 2025. PMID: 40881347 Free PMC article. Review.
References
LinkOut - more resources
Full Text Sources
Miscellaneous

