. 2023 Jan 4;8(3):340-355.
doi: 10.1016/j.jacbts.2022.09.010. eCollection 2023 Mar.

Apolipoprotein M Attenuates Anthracycline Cardiotoxicity and Lysosomal Injury

Affiliations

Apolipoprotein M Attenuates Anthracycline Cardiotoxicity and Lysosomal Injury

Zhen Guo et al. JACC Basic Transl Sci. .

Abstract

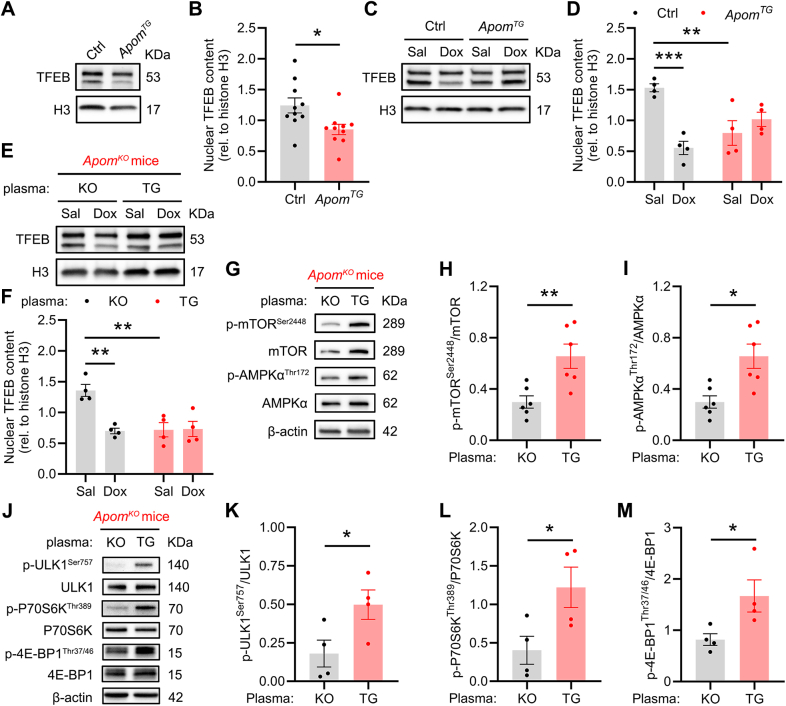
Apolipoprotein M (ApoM) binds sphingosine-1-phosphate (S1P) and is inversely associated with mortality in human heart failure (HF). Here, we show that anthracyclines such as doxorubicin (Dox) reduce circulating ApoM in mice and humans, that ApoM is inversely associated with mortality in patients with anthracycline-induced heart failure, and ApoM heterozygosity in mice increases Dox-induced mortality. In the setting of Dox stress, our studies suggest ApoM can help sustain myocardial autophagic flux in a post-transcriptional manner, attenuate Dox cardiotoxicity, and prevent lysosomal injury.

Keywords: TFEB; anthracycline; apolipoprotein M; autophagy; cardiomyopathy.


Conflict of interest statement

Dr Javaheri was supported by R01HL155344 and K08HL138262 from the National Heart, Lung, and Blood Institute and by the Diabetes Research Center at Washington University in St Louis of the National Institutes of Health (NIH) under award number P30DK020579, as well as NIH grant P30DK056341 (Nutrition Obesity Research Center), and by the Children’s Discovery Institute of Washington University (MC-FR-2020-919) and St Louis Children’s Hospital. Dr Guo was supported by an American Heart Association Postdoctoral Fellowship (898679). Dr Diwan was supported by grants from the Department of Veterans Affairs (I01BX004235) and the NIH (HL107594, HL43431, and NS094692). Dr Scherrer-Crosbie is supported by R01HL130539 and R01HL131613. Dr Rawnsley was supported by training grant support from the NIH (T32007081). Dr Desai was supported by R01HL136603. Dr Bergom was supported by R01HL147884. Research reported in this publication was also supported by the National Cancer Institute of the NIH under award numbers R50CA211466 (Dr Rettig), R35CA210084 (Dr DiPersio), P01CA101937 (Dr DiPersio), and R01HL119962 (Dr Parks). Human heart tissue procurement was supported by the National Heart, Lung, and Blood Institute via R01HL105993 (Drs Margulies and Cappola). Drs Christoffersen and Hajny were supported by the Novo Nordisk Foundation (0053008 and NNF13OC0003898). Dr Stitziel was supported in part by R01HL131961, R01HL159171, P01HL151328, and UM1HG008853 and by the Foundation for Barnes-Jewish Hospital. We acknowledge support from the NIH Shared Instrumentation Grant (S10RR027552) for support through the Hope Center Neuroimaging Core, the Molecular Microbiology Imaging Facility, and the Advanced Imaging and Tissue Analysis Core of the Digestive Disease Research Core Center (DDRCC NIH P30DK052574) at Washington University School of Medicine. Dr Stitziel has received consulting fees from Sension Therapeutics and investigator-initiated research funding from Regeneron Pharmaceuticals unrelated to the content of this study. Dr Javaheri has a pending patent for fusion protein nanodiscs for the treatment of heart failure and eye diseases, receives research funding from AstraZeneca, and is on the Scientific Advisory Board of Mobius Scientific. All other authors have reported that they have no relationships relevant to the contents of this paper to disclose.

Figures

None
Graphical abstract
Figure 1
Figure 1
ApoM Is Inversely Associated With Mortality in Anthracycline Cardiomyopathy (A) Kaplan-Meier survival curves for all-cause mortality. The numbers of patients at risk at each timepoint are presented below the graph. (B) HR per SD ApoM in patients with anthracycline cardiomyopathy. Cox proportional hazards model, n = 46. (C) Aptamer-based ApoM plasma levels in patients with breast cancer after 4 cycles of anthracycline. Mixed-effects model with Dunn’s correction for multiple comparisons (n = 36 at baseline, n = 35 at 3 months, and n = 14 at 6 months). Each dot represents 1 patient. Dotted lines represent median and quartiles. (D) Representative Western blot for ApoM from plasma isolated from mice 48 hours after treatment with saline or 10 mg/kg doxorubicin intraperitoneally. (E) Quantification of D. Student’s t-test (n = 8 saline vs n = 10 Dox). Each dot represents 1 mouse. (F) Representative Western blot for ApoM from plasma isolated from mice after treatment with saline or 5 mg/kg Dox intraperitoneally. Week 1 means 48 hours after the first dose, week 2 means 48 hours after the second dose, and week 6 means 6 weeks after the first dose. (G) Quantification of F. One-way repeated-measures analysis of variance with Dunn’s correction for multiple comparisons (n = 8 per group). Each dot represents 1 mouse. (H) Survival of littermate control (WT) and Apom+/- mice 4 weeks after 10 mg/kg Dox intraperitoneally (n = 26 WT vs n = 35 Apom+/- with sex matching). Log-rank test. ∗P < 0.05. ∗∗P < 0.01. 3M = 3 months; 6M = 6 months; ApoM = apolipoprotein M; a.u. = arbitrary units; Bsl = baseline; Dox = doxorubicin; Sal = saline; Wk = week; WT = wild type.
Figure 2
Figure 2
ApoM Attenuates Dox-Induced Mortality and Cardiotoxicity (A) Representative Western blot of human and mouse ApoM of plasma obtained from littermate control and ApomTG male mice 5 days after 20 mg/kg Dox intraperitoneally (IP). (B) Quantification of A. Two-way analysis of variance (ANOVA) with Sidak’s correction for multiple comparisons (n = 4 per group). (C) Change in LV mass from baseline and 5 days after 20 mg/kg Dox intraperitoneally (IP). Two-way repeated-measures ANOVA with Sidak’s correction for multiple comparisons (n = 4 per group male mice). (D) HW/TL from saline and 5 days after 20 mg/kg Dox IP. Two-way ANOVA with Sidak’s correction for multiple comparisons (n = 3-7 male mice). (E) Change in LVEF from baseline and 3 months after 4 weekly doses of 5 mg/kg Dox intravenously (IV). Two-way repeated-measures ANOVA with Sidak’s correction for multiple comparisons (n = 6 Ctrl vs n = 5 ApomTG male mice). (F) HW/TL from saline and 3 months after 4 weekly doses of 5 mg/kg Dox IV. Two-way ANOVA with Sidak’s correction for multiple comparisons (n = 3-4 male mice). (G) Left ventricular ejection fraction in Apom+/- male mice treated with 120 μL plasma obtained from Apom+/- or ApomTG donor mice (2 doses on subsequent days) and 10 mg/kg Dox IP (on day 2). Student’s t-test (n = 6 Apom+/- vs n = 7 ApomTG mice). (H) HW/TL in surviving mice from G, obtained at 4 weeks. Student’s t-test (n = 4 Apom+/- vs n = 5 ApomTG mice). Each dot represents 1 mouse in B to H. ∗P < 0.05. ∗∗P < 0.01. ∗∗∗P < 0.001. Ctrl = control; EF = ejection fraction; h = human; HW = heart weight; LV = left ventricular; m = mouse; ns = not significant; TL = tibia length; other abbreviations as in Figure 1.
Figure 3
Figure 3
ApoM Attenuates Dox-Induced Autophagic Impairment (A) Representative images of immunohistochemical staining of midmyocardial sections with α-LC3 and DAPI in littermate control (Ctrl) and ApomTG male mice 48 hours posttreatment with saline or Dox (10 mg/kg) intraperitoneally (IP) and, 4 hours before being sacrificed, with vehicle vs chloroquine (60 mg/kg) IP (scale bar = 5 μm). (B) Blinded quantification of LC3 foci from A. Two-way analysis of variance (ANOVA) with Sidak’s correction for multiple comparisons (n = 3 per group). Data were log transformed because of violation of normality. (C) Representative images of immunohistochemical staining of midmyocardial sections with α-p62 and DAPI in mice from A (scale bar = 5 μm). (D) Blinded quantification of p62 foci from C. Two-way ANOVA with Sidak’s correction for multiple comparisons (n = 3 per group). Data were log transformed because of violation of normality. (E, F) LC3B and p62 messenger RNA abundance accessed by quantitative polymerase chain reaction in Ctrl and ApomTG male mice 48 hours posttreatment with saline or 10 mg/kg Dox IP. Two-way ANOVA with Sidak’s correction for multiple comparisons (n = 4 per group). (G) Representative Western blot for myocardial soluble vs insoluble p62 from ApomKO and ApomKOApomTG male mice 5 days after 15 mg/kg Dox IP. (H) The ratio of insoluble p62/total protein (based on Ponceau S) relative to the soluble p62/total protein. Student’s t-test (n = 6 ApomKO vs n = 5 ApomKOApomTG). (I) Representative Western blot for myocardial soluble vs insoluble p62 from patients with a history of heart failure caused by anthracycline cardiomyopathy vs donor controls obtained from patients without any known clinical heart failure. (J) The ratio of insoluble p62/total protein relative to the soluble p62/total protein. Student’s t-test (n = 6 per group). Each dot represents 1 mouse in B, D, E, F, and H or 1 patient in J. ∗P < 0.05. ∗∗P < 0.01. AC = anthracycline cardiomyopathy; CQ = chloroquine; DAPI = 4′,6-diamidino-2-phenylindole; rel. = relative; Veh = vehicle; other abbreviations as in Figures 1 and 2.
Figure 4
Figure 4
ApoM Attenuates Dox-Induced Reductions in Nuclear TFEB (A) Representative Western blot of TFEB from isolated myocardial nuclear protein extracts from littermate control (Ctrl) and ApomTG male mice. (B) Quantification of nuclear TFEB from A. Student’s t-test (n = 10 per group). (C) Representative Western blot of TFEB from isolated myocardial nuclear protein extracts from Ctrl and ApomTG male mice 48 hours after treatment with saline or Dox (10 mg/kg) IP. (D) Quantification of nuclear TFEB from C. Two-way analysis of variance (ANOVA) with Sidak’s correction for multiple comparisons (n = 4 per group). (E) Representative Western blot of TFEB from isolated myocardial nuclear protein extracts of ApomKO male mice 2 days after transfer of 120 μL plasma obtained from ApomKO or ApomTG donor mice 48 hours after treatment with saline or Dox (10 mg/kg) intraperitoneally. (F) Quantification of nuclear TFEB from E. Two-way ANOVA with Sidak’s correction for multiple comparisons (n = 4 per group). (G) Representative Western blot of p-mTOR (Ser244), mTOR, p-AMPKα (Thr172), and AMPKα from myocardial protein extracts obtained from ApomKO male mice 2 days after transfer of 120 μL plasma obtained from ApomKO (KO) or ApomTG (TG) donor mice. (H, I) Quantification of p-mTORSer2448/mTOR and p-AMPKαThr172/AMPKα from G. Student’s t-test (n = 6 per group). (J) Representative Western blot of p-ULK1 (Ser757), ULK1, p-P70S6K (Thr389), P70S6K, p-4E-BP1 (Thr37/46), and 4E-BP1 from myocardial protein extracts obtained from ApomKO male mice 2 days after transfer of 120 μL plasma obtained from ApomKO (KO) or ApomTG (TG) donor mice. (K to M) Quantification of p-ULK1Ser757/ULK1, p-P70S6KThr389/P70S6K, and p-4E-BP1Thr37/46/4E-BP1 from J. Student’s t-test (n = 4 per group). Each dot represents 1 mouse in B, D, F, H, I, and K to M. ∗P < 0.05. ∗∗P < 0.01. ∗∗∗P < 0.001. AMPK = AMP-activated protein kinase; H3 = histone H3; mTOR = mammalian target of rapamycin; p- = phosphorylated; TFEB = transcription factor EB; other abbreviations as in Figures 1, 2, and 3.
Figure 5
Figure 5
ApoM Reduces Nuclear TFEB in an S1P-Dependent Manner Through S1PR3 (A) Representative Western blot of TFEB from isolated myocardial nuclear protein extracts from control (CTR) and ApoM triple mutant (TM) male mice that cannot bind S1P. (B) Quantification of nuclear TFEB from A. Student’s t-test (n = 3 per group). (C) Representative Western blot of TFEB from isolated myocardial nuclear protein extracts from WT and ApomKO male mice. (D) Quantification of nuclear TFEB from C. Student’s t-test (n = 3 per group). (E) Representative Western blot of TFEB from isolated myocardial nuclear protein extracts from WT and Apom+/- male mice. (F) Quantification of nuclear TFEB from E. Student’s t-test (n = 4 per group). (G) Representative Western blot of TFEB from isolated myocardial nuclear protein extracts in ApomTG mice crossed with S1pr3KO mice. (H) Quantification of nuclear TFEB from G. Student’s t-test (n = 4 per group male mice). Each dot represents 1 mouse in B, D, F, and H. ∗P < 0.05. ∗∗P < 0.01. S1P = sphingosine-1-phosphate; S1PR3 = sphingosine-1-phosphate receptor 3; other abbreviations as in Figures 1, 3, and 4.
Figure 6
Figure 6
ApoM, TFEB, and Anthracycline Cardiotoxicity (A) TFEB messenger RNA abundance accessed by quantitative polymerase chain reaction in littermate control (Ctrl) and ApomTG male mice transduced with AAV9-shScramble or AAV9-shTFEB. Two-way analysis of variance (ANOVA) with Sidak’s correction for multiple comparisons (n = 4 per group). (B-D) Heart rate, EF, and log-transformed end-diastolic volume assessed by echocardiography 2 weeks after viral transduction. Two-way ANOVA with Sidak’s correction for multiple comparisons (n=7 per group). (E) Representative images of immunohistochemical assessment of LC3 foci in myocardial sections (scare bar = 5 μm). (F) Blinded quantification of LC3 foci from E. Two-way ANOVA with Sidak’s correction for multiple comparisons (n = 4 per group). Each dot represents 1 mouse in A to D and F. ∗P < 0.05. ∗∗P < 0.01. AAV9 = adeno-associated virus 9; DAPI = 4′,6-diamidino-2-phenylindole; sh = short hairpin; other abbreviations as in Figures 2 and 4.
Figure 7
Figure 7
ApoM and S1P Attenuate Dox-Induced Lysosomal Injury (A) Representative images of red fluorescence of midmyocardial sections in Myh6-Cre × Rosa-LAMP1-RFP mice injected with 120 μL plasma obtained from ApomTG mice and then treated with 2 days of Dox (10 mg/kg) intraperitoneally. (B) Blinded quantification of red/blue intensity from A. One-way analysis of variance with Sidak’s correction for multiple comparisons (n = 3 per sex-matched group). Each dot represents 1 mouse. (C) S1P mimetic pretreatment of neonatal rat cardiomyocytes attenuates lysosomal injury. Representative pseudocolor excitation ratio images of Lysosensor-loaded lysosomes in cells exposed to DMSO, 0.5 μmol/L Dox, and 0.5 μmol/L Dox with 25 nmol/L FTY720 pretreatment for 5 minutes. Cells were incubated with 1 μmol/L Lysosensor Yellow/Blue DND 160 for 3 minutes, washed with Hank's balanced salt solution, and imaged by collecting pairs of images excited at 380 nm and 340 nm through a long-pass 480-nm emission filter through a 40×/1.35 oil immersion lens (Olympus). Frequency distribution of the excitation ratio values in single lysosomes (scale bar = 25 μm). White arrows indicate lysosomes. (D) Graph of the numbers of lysosomes with pH from C, and data for individual lysosomes pooled from 3 separate litters of rats were collected in 30 to 60 individual cells (chi-square test). ∗P < 0.05. ∗∗∗P < 0.001. DMSO = dimethyl sulfoxide; LAMP1 = lysosomal associated membrane protein 1; RFP = red fluorescent protein; other abbreviations as in Figures 1, 3, and 5.

References

    1. Sturgeon K.M., Deng L., Bluethmann S.M., et al. A population-based study of cardiovascular disease mortality risk in US cancer patients. Eur Heart J. 2019;40:3889–3897. - PMC - PubMed
    1. Armenian S., Bhatia S. Predicting and preventing anthracycline-related cardiotoxicity. Am Soc Clin Oncol Educ Book. 2018;38:3–12. - PubMed
    1. Lipshultz S.E., Colan S.D., Gelber R.D., Perez-Atayde A.R., Sallan S.E., Sanders S.P. Late cardiac effects of doxorubicin therapy for acute lymphoblastic leukemia in childhood. N Engl J Med. 1991;324:808–815. - PubMed
    1. Neilan T.G., Coelho-Filho O.R., Pena-Herrera D., et al. Left ventricular mass in patients with a cardiomyopathy after treatment with anthracyclines. Am J Cardiol. 2012;110:1679–1686. - PMC - PubMed
    1. Jordan J.H., Castellino S.M., Melendez G.C., et al. Left ventricular mass change after anthracycline chemotherapy. Circ Heart Fail. 2018;11 - PMC - PubMed