. 2023 Jun:109:102401.
doi: 10.1016/j.jairtraman.2023.102401. Epub 2023 Apr 5.

A data-driven analysis of the aviation recovery from the COVID-19 pandemic

Affiliations

A data-driven analysis of the aviation recovery from the COVID-19 pandemic

Xiaoqian Sun et al. J Air Transp Manag. 2023 Jun.

Abstract

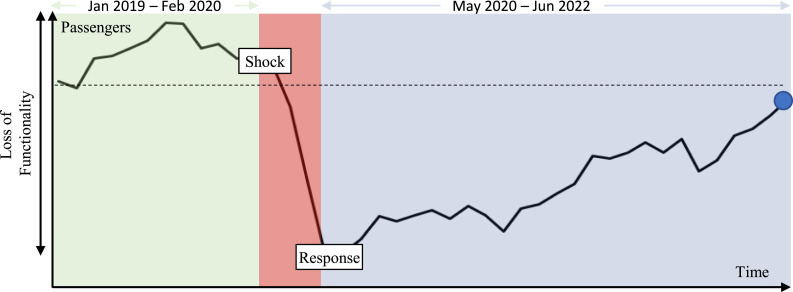
In Summer 2022, after a lean COVID-19 spell of almost three years, many airlines reported profits and some airlines even outperformed their pre-pandemic records. In context of the perceived recovery, it is interesting to understand how different markets have gone through the pandemic challenges. In this study, we perform a spatial and temporal dissection of the recovery process the global aviation system went through since May 2020. At the heart of this study, we investigate the patterns underlying market entry decisions during the recovery phase. We identify a rather heterogeneous type of recovery as well as its underlying drivers. We believe that our work is a timely contribution to the research on COVID-19 and aviation, complementary to the existing studies in the literature.

Keywords: Aviation; COVID-19; Markets; Recovery.


Figures

Fig. 1
Fig. 1
Identification of distinct analysis periods based on the monthly number of passengers in the global aviation system. Three periods are highlighted: pre-pandemic normality in green (Jan 2019–Feb 2020), the time from shock to response in red (Mar 2020–Apr 2020), and recovery in blue (May 2020–Jun 2022). (For interpretation of the references to color in this figure legend, the reader is referred to the web version of this article.)
Fig. 2
Fig. 2
Four distinct market types during pre-pandemic and recovery phase. The y-axis corresponds to the number of passengers on direct flights at the market and the x-axis visualizes time. The gray hatched area corresponds to the period between shock and response; since this study is concerned with recovery, we do not take into consideration the market evolution during that hatched period.
Fig. 3
Fig. 3
Toy example for visualizing the four market classes for recovery analysis based on an example with five months (left to right). The third month (highlighted in pink) is considered the period between shock and recovery. (For interpretation of the references to color in this figure legend, the reader is referred to the web version of this article.)
Fig. 4
Fig. 4
Recovery quadrants based on passenger (x-axis) and load factor (y-axis) ratios.
Fig. 5
Fig. 5
Overview on airports in this study. Each circle corresponds to one airport and the size correlates with the number of destinations served.
Fig. 6
Fig. 6
Evolution of the number of served markets in the four market types. The green areas highlight the Summer cycle (June–August, respectively) and the red area emphasizes the peak impact of COVID-19 (March and April 2020). (For interpretation of the references to color in this figure legend, the reader is referred to the web version of this article.)
Fig. 7
Fig. 7
Distribution of route size (log) across the four categories (red color) and over all markets (gray color) as reference. (For interpretation of the references to color in this figure legend, the reader is referred to the web version of this article.)
Fig. 8
Fig. 8
Distribution of departure frequencies (log) across the four categories (red color) and over all markets (gray color) as reference. (For interpretation of the references to color in this figure legend, the reader is referred to the web version of this article.)
Fig. 9
Fig. 9
Distribution of route length (log) across the four categories (red color) and over all markets (gray color) as reference. (For interpretation of the references to color in this figure legend, the reader is referred to the web version of this article.)
Fig. 10
Fig. 10
Dissection of market types by six market criteria.
Fig. 11
Fig. 11
Statistics at country level for domestic (top) and international (bottom) connections.
Fig. 12
Fig. 12
Evolution of load factors across the four market types.
Fig. 13
Fig. 13
Integrated comparison of passenger counts and load factors. The red box visualizes the area within standard deviation from the mean of both variables, respectively. (For interpretation of the references to color in this figure legend, the reader is referred to the web version of this article.)
Fig. 14
Fig. 14
Integrated comparison of passenger counts and load factors. For each market, the evolution of ratios is plotted using color, from the first month to the last month of the recovery. (For interpretation of the references to color in this figure legend, the reader is referred to the web version of this article.)
Fig. 15
Fig. 15
Comparison of seats per operations.

Similar articles

Cited by

References

    1. Abate M., Christidis P., Purwanto A.J. Government support to airlines in the aftermath of the COVID-19 pandemic. J. Air Trans. Manage. 2020;89 - PMC - PubMed
    1. Air A. 2023. Alaska air group delivers record-breaking second quarter 2022 results. https://investor.alaskaair.com/news-releases/news-release-details/alaska....
    1. Aydın U., Ülengin B. Analyzing air cargo flows of turkish domestic routes: A comparative analysis of gravity models. J. Air Trans. Manage. 2022;102
    1. Bauranov A., Parks S., Jiang X., Rakas J., González M.C. Quantifying the resilience of the US domestic aviation network during the COVID-19 pandemic. Front. Built Environ. 2021;7
    1. Blackman D., Nakanishi H., Benson A.M. Disaster resilience as a complex problem: Why linearity is not applicable for long-term recovery. Technol. Forecast. Soc. Change. 2017;121:89–98.

LinkOut - more resources